










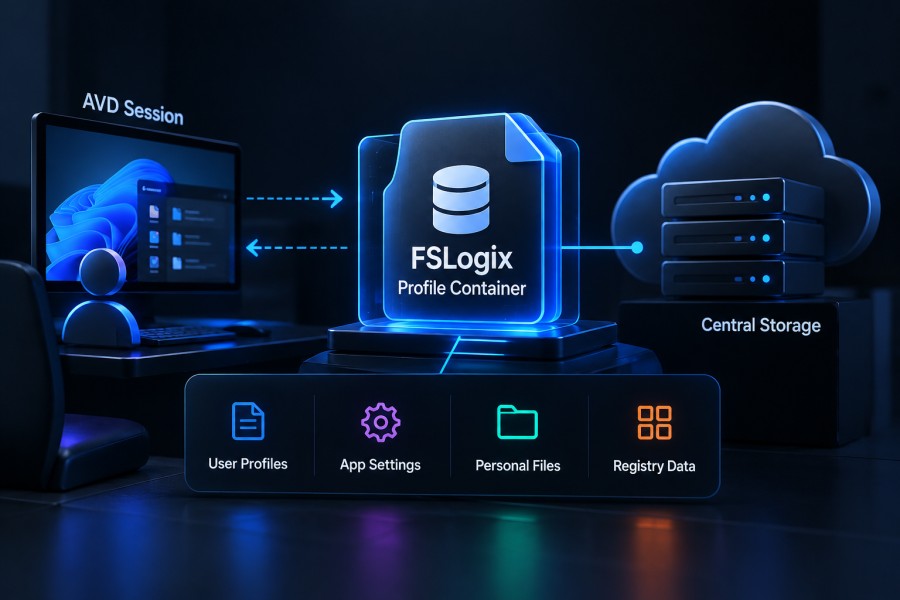
FSLogix profile containers sit at the core of the Azure Virtual Desktop user experience. When profile disk health degrades — through capacity issues, fragmentation, or mount failures – users face login delays, data loss, and session crashes. Most teams realize too late that CloudWatch’s default metrics are too coarse to catch profile disk problems before they cascade into support tickets.
According to the CNCF 2024 Observability Report, 73% of organizations running cloud workloads now monitor storage performance as a primary signal, yet profile-specific storage monitoring remains a gap in most AVD deployments. This guide walks through the specific steps to monitor FSLogix profile disk health in Azure Virtual Desktop, covering capacity tracking, mount failure detection, disk compaction monitoring, and alert configuration that catches issues before users notice them.
Prerequisites
Before setting up FSLogix profile disk monitoring, verify you have:
- FSLogix 2.9.8612 or later installed on AVD session hosts (required for disk compaction visibility)
- Azure Files or Azure NetApp Files storage account for profile containers
- PowerShell 5.1 or later on a management workstation or Azure Automation runbook
- Azure Monitor Log Analytics workspace configured for AVD session hosts
- Reader permissions on the storage account and session host resource group
- Network access to storage account SMB endpoints (port 445) from session hosts
- FSLogix registry keys configured at
HKLM\SOFTWARE\FSLogix\Profiles
Step 1: Enable FSLogix Event Logging
FSLogix writes critical profile disk health events to Windows Event Logs under Microsoft-FSLogix-Apps/Admin and Microsoft-FSLogix-Apps/Operational. These logs surface mount failures, capacity issues, and disk compaction status. By default, operational logs are disabled.
Enable operational logging with this PowerShell script run on each AVD session host:
$logName = "Microsoft-FSLogix-Apps/Operational"
$log = New-Object System.Diagnostics.Eventing.Reader.EventLogConfiguration $logName
$log.IsEnabled = $true
$log.SaveChanges()
Write-Host "FSLogix Operational logging enabled on $env:COMPUTERNAME"Verify logging is active by checking for Event ID 1 (profile attach success) after a user logs in. If Event ID 1 does not appear within 30 seconds of user login, the FSLogix agent may not be running, or the profile path is misconfigured.
Key FSLogix Event IDs to monitor:
- Event ID 33: Profile disk is full or near capacity
- Event ID 51: Profile failed to attach
- Event ID 52: Profile detached successfully
- Event ID 61: Disk compaction succeeded
- Event ID 62: Disk compaction failed
- Event ID 70: Profile disk mount timeout
Step 2: Configure Azure Monitor to Collect FSLogix Events
Azure Monitor Log Analytics can ingest Windows Event Logs from AVD session hosts and surface profile disk issues in real time. This step configures data collection rules to capture FSLogix events.
Create a data collection rule in the Azure portal:
- Navigate to Azure Monitor > Data Collection Rules
- Click Create and select Windows as the resource type
- Add your AVD session host resource group as the target
- Under Data Sources, select Windows Event Logs
- Add the following event log paths:
Microsoft-FSLogix-Apps/Admin
Microsoft-FSLogix-Apps/Operational- Set event levels to Warning, Error, and Critical
- Configure the destination as your Log Analytics workspace
- Review and create the rule
Verify ingestion by running this KQL query in your Log Analytics workspace after 5 minutes:
Event
| where Source == "FSLogix-Apps"
| where TimeGenerated > ago(1h)
| summarize count() by EventID, ComputerIf no results appear, verify the data collection rule is assigned to your session hosts, and FSLogix logging is enabled per Step 1.
Step 3: Monitor Profile Disk Capacity with PowerShell
FSLogix profile containers are virtual disks (VHD or VHDX) stored on Azure Files or NetApp. Each profile has a maximum size defined in the FSLogix registry (SizeInMBs setting, default 30 GB). When a profile reaches 95% capacity, users encounter save failures and session instability.
This PowerShell script measures actual disk usage for all profiles on a file share and flags profiles over 80% full:
$profilePath = "\\storageaccount.file.core.windows.net\profiles"
$thresholdPercent = 80
$profiles = Get-ChildItem -Path $profilePath -Filter "*.vhdx" -Recurse
foreach ($profile in $profiles) {
    $disk = Get-VHD -Path $profile.FullName
    $usedGB = [math]::Round($disk.FileSize / 1GB, 2)
    $maxGB = [math]::Round($disk.Size / 1GB, 2)
    $usedPercent = [math]::Round(($disk.FileSize / $disk.Size) * 100, 2)

    if ($usedPercent -ge $thresholdPercent) {
        Write-Warning "Profile $($profile.Name) is $usedPercent% full ($usedGB GB / $maxGB GB)"
    }
}Schedule this script as an Azure Automation runbook to run every 6 hours. Send results to a Log Analytics custom log or trigger an alert via webhook when profiles exceed the threshold.
Profile disk size can be increased per user by editing the FSLogix registry key SizeInMBs and triggering a profile recreate. This does not expand existing VHD files; it only applies to new profiles.
Step 4: Track Profile Mount Failures with Event ID 51
Event ID 51 indicates FSLogix could not attach a profile container during user login. Common causes include network latency to storage, file locks from stale sessions, or corrupted VHD files. Mount failures surface as user-visible login hangs lasting 30 to 90 seconds before fallback to a temporary profile.
Create a Log Analytics alert for mount failures:
Event
| where Source == "FSLogix-Apps"
| where EventID == 51
| where TimeGenerated > ago(15m)
| summarize FailureCount = count() by Computer, RenderedDescription
| where FailureCount > 2This query triggers when more than 2 mount failures occur on a single session host in 15 minutes. Configure the alert to fire at Severity 2 and route to your incident management system.
Troubleshooting mount failures:
- Verify SMB connectivity from the session host to the storage account (Test-NetConnection on port 445)
- Check storage account throttling metrics in Azure Monitor
- Review FSLogix log
C:\ProgramData\FSLogix\Logs\Profile\*.logfor detailed error codes - Confirm no stale user sessions hold locks on the VHD file
Step 5: Monitor Disk Compaction Status
FSLogix disk compaction (introduced in version 2.9.8440) reclaims empty space inside VHD files when deleted data leaves holes. Compaction runs automatically when a profile has more than 20% empty space and the Windows “Optimize Drives” service is enabled.
Disk compaction failures show as Event ID 62. Most failures occur because the Optimize Drives service is disabled – a legacy VDI optimization that now breaks FSLogix compaction.
Verify Optimize Drives service status on session hosts:
Get-Service -Name defragsvc | Select-Object Name, Status, StartTypeIf StartType is Disabled, re-enable it:
Set-Service -Name defragsvc -StartupType Automatic
Start-Service -Name defragsvcMonitor compaction success rate with this KQL query:
Event
| where Source == "FSLogix-Apps"
| where EventID in (61, 62)
| summarize Successful = countif(EventID == 61), Failed = countif(EventID == 62) by bin(TimeGenerated, 1d)
| extend SuccessRate = (Successful * 100.0) / (Successful + Failed)A success rate below 80% indicates either the Optimize Drives service is disabled or storage latency is preventing compaction from completing within the timeout window (default 10 minutes).
Step 6: Set Up Capacity Alerts for Storage Accounts
Azure Files and NetApp storage have finite capacity. When storage reaches 90% full, new profile writes fail, and users cannot save data. Most teams discover this only after multiple users report save failures.
Create an Azure Monitor metric alert on storage account capacity:
- Navigate to your Azure Files storage account in the portal
- Select Alerts > New alert rule
- Add condition: Metric =
Used Capacity, Aggregation =Average, Threshold =90% - Set evaluation frequency to 5 minutes
- Configure an action group to notify your on-call team
For Azure NetApp Files, monitor the VolumeLogicalSize metric with the same 90% threshold.
Capacity alerts should trigger at least 24 hours before projected exhaustion to allow time for capacity expansion. Calculate projected exhaustion date using this formula:
Days remaining = (Total capacity - Current usage) / Average daily growth rateStep 7: Create a Unified FSLogix Health Dashboard
Aggregate FSLogix metrics into a single dashboard for visibility across profile health, mount success rate, compaction status, and storage capacity.
Create a Log Analytics workbook with these visualizations:
Profile mount success rate (last 24 hours):
Event
| where Source == "FSLogix-Apps"
| where EventID in (1, 51)
| summarize Total = count(), Failed = countif(EventID == 51) by bin(TimeGenerated, 1h)
| extend SuccessRate = ((Total - Failed) * 100.0) / Total
| render timechartTop 10 largest profiles by disk usage:
// Requires custom log ingestion from Step 3 PowerShell script
ProfileCapacity_CL
| summarize arg_max(TimeGenerated, UsedPercent_d, UsedGB_d, MaxGB_d) by ProfileName_s
| top 10 by UsedPercent_d desc
| project ProfileName_s, UsedPercent_d, UsedGB_d, MaxGB_dDisk compaction failure rate (last 7 days):
Event
| where Source == "FSLogix-Apps"
| where EventID in (61, 62)
| summarize Successful = countif(EventID == 61), Failed = countif(EventID == 62) by bin(TimeGenerated, 1d)
| render barchartPin the workbook to an Azure dashboard visible to your support and engineering teams.
Troubleshooting Common Issues
Profile containers not appearing in Azure Files
Symptom: Users log in successfully, but no VHD files are created in the profile share.
Resolution:
- Verify the FSLogix registry key
VHDLocationspoints to the correct Azure Files UNC path - Confirm session hosts have network line of sight to the storage account on port 445
- Check storage account firewall rules allow traffic from session host subnet
- Review FSLogix agent log at
C:\ProgramData\FSLogix\Logs\Profile\*.logfor access denied errors
Disk compaction never runs
Symptom: Event ID 61 never appears in logs, and VHD files grow continuously without reclaiming space.
Resolution:
- Verify FSLogix version is 2.9.8440 or later using
Get-ItemProperty "HKLM:\SOFTWARE\FSLogix\Apps" | Select-Object ProductVersion - Confirm Optimize Drives service (
defragsvc) is running and set to Automatic - Check FSLogix registry key
IsDynamicis set to1(dynamic VHD required for compaction) - Increase compaction timeout by setting registry key
CompactionTimeoutMinutesto20
Profile mount timeouts during peak hours
Symptom: Users report 60 to 90 second login delays during morning hours with Event ID 70 in logs.
Resolution:
- Monitor Azure Files or NetApp latency metrics during peak hours – sustained latency above 50ms causes mount timeouts
- Enable Azure Files Premium tier for lower latency and higher IOPS
- Reduce profile container size by archiving old user data (Outlook OST files, browser caches)
- Distribute users across multiple storage accounts to reduce contention
Storage capacity alerts fire but usage metrics show 60% full
Symptom: Capacity alert triggers but Azure portal shows storage account is only 60% utilized.
Resolution:
- Check for VHD file fragmentation consuming extra space – empty blocks inside VHD files count toward storage usage
- Run disk compaction manually on all profiles using
Optimize-VHD -Path <profile.vhdx> -Mode Full - Review snapshot retention policies – old snapshots consume capacity but do not appear in used capacity metrics
- Verify quota limits on individual file shares – a 100 TB storage account can still hit quota on a single 5 TB share
Frequently Asked Questions
What is the default size of an FSLogix profile container?
The default FSLogix profile container size is 30 GB, defined by the `SizeInMBs` registry key at `HKLM\SOFTWARE\FSLogix\Profiles`. This value can be increased per user by editing the registry or deploying a Group Policy setting before first login.
How do I check current FSLogix profile disk usage?
Run `Get-VHD -Path \\storage\share\profile.vhdx` in PowerShell to see the `FileSize` (actual space consumed) and `Size` (maximum capacity). Divide FileSize by Size to calculate percent full.
Where are FSLogix profiles stored in Azure Virtual Desktop?
FSLogix profiles are stored on Azure Files or Azure NetApp Files storage accounts as VHD or VHDX files. The storage path is defined in the FSLogix registry key `VHDLocations` and typically follows the format `\\storageaccount.file.core.windows.net\profiles\%username%\Profile.vhdx`.
How often should I monitor FSLogix disk health?
Profile capacity and mount success rate should be monitored continuously with alerts firing on thresholds. Run detailed capacity reports daily and review disk compaction status weekly. Storage account capacity should trigger alerts at 90% with evaluation every 5 minutes.
Can I monitor FSLogix profiles without Azure Monitor?
Yes. FSLogix events write to Windows Event Logs on session hosts and can be collected by any SIEM or log aggregation tool. PowerShell scripts can run locally or via scheduled tasks to measure disk usage and send results to third-party monitoring platforms.
What causes FSLogix profile mount failures in AVD?
Mount failures result from network latency to storage (above 50ms sustained), file locks from stale sessions, corrupted VHD files, or storage account throttling. Event ID 51 provides the specific error code; common codes include 0x80070035 (network path not found) and 0x80070020 (file in use by another process).
Does CubeAPM support FSLogix profile monitoring?
CubeAPM’s infrastructure monitoring platform can ingest Windows Event Logs from AVD session hosts and surface FSLogix events alongside APM traces and logs. This enables correlation between profile mount failures and application performance issues in a single view.
Disclaimer: The information in this article reflects the latest details available at the time of publication and may change as technologies and products evolve. Features, pricing, and configuration options can change over time. Always verify the latest information directly with Microsoft and FSLogix documentation before making deployment decisions.