










Azure Virtual Desktop environments fail silently when session hosts run out of memory, user connections time out during peak hours, or FSLogix profile disk latency degrades gradually over weeks. Without monitoring that tracks session host health, connection quality, and resource saturation in real time, teams discover these issues only after users complain or productivity drops.
According to Microsoft’s 2024 Azure Virtual Desktop adoption report, 68% of organizations running AVD at scale experienced at least one performance incident in their first year that could have been prevented with proactive monitoring. The report also found that teams using comprehensive AVD monitoring reduced mean time to resolution by 45% compared to those relying on native Azure Monitor alone.
This guide covers what Azure Virtual Desktop monitoring is, how it works, what metrics and signals matter most, best practices for setting up monitoring across session hosts and host pools, and how to choose the right tools for your AVD environment.
What Is Azure Virtual Desktop Monitoring?
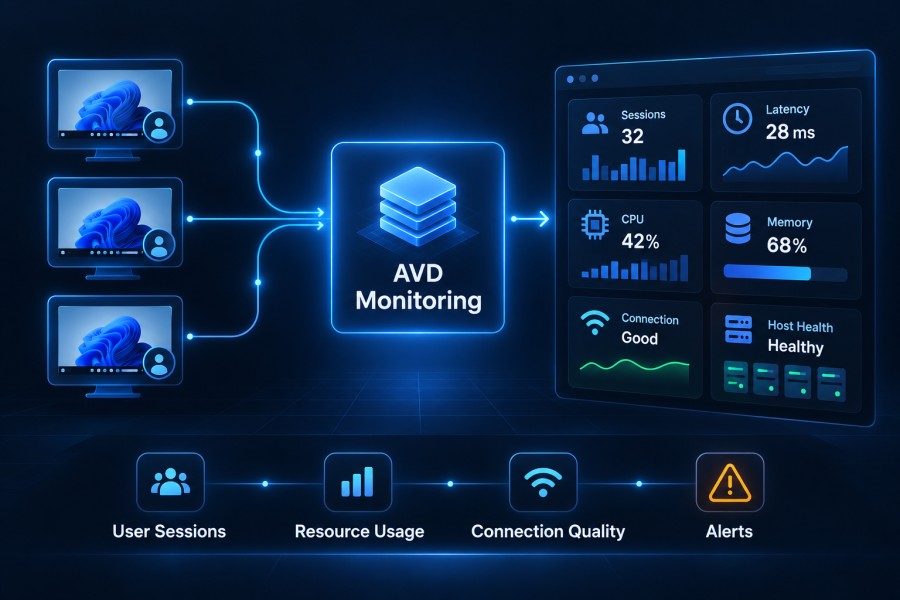
Azure Virtual Desktop monitoring is the practice of continuously tracking the health, performance, and availability of all components in an AVD deployment, including session hosts, host pools, workspaces, user sessions, FSLogix profiles, network connections, and Azure Active Directory authentication.
Effective AVD monitoring answers four questions in real time: Are session hosts healthy and available? Are users experiencing slow connections or latency? Are resources CPU, memory, disk saturated or approaching limits? Are authentication or profile load failures blocking user sessions?
Unlike traditional server monitoring that focuses only on host-level metrics, AVD monitoring must track user session quality, connection broker behavior, profile disk performance, and multi-session density dynamics that are unique to virtual desktop infrastructure.
The goal is to detect problems before they cascade into user impact. A session host running at 95% memory for 10 minutes should trigger an alert before it hits OOMKill and drops active user sessions. A gateway connection failure in one Azure region should surface immediately so traffic can be rerouted before users notice degraded experience.
How Azure Virtual Desktop Monitoring Works
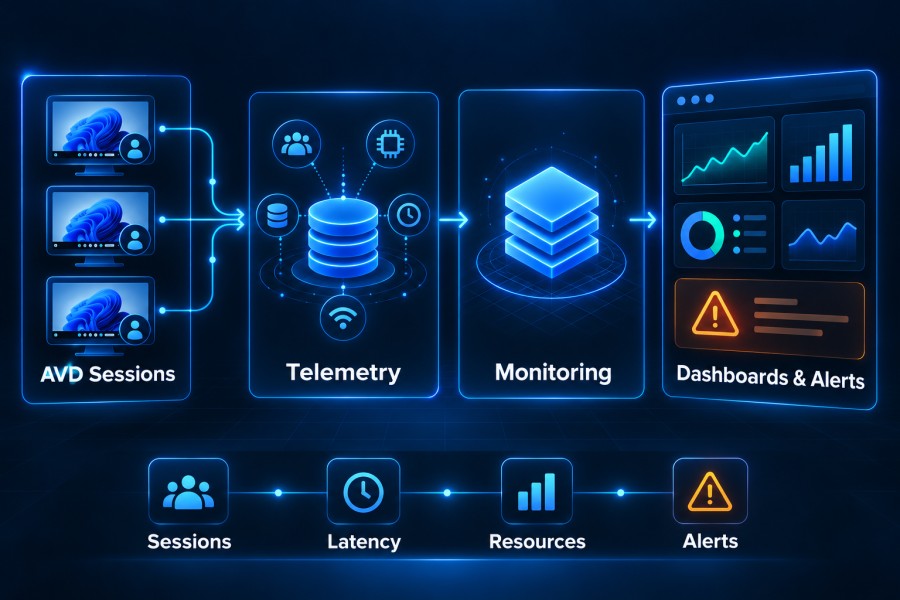
Azure Virtual Desktop monitoring operates across multiple layers: infrastructure, platform services, user sessions, and application performance. Each layer generates different telemetry signals that must be collected, correlated, and analyzed together to understand the complete health of an AVD environment.
Data Collection Architecture
AVD monitoring starts with the Azure Monitor Agent (AMA) installed on every session host. AMA collects performance counters CPU, memory, disk, network and Windows Event Logs from session hosts and sends them to a Log Analytics workspace. This is the foundation Microsoft provides through Azure Virtual Desktop Insights.
On top of AMA, teams typically deploy additional agents or exporters to collect signals Microsoft does not capture by default: application-level traces from business apps running inside user sessions, real user monitoring data showing actual page load times and interaction latency inside the virtual desktop, FSLogix profile container metrics showing VHD mount times and disk latency, and network quality metrics showing round-trip time and packet loss between user endpoints and session hosts.
All telemetry flows into a central monitoring platform where it is indexed, correlated, and queried. Azure Monitor Workbooks, third-party APM tools, or dedicated VDI monitoring platforms aggregate this data into dashboards that show session host health, user session quality, and resource utilization across the entire AVD environment.
What Gets Monitored
Session hosts are monitored for CPU, memory, disk, and network utilization at the OS level, plus Windows Event Logs showing application crashes, security events, and system errors. Host pools are tracked for available capacity, active sessions, and connection broker health. User sessions are monitored for connection success rate, logon duration, profile load time, and in-session latency. FSLogix profile containers are tracked for mount time, VHD disk latency, and profile size growth. Azure Active Directory authentication events are monitored for failures, timeouts, and MFA issues blocking user logons.
Workload-specific monitoring varies by what runs inside the AVD sessions. Teams running web apps monitor page load times and API response latency. Teams running thick client apps like CAD software or trading platforms monitor process-level CPU and memory plus application-specific metrics exposed via custom instrumentation.
Alert Thresholds and Response
Effective AVD monitoring sets alert thresholds based on user impact, not just infrastructure metrics. A session host at 80% CPU is not necessarily a problem if user sessions remain responsive. But a session host consistently running above 90% memory with active paging is a problem because it causes user session freezes and application crashes.
Common alert thresholds include: session host memory above 85% for more than 5 minutes, user connection failures above 2% of total attempts in a 10-minute window, FSLogix profile load time exceeding 15 seconds, session host CPU above 90% sustained for more than 10 minutes, and Azure AD authentication failures spiking above baseline.
Alerts route to Slack, Teams, PagerDuty, or email with full context showing which session host, host pool, or user group is affected and what metric crossed the threshold. Without context, alerts create noise. With context, they enable fast triage and resolution.
Key Metrics to Track in Azure Virtual Desktop Monitoring
Not all AVD metrics matter equally. Some are leading indicators of problems that let you intervene before users notice. Others are lagging indicators that confirm damage already done. The metrics below are prioritized by their usefulness in preventing incidents and reducing mean time to resolution.
Session Host Resource Saturation
CPU utilization above 85% sustained indicates the host is oversubscribed and users will experience application lag. Memory utilization above 90% triggers paging, which freezes user sessions. Disk queue length above 10 shows a storage bottleneck, causing slow file opens and saves. Network bandwidth saturation appears as dropped packets and connection timeouts.
These metrics must be tracked per session host, not averaged across a host pool. One saturated host in a pool of 10 affects 10% of users but gets hidden in aggregate metrics.
User Session Connection Quality
Connection success rate shows what percentage of user connection attempts succeed. Anything below 98% indicates authentication issues, capacity problems, or network failures. Logon duration measures time from connection attempt to desktop ready. Anything above 30 seconds frustrates users. In-session latency tracks round-trip time between user input and screen response. Above 100ms feels sluggish.
These metrics are captured by Azure Virtual Desktop Insights when configured correctly. They require diagnostics enabled on host pools and workspaces, plus the Azure Monitor Agent collecting session host data.
FSLogix Profile Container Performance
Profile load time shows how long it takes to mount a user’s FSLogix VHD at logon. Load times above 15 seconds cause visible delays before the desktop appears. VHD disk latency measures read and write latency to the profile container storage. Latency spikes cause file operation delays inside the session. Profile container size growth over time can indicate profile bloat from temp files or cached data not being cleaned up.
FSLogix metrics require custom collection because Azure Monitor does not capture them by default. Tools like infrastructure monitoring platforms or dedicated VDI monitoring solutions collect these via WMI queries or file system watchers.
Host Pool Capacity and Scaling
Available session capacity shows how many additional user sessions the host pool can accept before hitting max density. When available capacity drops below 10%, new users may hit “no resources available” errors. Active sessions compared to configured max sessions per host shows whether hosts are running at target density. Underutilized hosts waste Azure compute costs.
Scaling lag measures how long autoscaling takes to provision new session hosts when demand spikes. If autoscaling takes 8 minutes but user demand doubles in 3 minutes, users see connection failures during that gap.
Azure AD Authentication Failures
AAD sign-in failures show users blocked by authentication errors. Spikes indicate AAD service issues, conditional access policy misconfigurations, or MFA problems. MFA timeout rate tracks how often users fail to complete MFA within the timeout window. High timeout rates suggest users are not receiving MFA prompts or push notifications are delayed.
These metrics come from Azure AD sign-in logs and require a separate Log Analytics workspace query. They are critical because authentication failures block access entirely, even if session hosts are perfectly healthy.
Best Practices for Azure Virtual Desktop Monitoring
Setting up AVD monitoring is not just enabling Azure Virtual Desktop Insights and hoping for the best. Effective monitoring requires deliberate data collection configuration, alert tuning, and ongoing refinement as workload patterns change.
Enable Diagnostics on All AVD Resources
Azure Virtual Desktop diagnostics must be enabled on host pools, workspaces, and application groups to collect connection events, session lifecycle data, and user activity telemetry. Without diagnostics enabled, Azure Virtual Desktop Insights cannot function. This is configured per resource in the Azure portal under Diagnostic Settings. All diagnostic logs should route to the same Log Analytics workspace used for session host performance data to enable correlation.
Deploy Azure Monitor Agent to All Session Hosts
The Azure Monitor Agent must be installed on every session host in every host pool. AMA collects performance counters and Windows Event Logs and sends them to Log Analytics. This requires a Data Collection Rule (DCR) that specifies which performance counters and event logs to collect. Microsoft provides a default DCR template for AVD that includes the most common metrics, but most teams need to customize it to add application-specific counters or additional event log sources.
Set Alerts Based on User Impact, Not Infrastructure Metrics
Alert on session connection failure rate exceeding 2%, not on “a session host is at 80% CPU.” Alert on FSLogix profile load time exceeding 15 seconds, not on “disk latency is high.” Alert on user logon duration exceeding 45 seconds, not on “AAD query time increased.” Alerts based on user-facing symptoms reduce noise and align monitoring with business impact.
Monitor Across Multiple Dimensions
Track metrics by host pool, by session host, by user group, and by Azure region. A problem affecting only one session host in a pool may not show up in pool-level aggregates. A problem affecting only users in one region may be invisible in global averages. Dimensional tagging in your monitoring tool lets you slice data by these attributes and isolate problems faster.
Integrate AVD Monitoring with Broader Observability
AVD monitoring should not live in isolation. User sessions connect to backend APIs, databases, and SaaS services that all affect user experience. Correlate AVD session metrics with APM traces from backend services, infrastructure metrics from Azure SQL or storage accounts, and Real User Monitoring data showing actual user experience inside the virtual desktop. This end-to-end view is what separates reactive troubleshooting from proactive performance management.
Tools for Azure Virtual Desktop Monitoring
Multiple approaches exist for monitoring AVD. Native Azure tools provide the baseline, third-party platforms add depth, and self-hosted solutions offer data control. Most teams use a combination.
Azure Monitor and Azure Virtual Desktop Insights
Azure Virtual Desktop Insights is Microsoft’s native monitoring solution built on Azure Monitor Workbooks. It provides pre-built dashboards showing session host health, user connections, and performance metrics. Insights requires diagnostics to be enabled on all AVD resources and the Azure Monitor Agent to be deployed to all session hosts. Data flows into a Log Analytics workspace where you query it using KQL (Kusto Query Language).
Insights is free beyond the Log Analytics workspace ingest and retention costs, typically $0.35 per GB ingested. For a 50-session host environment generating 10 GB per day, monthly Log Analytics cost runs approximately $105. The main limitation is that Insights shows only what Microsoft collects by default. Application-level metrics, FSLogix details, and custom performance counters require additional configuration or third-party tools.
Third-Party APM and Infrastructure Monitoring Platforms
Platforms like Datadog, Dynatrace, and New Relic offer AVD monitoring extensions that collect session host metrics, user session data, and application performance traces. These tools typically charge per host monitored. Datadog Infrastructure Monitoring costs $18 per host per month for a 50-host AVD environment; that is $900 per month before adding APM or log ingestion. Dynatrace charges $0.08 per host hour, which works out to approximately $58 per host per month or $2,900 for 50 hosts.
Third-party platforms provide richer dashboards, more flexible alerting, and better correlation across AVD, backend services, and cloud infrastructure. The tradeoff is significantly higher cost and the fact that all telemetry data leaves your Azure environment and flows to the vendor’s SaaS platform. For organizations with data residency or compliance requirements, this external data flow can be a blocker.
Self-Hosted Monitoring with CubeAPM
CubeAPM runs inside your own Azure environment as a fully managed but self-hosted observability platform. It collects AVD session host metrics, application traces, logs, and user session telemetry without sending any data outside your Azure subscription. CubeAPM uses the same Azure Monitor Agent and Data Collection Rules as Azure Virtual Desktop Insights but adds APM tracing, log aggregation, and customizable dashboards on top.
CubeAPM pricing is $0.15 per GB of telemetry ingested, with unlimited retention and no per-host or per-user fees. For a 50-session host AVD environment generating 10 GB of telemetry per day (300 GB per month), the monthly cost is $45 before Azure compute and storage for the CubeAPM backend, typically another $50 to $100 depending on instance size and retention period.
The main advantage is full data control and the ability to keep AVD telemetry inside your compliance boundary. CubeAPM also integrates with synthetic monitoring for proactive session health checks and supports OpenTelemetry instrumentation for custom application metrics from apps running inside AVD sessions.
Dedicated VDI Monitoring Solutions
Tools like ControlUp, Liquidware, and Goliath Technologies specialize in virtual desktop monitoring and provide deeper visibility into user session experience than general-purpose monitoring platforms. These tools typically cost $15 to $30 per named user per year. For 500 AVD users, annual cost runs $7,500 to $15,000.
Dedicated VDI tools excel at user experience scoring, endpoint device monitoring, and detailed session replay capabilities. The tradeoff is that they monitor only the VDI layer, not backend application services or cloud infrastructure. Most teams using dedicated VDI monitoring also run a general-purpose APM or infrastructure monitoring tool for broader coverage.
Azure Virtual Desktop Monitoring with CubeAPM

CubeAPM provides unified monitoring for Azure Virtual Desktop session hosts, user sessions, and the backend services your AVD workloads depend on. It deploys inside your Azure environment as a managed service running on your own VMs or AKS clusters, so all AVD telemetry stays within your compliance boundary.
What CubeAPM Monitors in AVD Environments
CubeAPM collects session host performance metrics (CPU, memory, disk, network) via the Azure Monitor Agent and custom Data Collection Rules. It ingests Azure Virtual Desktop diagnostics logs from host pools, workspaces, and application groups to track user connections, logon events, and session lifecycle. Application traces from business apps running inside AVD sessions are captured via OpenTelemetry instrumentation, giving visibility into API calls, database queries, and external service dependencies.
FSLogix profile container metrics are collected via custom WMI queries showing profile load time, VHD mount duration, and disk latency. Real user session data tracks in-session latency, application responsiveness, and user interaction delays. All telemetry flows into CubeAPM’s unified dashboard where session host health, user experience metrics, and application performance appear in a single correlated view.
Setting Up AVD Monitoring in CubeAPM
Configuration starts by deploying the Azure Monitor Agent to all session hosts using a Data Collection Rule that specifies which performance counters and event logs to collect. CubeAPM provides a pre-built DCR template for AVD that includes the most common metrics. Diagnostics must be enabled on all host pools, workspaces, and application groups with logs routed to the same Log Analytics workspace CubeAPM queries.
For application-level tracing, OpenTelemetry SDKs are added to apps running inside user sessions. CubeAPM supports auto-instrumentation for .NET, Java, Node.js, and Python apps, so adding tracing typically requires only environment variable configuration and an application restart. FSLogix metrics require a custom collection script deployed to session hosts via Azure Automation or Group Policy.
Once data flows into CubeAPM, dashboards show session host health by host pool, user connection success rate over time, FSLogix profile load time by user group, and application performance traces correlated with session host resource utilization. Alerts can be configured on any metric, with notifications routed to Slack, Teams, PagerDuty, or email.
Why Teams Choose CubeAPM for AVD Monitoring
CubeAPM keeps all AVD telemetry data inside your Azure environment. This eliminates data egress costs (typically $0.10 per GB when sending to external SaaS tools) and meets data residency requirements for regulated industries. Pricing is predictable at $0.20 per GB ingested with no per-host or per-user fees. A 50-session host AVD environment generating 300 GB of telemetry per month costs $60 per month for CubeAPM ingestion, compared to $900 per month or more with traditional per-host SaaS monitoring.
CubeAPM correlates AVD session host metrics with application traces and logs in a single view. When a user reports a slow session, CubeAPM shows whether the bottleneck is session host CPU saturation, network latency, FSLogix profile load time, or a slow database query in the backend application. This end-to-end visibility reduces mean time to resolution by eliminating the need to switch between multiple monitoring tools to diagnose issues.
Monitoring AVD Session Hosts vs Host Pools vs Workspaces
Azure Virtual Desktop has a specific resource hierarchy, and monitoring each layer requires different approaches. Confusing these layers is a common mistake that leads to incomplete monitoring coverage or alert fatigue from the wrong signals.
Session Host Monitoring
Session hosts are the individual VMs running Windows that users connect to. Each session host must be monitored for CPU, memory, disk, and network utilization, plus Windows Event Logs showing application errors, security events, and system warnings. Session host metrics are collected by the Azure Monitor Agent and sent to Log Analytics.
Alerts should fire when a single session host exceeds resource thresholds, for example, memory above 85% for 5 minutes or when a session host stops sending heartbeat data, indicating the VM is unreachable. Session host-level monitoring is critical because problems often affect only one or two hosts in a pool, and pool-level averages hide these localized failures.
Host Pool Monitoring
Host pools are logical groups of session hosts that share the same configuration and are treated as a single unit for load balancing. Host pool monitoring tracks available capacity, active sessions, and connection success rate. Available capacity shows how many additional user sessions the pool can accept before hitting max density. This metric predicts when autoscaling should trigger to add more session hosts.
Connection success rate at the host pool level shows what percentage of user connection attempts to that pool succeed. Drops in connection success rate indicate capacity exhaustion, authentication failures, or session host health problems. Host pool metrics come from Azure Virtual Desktop diagnostics logs, not from the Azure Monitor Agent.
Workspace Monitoring
Workspaces are the user-facing entry point where users see their available applications and desktops. Workspace monitoring tracks user logon events, subscription access, and published resource availability. Workspace-level failures are less common but typically indicate Azure AD authentication issues, misconfigured application groups, or Azure Virtual Desktop control plane problems.
Most teams focus monitoring effort on session hosts and host pools because that is where the majority of performance and capacity issues occur. Workspace-level alerts are typically set only for critical failures like complete authentication outage or workspace unavailability.
Common Azure Virtual Desktop Monitoring Challenges
Even teams that have deployed Azure Virtual Desktop Insights and configured Data Collection Rules hit monitoring blind spots that cause missed incidents or slow troubleshooting.
FSLogix Profile Performance is Invisible by Default
Azure Monitor does not collect FSLogix metrics by default. Profile load time, VHD mount duration, and profile disk latency are critical to user experience but require custom collection scripts or third-party tools. Teams often discover FSLogix performance problems only after users complain about slow logons, at which point troubleshooting is reactive.
The solution is to deploy custom WMI queries or file system watchers on session hosts that capture FSLogix events and send them to your monitoring platform. CubeAPM provides pre-built FSLogix collectors that run as scheduled tasks on session hosts and send data to the CubeAPM backend.
Session Host Metrics Are Averaged Across Pools
Azure Virtual Desktop Insights dashboards often show host pool-level averages for CPU, memory, and active sessions. This hides problems affecting individual session hosts. A pool with 10 session hosts showing 60% average CPU might have one host at 95% CPU and nine hosts at 55%. Users on the saturated host experience lag, but pool-level averages make the problem invisible.
The solution is to always monitor session host metrics individually, not as pool averages. Set alerts on per-host thresholds, not pool averages. Most monitoring platforms including CubeAPM, support dimensional tagging that lets you query and alert on per-host metrics while still visualizing pool level rollups in dashboards.
Application Performance Inside Sessions is a Black Box
Azure Monitor collects OS level metrics but has no visibility into how applications perform inside user sessions. If a web app running inside AVD is slow because of a backend API timeout, Azure Monitor shows only that the session host CPU is normal. Without application-level tracing, diagnosing these issues requires guesswork or manual log review.
The solution is to instrument applications running inside AVD sessions with OpenTelemetry or APM agents. This captures API call latencies, database query durations, and external service dependencies. Tools like CubeAPM and Azure monitoring platforms that support APM tracing correlate application performance with session host metrics so you can see whether user experience problems originate from infrastructure or application code.
Alert Fatigue from Non-Actionable Thresholds
Teams often set alerts based on static thresholds like “alert if CPU exceeds 80%” without considering whether that threshold actually indicates user impact. This creates alert noise where most alerts do not require action. Alert fatigue causes teams to ignore or silence alerts, which means real problems get missed.
The solution is to set alerts based on user-facing symptoms (connection failures above 2%, logon time exceeding 30 seconds) rather than infrastructure metrics. Use anomaly detection instead of static thresholds for metrics with variable baselines. Tune alert sensitivity over time by reviewing past alerts and removing ones that fired but required no action.
Disclaimer: The information in this article reflects the latest details available at the time of publication and may change as technologies and products evolve. Features, pricing, and plan limits can change over time. Always verify the latest information directly with the vendor before making purchasing or deployment decisions.
Frequently Asked Questions
What is the difference between Azure Monitor and Azure Virtual Desktop Insights?
Azure Monitor is the underlying data platform that collects logs and metrics. Azure Virtual Desktop Insights is a pre-built dashboard layer on top of Azure Monitor that visualizes AVD specific metrics like session host health and user connections.
Do I need third party tools to monitor Azure Virtual Desktop?
Azure Virtual Desktop Insights provides basic monitoring for session hosts and user connections. Third party tools add application tracing, FSLogix metrics, and advanced alerting that Insights does not include.
How much does Azure Virtual Desktop monitoring cost?
Azure Virtual Desktop Insights itself is free. You pay only for Log Analytics workspace data ingestion and retention, typically $0.35 per GB. A 50 session host environment generating 10 GB per day costs approximately $105 per month.
What metrics are most important for AVD monitoring?
Session host memory and CPU utilization, user connection success rate, logon duration, FSLogix profile load time, and available session capacity in host pools are the highest priority metrics.
Can I monitor AVD without sending data outside Azure?
Yes. Azure Virtual Desktop Insights keeps data in your own Log Analytics workspace. Self hosted tools like CubeAPM also run entirely inside your Azure environment with no external data transfer.
How do I monitor FSLogix profile performance in AVD?
FSLogix metrics require custom collection since Azure Monitor does not capture them by default. Use WMI queries, file system watchers, or third party tools that include FSLogix monitoring.
What is the Azure Monitor Agent and why do I need it for AVD monitoring?
The Azure Monitor Agent collects performance counters and Windows Event Logs from session hosts and sends them to Log Analytics. It is required for Azure Virtual Desktop Insights to function.