










Service Level Objectives matter because they turn raw monitoring data into business context. Without SLOs, teams react to alerts that may not reflect user impact. With SLOs, every alert is connected to a defined reliability target, and error budgets give teams a quantified way to balance feature velocity against system stability. According to the 2024 CNCF Annual Survey, 68% of organizations now use SLOs to guide engineering decisions, yet most teams still track them manually in spreadsheets or static dashboards that cannot alert on burn rate or correlate SLO violations with underlying telemetry.
This guide compares 10 SLO monitoring tools across pricing models, error budget calculation methods, integration options, and deployment flexibility. Each tool is assessed on how it calculates SLOs, what data sources it supports, whether it can alert on burn rate, and what it costs at scale.
Quick Comparison: 10 SLO Monitoring Tools at a Glance
| Tool | Best For | Pricing Model | Free Plan? | SLO Types |
|---|---|---|---|---|
| CubeAPM | Self-hosted SLO tracking with full APM integration | $0.2/GB ingestion | ✗ Trial available | Time slice, occurrence-based |
| Nobl9 | Platform agnostic enterprise SLO management | Custom enterprise pricing | ✗ Demo only | Time slice, occurrence-based, composite |
| Datadog | Teams already using Datadog for monitoring | Host-based + data ingestion ($15-$31/host/month) | ✗ 14-day trial | Metric-based, time slice, monitor-based |
| SLOTracker | Open source burn rate tracking | Free open source | ✓ Fully free | Time slice, occurrence-based |
| New Relic | Unified observability platform with SLO layer | $0.40/GB beyond 100GB free + user seats | ✓ 100GB/month free | Availability, latency, custom |
| Google Cloud Operations | Native Google Cloud monitoring | Pay-as-you-go GCP pricing | ✓ Free tier | Latency, availability, request-based |
| Splunk Observability Cloud | Real-time streaming for high-scale environments | Custom pricing (starts ~$15/host/month) | ✗ Trial available | Standard, custom metrics |
| Grafana Cloud SLO | Teams already using Grafana for visualization | Free tier, Pro from $8/user/month | ✓ Free tier | Prometheus-based, time series |
| Lightstep | High-cardinality distributed tracing with SLOs | Custom pricing | ✗ Demo only | Service-level, span-based |
| Dynatrace | AI-driven automated SLO management | Host-based (starts ~$69/host/month) | ✗ 15-day trial | Service-level, synthetic, user action |
Pricing estimates based on publicly available rate cards as of early 2026. Enterprise discounts and custom contracts are not reflected here. Verify current pricing on vendor sites before committing.
1. CubeAPM

CubeAPM is a self-hosted observability platform that includes native SLO tracking alongside APM, logs, infrastructure monitoring, and error tracking. It runs inside your VPC or on-prem, keeping all telemetry data within your infrastructure while providing a unified view of service reliability against defined SLO targets.
Key Features:
- Native SLO tracking with time slice and occurrence-based calculation methods
- Error budget tracking tied directly to APM traces and logs for root cause analysis
- Automated burn rate alerts with configurable thresholds
- Service-level dashboards showing SLO status alongside RED metrics
- Full data residency with self-hosted deployment
Pricing:
$0.2/GB for all ingested data covering APM, logs, metrics, and SLO calculations. No separate host fees or user seats. Infrastructure costs depend on your deployment size but typically add ~$0.02/GB.
Pros:
- Unified platform eliminates need for separate SLO tooling
- Self-hosted deployment ensures full data control and compliance
- Error budgets automatically correlate with underlying traces and logs
- Predictable flat-rate pricing with no surprise overages
Cons:
- Requires self-managed infrastructure or BYOC deployment
- Smaller integration ecosystem compared to SaaS-only platforms
- Less mature composite SLO features than specialized tools like Nobl9
Best for: Teams that want SLO tracking tightly integrated with full-stack observability and need to keep telemetry data on-prem for compliance or cost reasons.
2. Nobl9
Nobl9 is a platform built specifically for enterprise SLO management. It integrates with existing monitoring tools rather than replacing them, pulling data from sources like Datadog, New Relic, Prometheus, Dynatrace, and Splunk to calculate SLOs using a unified framework.
Key Features:
- Platform agnostic integration with 15+ data sources using native query languages
- Time slice and occurrence-based SLO calculation methods
- Composite SLOs that combine multiple services into a single reliability measure
- Error budget policies with dynamic adjustment for planned maintenance
- Historical SLO replay to test configurations against past data
Pricing:
Custom enterprise pricing only. Nobl9 does not publish rate cards. Pricing depends on data volume, number of services monitored, and integration scope.
Pros:
- Works with your existing monitoring stack without ripping and replacing
- Strong governance features for managing SLOs at scale across teams
- Composite SLOs provide system-level reliability views
- Historical replay helps validate SLO configurations before going live
Cons:
- No transparent pricing makes cost forecasting difficult
- Enterprise-only focus rules it out for smaller teams
- Requires existing monitoring infrastructure to function
- Limited visibility into what pricing actually looks like until you engage sales
Best for: Large enterprises that already have monitoring tools in place and need a centralized way to manage SLOs across multiple platforms and teams.
3. Datadog
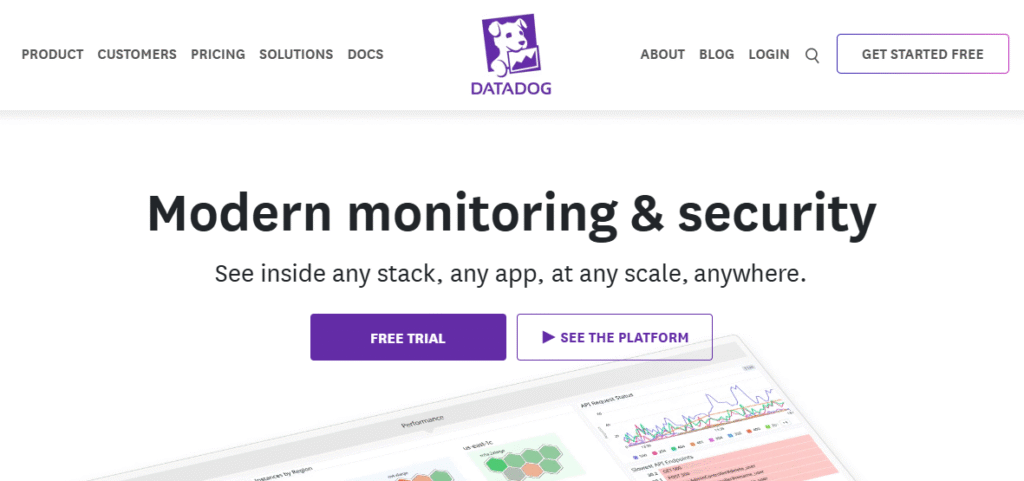
Datadog offers SLO monitoring as part of its broader observability platform. It supports three SLO calculation methods and integrates SLO tracking directly into Datadog dashboards, monitors, and alerting workflows.
Key Features:
- Metric-based SLOs using count-based SLI calculations
- Time slice SLOs for uptime and availability tracking
- Monitor-based SLOs that evaluate reliability using existing Datadog monitors
- Error budget tracking with real-time burn rate visualization
- SLO status corrections to exclude planned maintenance from calculations
Pricing:
Datadog pricing is host-based plus data ingestion. Infrastructure monitoring starts at $15/host/month, APM at $31/host/month. For a 50-host cluster with APM and logs, expect $2,500 to $4,000/month before SLO-specific features. Detailed breakdowns at Datadog’s pricing page.
Pros:
- Three distinct SLO calculation methods provide flexibility
- Deep integration with Datadog’s APM, logs, and infrastructure monitoring
- SLO dashboards can include up to 20 service groups per SLO
- Strong visualization with widgets for individual SLOs and SLO lists
Cons:
- Pricing compounds quickly as hosts, data volume, and feature usage increase
- SLO features are bundled into broader platform costs, not itemized separately
- Requires full Datadog adoption to get value from SLO tracking
- Cloud-only SaaS model rules it out for teams with data residency requirements
Best for: Teams already using Datadog for monitoring that want to layer SLOs on top of existing metrics, traces, and logs without adding a separate tool.
4. SLOTracker
SLOTracker is an open source tool designed specifically for tracking SLOs and error budgets. It provides a simple interface for defining SLOs, calculating burn rates, and visualizing error budget consumption over time.
Key Features:
- Time slice and occurrence-based SLO calculation
- Error budget tracking with historical trend visualization
- Burn rate alerts with configurable thresholds
- Lightweight deployment with minimal infrastructure overhead
- Open source with active community contributions
Pricing:
Fully free and open source. Infrastructure costs depend on your deployment environment but are typically minimal for small to mid-sized teams.
Pros:
- Zero licensing cost makes it accessible to any team
- Simple setup focused only on SLO tracking without observability bloat
- Community-driven with transparent development process
- Can integrate with Prometheus, Grafana, and other open source tools
Cons:
- Lacks deep integration with commercial APM platforms
- No managed service option means full DIY operations burden
- Limited advanced features like composite SLOs or policy-based governance
- Smaller community compared to commercial alternatives
Best for: Budget-conscious teams that want a focused SLO tracking tool and are comfortable managing open source infrastructure.
5. New Relic

New Relic includes SLO monitoring as part of its unified observability platform. It centralizes telemetry data from applications, infrastructure, and logs, then layers SLO tracking on top with real-time alerts and error budget visualization.
Key Features:
- Availability and latency SLOs with custom metric support
- Error budget tracking with proactive burn rate alerts
- SLO dashboards color-coded by health status
- Integration with major cloud providers and 780+ quickstarts
- Historical SLO analysis to understand past reliability trends
Pricing:
New Relic charges $0.40/GB beyond the first 100GB free per month, plus user seats starting at $49/user/month for full platform access. For a team of 10 users ingesting 5TB/month, expect $2,000 to $3,000/month. Pricing details at New Relic’s pricing page.
Pros:
- Unified platform eliminates need for multiple tools
- Strong integration ecosystem with pre-built quickstarts
- Real-time SLO tracking with immediate alerting
- 100GB free tier allows small teams to start without cost
Cons:
- Per-seat pricing compounds as teams grow
- Proprietary NRQL query language creates lock-in
- Cloud-only architecture rules it out for on-prem requirements
- SLO features require full platform adoption to realize value
Best for: Teams that want SLO tracking embedded in a broader managed observability platform and are comfortable with New Relic’s pricing model.
6. Google Cloud Operations Suite
Google Cloud Operations (formerly Stackdriver) provides native SLO monitoring for Google Cloud services with automatic setup for GCP resources and manual configuration for custom services.
Key Features:
- Latency and availability SLOs with request-based calculations
- Native budget tracking for GCP services like Cloud Run, GKE, and App Engine
- High-resolution metrics with sub-minute granularity
- Integration with Cloud Monitoring and Cloud Logging
- Automated SLO creation for supported Google Cloud services
Pricing:
Pay-as-you-go GCP pricing. Cloud Monitoring charges $0.2580 per MiB for metrics beyond the first 150 MiB/month free. For a production workload ingesting 100GB/month of metrics, expect $25 to $50/month. Pricing details at Google Cloud Monitoring pricing.
Pros:
- Native integration with Google Cloud services requires minimal setup
- Automatic SLO creation for supported GCP resources
- High-resolution metrics provide detailed reliability insights
- Pay-as-you-go model scales cost with actual usage
Cons:
- Limited usefulness outside Google Cloud ecosystem
- Manual configuration required for non-GCP services
- Weaker third-party integration compared to platform-agnostic tools
- SLO features are GCP-centric and not portable to other clouds
Best for: Teams running primarily on Google Cloud Platform that want native SLO monitoring without adding external tools.
7. Splunk Observability Cloud
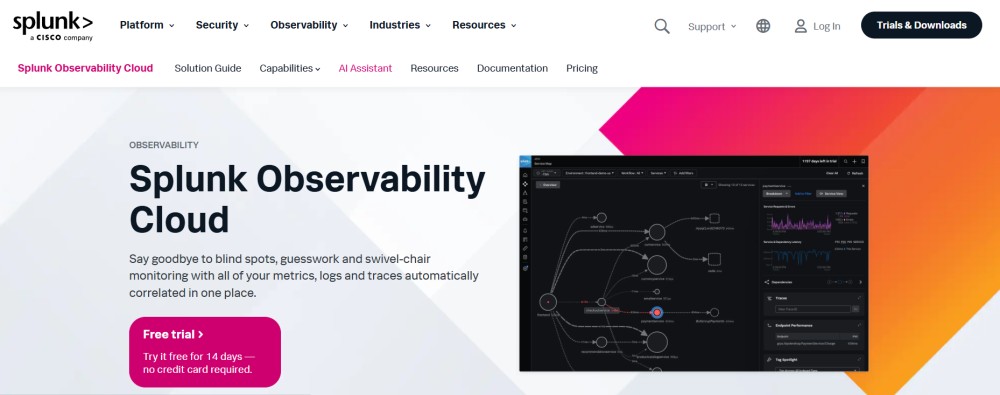
Splunk Observability Cloud offers real-time SLO monitoring with streaming analytics designed for high-scale environments. It supports both standard and custom metrics with predictive alerting based on historical burn rate patterns.
Key Features:
- Real-time streaming for immediate SLO visibility
- Standard and custom metric SLOs
- Predictive alerts that forecast error budget exhaustion
- OpenTelemetry and Prometheus integration via Smart Agent
- SLI charts with detailed analytics and historical comparison
Pricing:
Custom pricing only. Splunk does not publish standard rate cards for Observability Cloud. Infrastructure monitoring typically starts around $15/host/month, with additional charges for APM, logs, and premium features. Enterprise contracts vary widely based on scale and feature set.
Pros:
- Real-time streaming provides immediate SLO insights
- Predictive alerting helps teams act before error budgets are exhausted
- Strong integration with OpenTelemetry and Prometheus ecosystems
- Enterprise-grade reliability for high-scale production environments
Cons:
- No transparent pricing makes budget planning difficult
- Enterprise focus and cost structure rule it out for smaller teams
- Complexity requires significant operational expertise
- Vendor lock-in with proprietary data formats
Best for: Large enterprises with high-scale, mission-critical systems that need real-time SLO tracking and predictive alerting.
8. Grafana Cloud SLO
Grafana Cloud includes SLO monitoring as part of its managed observability platform. It uses Prometheus-based time series data to calculate SLOs and integrates directly with Grafana dashboards for visualization.
Key Features:
- Prometheus-based SLO calculations using PromQL queries
- Time series SLO tracking with historical trend analysis
- Native integration with Grafana dashboards and alerts
- Support for custom SLI definitions using any Prometheus metric
- Free tier for small teams with reasonable usage limits
Pricing:
Free tier includes 10,000 metrics, 50GB logs, and 50GB traces per month. Pro plan starts at $8/user/month with usage-based pricing for data beyond free tier limits. For a team of 5 ingesting 100GB/month across all signals, expect $50 to $150/month. Pricing details at Grafana Cloud pricing.
Pros:
- Free tier allows small teams to start without cost
- Native Grafana integration means no new tools to learn
- PromQL-based SLO definitions are portable and vendor-neutral
- Strong open source community and extensive documentation
Cons:
- SLO features are less mature than specialized platforms
- Requires Prometheus knowledge to define effective SLIs
- Limited advanced features like composite SLOs or policy governance
- Managed service is SaaS-only with no on-prem option
Best for: Teams already using Grafana for visualization that want to add SLO tracking without introducing a separate platform.
9. Lightstep
Lightstep (now part of ServiceNow Cloud Observability) focuses on high-cardinality distributed tracing with SLO monitoring built on top of span-based analysis. It excels at tracking reliability across complex microservices architectures.
Key Features:
- Service-level SLOs based on distributed trace data
- Span-based SLI calculations that measure request success rates
- High-cardinality analysis to identify reliability issues in specific code paths
- Change intelligence that correlates SLO degradation with deployments
- Real-time error budget tracking with root cause links to traces
Pricing:
Custom enterprise pricing only. Lightstep does not publish rate cards. Pricing depends on trace volume, data retention, and feature scope.
Pros:
- High-cardinality tracing provides deep reliability insights
- Change intelligence connects SLO violations to specific deployments
- Span-based SLOs measure reliability at the request level
- Strong fit for complex distributed systems
Cons:
- No transparent pricing makes cost evaluation difficult
- Enterprise-only focus with high entry cost
- Requires adoption of Lightstep’s tracing instrumentation
- Limited integration with non-trace data sources
Best for: Large engineering teams running complex microservices that need deep trace-based SLO analysis and can justify enterprise pricing.
10. Dynatrace
Dynatrace uses AI-driven automation to manage SLOs across applications, infrastructure, and user actions. It automatically baselines normal behavior and alerts when SLOs deviate from expected patterns.
Key Features:
- Service-level, synthetic, and user action SLOs
- AI-driven anomaly detection that adapts to workload changes
- Automatic baselining of normal reliability patterns
- Error budget tracking with predictive burn rate alerts
- Integration with Dynatrace’s full-stack monitoring platform
Pricing:
Host-based pricing starting around $69/host/month for full-stack monitoring. For a 50-host environment with APM, infrastructure, and SLO features, expect $3,500 to $5,000/month. Pricing details at Dynatrace pricing.
Pros:
- AI-driven automation reduces manual SLO configuration effort
- Automatic baselining adapts to changing workload patterns
- Unified platform covers SLOs, APM, infrastructure, and user monitoring
- Strong enterprise support and professional services
Cons:
- High cost rules it out for budget-conscious teams
- Complexity requires significant training and operational expertise
- SaaS-first architecture with limited on-prem options
- Vendor lock-in with proprietary data formats and query languages
Best for: Large enterprises that need AI-automated SLO management and can justify premium pricing for reduced operational overhead.
How to Choose the Right SLO Monitoring Tool
Choosing an SLO monitoring tool depends on your existing monitoring stack, team size, budget, and whether you need self-hosted deployment. Here is a decision framework matched to common use cases.
If you are already using a specific monitoring platform: Datadog, New Relic, and Dynatrace offer native SLO features that integrate directly with their broader observability platforms. This reduces tool sprawl but locks you into their pricing and data models.
If you need platform-agnostic SLO management: Nobl9 integrates with existing monitoring tools without replacing them. It works well for enterprises with heterogeneous monitoring stacks that need centralized SLO governance.
If you require self-hosted deployment: CubeAPM, Grafana Cloud (self-hosted Grafana), and SLOTracker support on-prem or VPC deployment. This matters for regulated industries and teams with strict data residency requirements.
If budget is a primary constraint: SLOTracker (open source) and Grafana Cloud (free tier) provide SLO tracking without licensing costs. CubeAPM offers predictable flat-rate pricing at $0.15/GB with no user seat fees.
If you need high-cardinality distributed tracing: Lightstep excels at span-based SLO calculations that measure reliability at the request level across complex microservices.
If you need real-time streaming and predictive alerting: Splunk Observability Cloud provides immediate SLO visibility with alerts that forecast error budget exhaustion before it happens.
Conclusion
SLO monitoring tools turn raw telemetry into actionable reliability targets that balance feature velocity against system stability. The right tool depends on whether you need deep integration with an existing platform, platform-agnostic flexibility, self-hosted deployment, or budget-conscious pricing. Datadog and New Relic work well for teams already invested in their ecosystems. Nobl9 fits enterprises with heterogeneous monitoring stacks. CubeAPM and SLOTracker provide self-hosted options at predictable cost. Lightstep and Splunk excel at high-scale, high-cardinality use cases. Teams should evaluate based on integration depth, deployment model, pricing transparency, and whether the tool provides error budget tracking with root cause correlation.
Disclaimer: The information in this article reflects the latest details available at the time of publication and may change as technologies and products evolve. Features, pricing, and plan limits can change over time. Always verify the latest information directly with the vendor before making purchasing or deployment decisions.
Frequently Asked Questions
What is the difference between an SLO and an SLA?
An SLO (Service Level Objective) is an internal reliability target that engineering teams set for themselves, like 99.9% uptime. An SLA (Service Level Agreement) is a contractual commitment to customers that includes penalties if targets are not met.
How do SLO monitoring tools calculate error budgets?
Error budgets are calculated as the amount of unreliability allowed by your SLO. For a 99.9% uptime SLO over 30 days, you have 43.2 minutes of downtime as your error budget. Tools track how much of that budget you consume in real time.
Can I use SLO monitoring tools with OpenTelemetry?
Yes, CubeAPM, Grafana Cloud, Splunk Observability Cloud, and SLOTracker support OpenTelemetry natively. Datadog and New Relic have partial OpenTelemetry support but prefer their proprietary agents.
What is burn rate in SLO monitoring?
Burn rate measures how quickly you are consuming your error budget. A 1x burn rate means you are on track to exactly hit your SLO. A 10x burn rate means you are consuming error budget 10 times faster than planned, signaling a serious reliability issue.
Do I need a separate SLO tool if I already use APM?
Not always. If your APM platform includes SLO features like Datadog, New Relic, or Dynatrace, you may not need a separate tool. However, if you need platform-agnostic SLO management or self-hosted deployment, a dedicated tool like Nobl9 or CubeAPM may be necessary.
How much does SLO monitoring cost at scale?
Costs vary widely. Self-hosted tools like CubeAPM charge $0.15/GB with no user seats. SaaS platforms like Datadog and New Relic use host-based or data-based pricing that can reach $4,000 to $5,000/month for mid-sized teams. Enterprise tools like Nobl9 and Dynatrace use custom pricing.
What SLO types should I track first?
Start with availability SLOs for critical services, then add latency SLOs for user-facing endpoints. Once those are stable, consider error rate SLOs for background jobs and data pipelines.