










SAP HANA sits at the core of mission-critical business processes for thousands of enterprises. A single undetected memory leak, a saturated disk, or a replication lag can cascade into hours of downtime and revenue loss before anyone notices. According to the CNCF Annual Survey 2024, 68% of organizations report that database performance issues are among the top three causes of application outages in production environments.
This guide covers the key metrics to monitor in SAP HANA, the tools available to track them, and a step-by-step setup process to get monitoring running in production. By the end, you will know which signals matter most, how to configure collection, and how to prevent the most common failure modes before they impact end users.
Prerequisites
Before setting up SAP HANA monitoring, ensure you have the following:
- SAP HANA database running on a supported version (HANA 2.0 SPS 03 or later recommended)
- Administrative access to the SAP HANA database with MONITORING role permissions
- SSH or terminal access to the host machine where HANA is installed
- Network connectivity from your monitoring tool to the SAP HANA instance (default port 30015 for single-tenant or instance-specific port)
- For cloud deployments: IAM roles configured to allow metric write access if using managed monitoring services
- Python 3.6+ or a compatible runtime if using agent-based monitoring tools
Step 1: Understand the Key SAP HANA Metrics to Monitor
SAP HANA exposes hundreds of metrics across system views and monitoring tables. Tracking everything creates noise. The metrics below are the ones that consistently predict outages in production environments.
Memory utilization and allocation
HANA is an in-memory database. When available memory drops below safe thresholds, the database starts evicting data to disk, which destroys query performance. Monitor:
- Global allocation limit: the maximum memory HANA can use
- Used memory: current consumption across all services
- Column store memory: memory used by column tables (HANA’s primary storage type)
- Row store memory: memory used by temporary tables and intermediate query results
Memory saturation often appears 20 to 30 minutes before HANA starts rejecting queries or triggering OOM events. Setting alerts at 85% utilization gives you time to act.
Disk usage and I/O rates
HANA writes to disk for persistence (data and log volumes) and savepoints. Monitor:
- Data volume usage: percentage of disk space consumed by HANA data files
- Log volume usage: space consumed by transaction logs
- Disk I/O wait time: how long HANA waits for disk reads/writes to complete
A saturated log volume stops new transactions from committing. This has caused production outages where the database became read-only until log backups were cleared.
CPU utilization across services
HANA runs multiple services: indexserver, nameserver, xsengine. Monitor CPU per service, not just total system CPU. A single service pegged at 100% can bottleneck the entire database even if overall CPU looks healthy.
Query response time and long-running queries
Slow queries degrade application performance long before error rates spike. Track:
- Average query execution time
- 95th and 99th percentile query latency
- Queries running longer than 60 seconds (or your SLA threshold)
Long-running analytical queries can starve transactional workloads of resources. Identifying them early lets you kill or reschedule before impact spreads.
Replication status and lag (for HANA System Replication)
If you run HANA in a high availability setup with System Replication (HSR), monitor:
- Replication mode (sync, syncmem, async)
- Replication lag in seconds
- Replication channel status (active, error, disconnected)
Replication lag above 10 seconds in sync mode indicates network or resource saturation. If the secondary falls too far behind, failover becomes unsafe.
Blocked transactions and lock waits
Lock contention happens when multiple transactions compete for the same table or row. Monitor:
- Number of blocked transactions
- Lock wait time in milliseconds
- Top tables experiencing lock contention
A spike in lock waits often correlates with schema changes, batch jobs, or poorly optimized queries holding locks too long.
Backup status and last successful backup timestamp
HANA backups are your last line of defense. If backups fail silently, you discover it during a disaster. Track:
- Last successful data backup timestamp
- Last successful log backup timestamp
- Backup failure events
Any gap longer than your RPO (recovery point objective) threshold should fire an alert.
Step 2: Choose a Monitoring Tool
SAP HANA monitoring tools fall into three categories: native SAP tools, commercial APM platforms, and open source or self-hosted solutions. Each has trade-offs on cost, deployment complexity, and feature depth.
SAP Solution Manager
SAP Solution Manager is SAP’s official application management and monitoring platform. It includes HANA-specific monitoring capabilities and integrates with SAP’s ecosystem.
Pros: Native integration with SAP systems, built-in HANA health checks, supports end-to-end SAP landscape monitoring.
Cons: Heavy infrastructure requirement, steep learning curve, expensive licensing. Most teams report slow adoption due to complexity.
Best for: Large SAP-centric enterprises already invested in the SAP ecosystem.
Google Cloud Agent for SAP
The Google Cloud Agent for SAP collects HANA metrics and sends them to Cloud Monitoring. It is designed for SAP workloads running on Google Cloud or Bare Metal Solution.
Pros: Fully managed if on Google Cloud, native integration with Cloud Monitoring, supports both host and database metrics.
Cons: Google Cloud only, requires IAM setup and Secret Manager for authentication, limited customization for on-prem or multi-cloud deployments.
Best for: Teams running SAP HANA on Google Cloud Platform.
Datadog
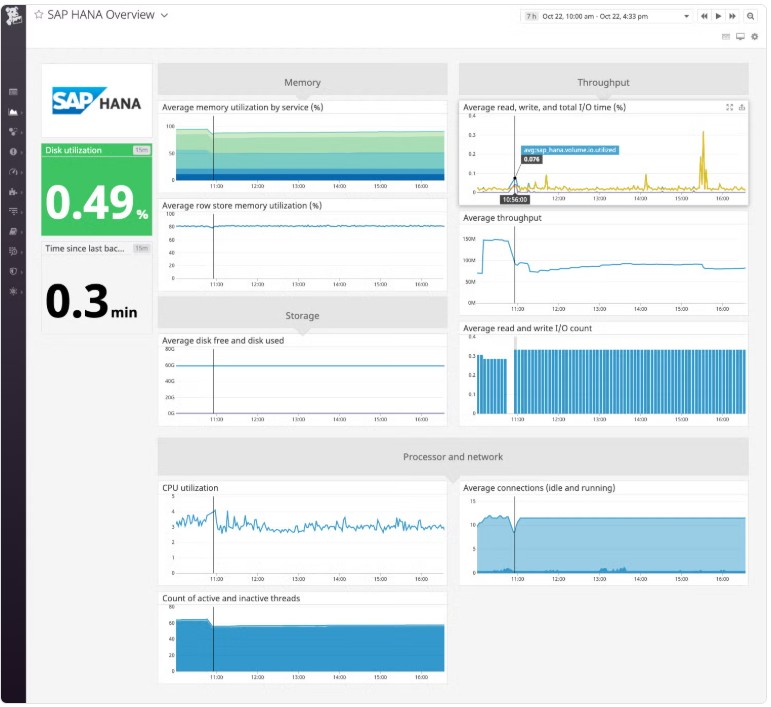
Datadog offers a pre-built SAP HANA integration that collects metrics via SQL queries and the HANA monitoring API.
Pros: Full-stack observability (APM, logs, infrastructure), 700+ integrations, strong alerting and dashboards.
Cons: Per-host pricing starts at $15 per host per month for infrastructure monitoring alone. A 50-host HANA cluster costs $750 per month before logs, APM, or custom metrics. Public pricing does not include database-specific costs; verify current rates at the Datadog pricing page.
Best for: Teams with budget for SaaS monitoring and multi-cloud environments.
Dynatrace
Dynatrace provides HANA monitoring with AI-assisted root cause analysis and automated anomaly detection.
Pros: Strong AI-based alerting, deep transaction tracing, automatic dependency mapping.
Cons: Enterprise pricing starts around $0.08 per host hour, which translates to roughly $60 per host per month. A medium HANA cluster can exceed $3,000 per month. Pricing varies by product module — verify current rates at the Dynatrace pricing page.
Best for: Large enterprises needing AI-driven insights and willing to pay premium pricing.
Prometheus + Grafana
Prometheus is an open source time-series database. Grafana is an open source visualization platform. Together they form a popular self-hosted monitoring stack. SAP HANA metrics can be exported using custom exporters or HANA’s SQL interface.
Pros: Free and open source, full control over deployment and data, strong community support.
Cons: Requires manual setup of exporters, dashboard creation, and alerting rules. High-cardinality queries (common in HANA monitoring) can overwhelm Prometheus at scale. Maintenance burden falls on your team.
Best for: Teams with ops capacity to run and maintain the stack, or those with data residency requirements.
CubeAPM
CubeAPM is a self-hosted, OpenTelemetry-native observability platform that runs inside your cloud or data center. It monitors SAP HANA via Prometheus-compatible exporters, native database connectors, or OpenTelemetry agents.
Pros: Runs on your infrastructure with no telemetry data leaving your environment. Pricing is $0.20 per GB of ingested data with no per-host or per-user fees. Unlimited retention, full MELT stack (metrics, events, logs, traces), and managed by CubeAPM so no DIY ops burden.
Cons: Requires infrastructure provisioning. Not SaaS; if you need cloud-only deployment, this is not the fit.
Best for: Teams that need on-prem or VPC-hosted monitoring with predictable pricing, data sovereignty, and full-stack observability beyond just HANA.
Step 3: Configure SAP HANA User Permissions
All monitoring tools need database credentials to query HANA’s system views and monitoring tables. The account must have the MONITORING role.
Create a dedicated monitoring user
Log in to HANA Studio or execute SQL via hdbsql:
CREATE USER monitoring_user PASSWORD "SecurePassword123";
GRANT MONITORING TO monitoring_user;Never use the SYSTEM user for monitoring. A dedicated account with minimal privileges limits blast radius if credentials are compromised.
Store credentials securely
If using Google Cloud Agent for SAP, store the password in Secret Manager. For other tools, use environment variables, encrypted vaults, or the tool’s built-in secret management. Never hardcode passwords in configuration files.
Test the connection
Verify the monitoring user can connect and query system views:
hdbsql -u monitoring_user -p SecurePassword123 -n localhost:30015 \
-c "SELECT * FROM M_DATABASE LIMIT 1;"If the query returns database metadata, the user is configured correctly.
Step 4: Install and Configure the Monitoring Agent
Most tools use an agent that runs on the HANA host or a nearby server and queries the database at regular intervals. This step covers the Google Cloud Agent for SAP as a reference example. Other tools follow similar patterns.
Install the agent
SSH into the HANA host and download the agent:
curl -O https://dl.google.com/cloudagents/sap/google-cloud-sap-agent_latest_linux_amd64.tar.gz
tar -xzf google-cloud-sap-agent_latest_linux_amd64.tar.gz
sudo mv google-cloud-sap-agent /usr/local/bin/For other tools, follow vendor-specific installation steps. Prometheus exporters for HANA are typically installed via package managers or Docker.
Configure the agent
Open the configuration file (usually /etc/google-cloud-sap-agent/configuration.json for Google Cloud Agent or equivalent for other tools):
{
  "hana_monitoring_configuration": {
    "enabled": true,
    "sample_interval_sec": 60,
    "query_timeout_sec": 30,
    "hana_instances": [
      {
        "name": "production_hana",
        "sid": "PRD",
        "host": "localhost",
        "port": "30015",
        "user": "monitoring_user",
        "secret_name": "hana-monitoring-password"
      }
    ]
  }
}Key parameters:
sample_interval_sec: How often the agent queries HANA. 60 seconds is standard. Lower intervals increase metric granularity but add database load.query_timeout_sec: Maximum time the agent waits for a query to return. 30 seconds prevents hung queries from stalling the agent.secret_name: Reference to the password stored in Secret Manager or equivalent.
Start the agent
Enable and start the agent service:
sudo systemctl enable google-cloud-sap-agent
sudo systemctl start google-cloud-sap-agentCheck the agent logs to confirm it is collecting metrics:
sudo journalctl -u google-cloud-sap-agent -fYou should see log entries showing successful queries and metric writes.
Step 5: Define Custom Queries for Business-Specific Metrics
Default monitoring captures system-level metrics. Custom queries let you track application-specific signals like row counts in critical tables, batch job status, or custom performance KPIs.
Example: Monitor row count in a critical table
Add a custom query to the agent configuration:
{
  "queries": [
    {
      "name": "critical_table_row_count",
      "enabled": true,
      "sql": "SELECT COUNT(*) AS row_count FROM SCHEMA_NAME.TABLE_NAME;",
      "columns": [
        {
          "name": "row_count",
          "metric_type": "METRIC_GAUGE",
          "value_type": "VALUE_INT64"
        }
      ]
    }
  ]
}This query runs every sample interval and exports row_count as a metric. You can alert on unexpected drops or spikes.
Example: Track long-running queries
{
  "name": "long_running_queries",
  "enabled": true,
  "sql": "SELECT COUNT(*) AS long_query_count FROM M_EXPENSIVE_STATEMENTS WHERE DURATION_MICROSEC > 60000000;",
  "columns": [
    {
      "name": "long_query_count",
      "metric_type": "METRIC_GAUGE",
      "value_type": "VALUE_INT64"
    }
  ]
}This counts queries running longer than 60 seconds. Alert when long_query_count exceeds your threshold.
Restart the agent after adding custom queries:
sudo systemctl restart google-cloud-sap-agentStep 6: Set Up Alerts for Critical Thresholds
Metrics without alerts are dashboards without action. Define thresholds for the metrics that predict failure.
Memory utilization alert
Alert when used memory exceeds 85% of the global allocation limit:
alert: HANAMemoryHigh
expr: hana_memory_used / hana_memory_allocation_limit > 0.85
for: 5m
annotations:
summary: "HANA memory usage above 85% on {{ $labels.instance }}"Disk usage alert
Alert when data or log volume usage exceeds 90%:
alert: HANADiskSpaceHigh
expr: hana_disk_usage_percent > 90
for: 5m
annotations:
summary: "HANA disk usage above 90% on {{ $labels.volume }}"Replication lag alert
For HANA System Replication, alert if lag exceeds 10 seconds:
alert: HANAReplicationLagHigh
expr: hana_replication_lag_seconds > 10
for: 2m
annotations:
summary: "HANA replication lag above 10 seconds on {{ $labels.instance }}"Long-running query alert
Alert when queries run longer than your SLA:
alert: HANALongRunningQueries
expr: hana_long_query_count > 5
for: 5m
annotations:
summary: "More than 5 queries running longer than 60 seconds"Configure alert destinations (email, Slack, PagerDuty) in your monitoring tool’s alert manager.
Step 7: Build Dashboards for Real-Time Visibility
Dashboards give your team a shared view of HANA health. Focus on the metrics that drive decisions during incidents.
Memory and CPU dashboard
Visualize memory allocation, used memory, and per-service CPU over time. Include a panel showing the percentage of global allocation limit consumed.
Disk and I/O dashboard
Track data volume usage, log volume usage, and disk I/O wait time. Add a heatmap showing I/O spikes correlated with backup windows or batch jobs.
Replication health dashboard
For systems using HANA System Replication, show replication status, lag, and failover readiness. Highlight replication mode and last sync timestamp.
Query performance dashboard
Display average query execution time, 95th percentile latency, and a list of the top 10 slowest queries currently running.
Most monitoring tools include pre-built HANA dashboards. Customize them to match your environment and SLAs.
Troubleshooting Common Issues
Agent fails to connect to HANA
Symptom: Agent logs show connection timeout or authentication errors.
Solution: Verify the monitoring user has the MONITORING role. Check that the host and port are correct. Test connectivity with hdbsql from the agent host. If using Secret Manager, confirm the secret name matches the configuration.
Metrics stop flowing after HANA restart
Symptom: Dashboards show no data after a database restart.
Solution: HANA changes instance ports after a restart if the instance number changes. Update the agent configuration with the new port and restart the agent.
High CPU usage from monitoring queries
Symptom: HANA CPU spikes correlate with agent query intervals.
Solution: Increase sample_interval_sec from 60 to 120 seconds. Reduce the number of custom queries or optimize query performance. Avoid queries with full table scans on large tables.
Memory metrics show inconsistent values
Symptom: Memory usage jumps or drops without corresponding workload changes.
Solution: HANA’s memory allocation can fluctuate due to garbage collection and internal reallocation. Use a moving average or alert only after sustained threshold breaches (e.g., 5 minutes above 85%).
Replication lag spikes intermittently
Symptom: Replication lag jumps to 30+ seconds then drops back to normal.
Solution: Check network bandwidth between primary and secondary. Verify the secondary system is not resource-starved (CPU, memory, or disk). Review HANA replication logs for warnings.
Conclusion
SAP HANA monitoring is not optional. A single missed memory threshold, disk saturation, or replication lag can cascade into hours of downtime before your team notices. The metrics covered in this guide memory, CPU, disk, replication status, and query performance predict most production failures when tracked correctly.
Choose a monitoring tool that fits your deployment model and budget. If you are on Google Cloud, the native agent integrates cleanly. If you need cross-platform or on-prem monitoring, CubeAPM, Prometheus, or Datadog offer stronger flexibility. For enterprises already invested in SAP’s ecosystem, Solution Manager provides deep integration at the cost of complexity.
The setup process is the same regardless of tool: configure a monitoring user, install an agent, define custom queries for business-specific metrics, and set alerts that fire before failures happen. HANA exposes the telemetry you need; the only question is whether you are collecting it before the next incident.
Disclaimer: The information in this article reflects the latest details available at the time of publication and may change as technologies and products evolve. Features, pricing, and plan limits can change over time. Always verify the latest information directly with the vendor before making purchasing or deployment decisions.
Frequently Asked Questions
What are the key performance indicators (KPIs) used in SAP HANA?
The primary KPIs are memory utilization as a percentage of global allocation limit, CPU usage per service, disk I/O wait time, query response time (average and 95th percentile), replication lag in seconds for HSR setups, and backup success status with timestamps.
What monitoring tools are available for SAP HANA?
SAP Solution Manager is the native SAP tool. Google Cloud Agent for SAP works on GCP. Datadog and Dynatrace offer commercial APM with HANA integrations. Prometheus with Grafana provides open source self-hosted monitoring. CubeAPM offers on-prem or VPC-hosted full-stack observability with predictable pricing.
How can parameters be adjusted for SAP HANA?
HANA parameters are adjusted via the HANA Studio GUI, SQL commands using ALTER SYSTEM, or editing configuration files directly on the host. Changes require restart or reload depending on the parameter. Always test parameter changes in non-production before applying to production.
What are the standard SAP HANA tools?
Standard tools include HANA Studio for administration and SQL queries, hdbsql for command-line database access, HANA Cockpit for web-based monitoring, and SAP Solution Manager for enterprise monitoring across SAP landscapes.
How often should SAP HANA metrics be collected?
60-second intervals are standard for most metrics. Critical metrics like memory and replication lag can be sampled every 30 seconds if your system handles the query load. Avoid intervals below 30 seconds unless you have proven it does not degrade database performance.
What causes high memory usage in SAP HANA?
Common causes include large column tables loaded into memory, inefficient SQL queries creating large intermediate result sets, memory leaks in custom code, or insufficient garbage collection. Review loaded tables and active queries to identify the source.
Can SAP HANA monitoring impact database performance?
Yes. Frequent complex queries from monitoring agents can add CPU and memory load. Keep sample intervals at 60 seconds or higher, avoid full table scans in custom queries, and monitor the monitoring user’s resource consumption to ensure it stays under 5% of total database load.