










Canary deployments reduce release risk by exposing new code to a small subset of production traffic before rolling it out broadly. The strategy only works if you can measure what matters. A 2024 CNCF survey found that 68% of organizations use canary or blue-green deployment strategies, yet many still make promote-or-rollback decisions manually rather than using automated health signals.
This guide walks through how to monitor canary deployments with clear decision criteria, automated rollback triggers, and real configuration examples for Kubernetes environments.
Prerequisites
Before setting up canary deployment monitoring, ensure you have:
- A Kubernetes cluster running with kubectl access
- A service mesh (Istio, Linkerd, or Flagger) or ingress controller with traffic splitting capability
- Prometheus or an OpenTelemetry-compatible metrics backend
- Application instrumented to emit RED metrics (Rate, Errors, Duration)
- Baseline performance data from your stable version collected over at least 7 days
- Access to application logs and distributed traces for debugging failed canaries
Step 1: Define Success Criteria Before the Rollout
The first step happens before you deploy any canary traffic. Establish the specific thresholds that determine whether a canary is healthy. Without predefined criteria, teams default to waiting an arbitrary period and hoping nothing breaks.
Define baseline metrics from your stable version. Collect at least 7 days of production data covering error rate, p50 latency, p95 latency, and p99 latency for every critical endpoint. Use this as your comparison baseline.
Set explicit canary thresholds. A common starting point:
- Error rate must stay below baseline + 0.5%
- p95 latency must not exceed baseline by more than 10%
- p99 latency must not exceed baseline by more than 20%
- No increase in 5xx errors compared to stable version
- CPU and memory usage must remain within 20% of baseline
These thresholds vary by application type. A payments API might tolerate zero error rate increase. A content feed might accept slightly higher latency if it means faster feature iteration.
Document these thresholds in your deployment runbook. Every canary rollout should reference the same criteria so that decisions are consistent across releases and teams.
# example-canary-thresholds.yaml
apiVersion: v1
kind: ConfigMap
metadata:
  name: canary-thresholds
  namespace: production
data:
  error_rate_max_delta: "0.5"
  p95_latency_max_delta_percent: "10"
  p99_latency_max_delta_percent: "20"
  cpu_max_delta_percent: "20"
memory_max_delta_percent: "20"Step 2: Instrument the Canary with Distinct Labels
Every metric, log line, and trace from the canary version must be tagged so you can compare it directly to the stable version. Without version labels, you cannot isolate canary behavior from baseline behavior.
Add version labels to your Kubernetes deployment. Label both the deployment and the pod template so that Prometheus and your service mesh can scrape metrics per version.
apiVersion: apps/v1
kind: Deployment
metadata:
  name: payment-api-canary
  namespace: production
  labels:
    app: payment-api
    version: canary
spec:
  replicas: 2
  selector:
    matchLabels:
      app: payment-api
      version: canary
  template:
    metadata:
      labels:
        app: payment-api
        version: canary
    spec:
      containers:
      - name: payment-api
        image: payment-api:v2.1.0
        env:
        - name: VERSION_LABEL
value: "canary"Emit version labels in application metrics. If you are using OpenTelemetry or Prometheus client libraries, attach the version as a label on every metric exported.
# Python example using OpenTelemetry
from opentelemetry import metrics
import os
meter = metrics.get_meter(__name__)
request_counter = meter.create_counter(
    name="http_requests_total",
    description="Total HTTP requests",
)
version = os.getenv("VERSION_LABEL", "stable")
def handle_request():
request_counter.add(1, {"version": version, "endpoint": "/payment"})Tag traces with version metadata. Distributed traces should include the canary version in span attributes so you can filter traces by version during analysis.
Step 3: Route Traffic to the Canary Incrementally
Start with 5% of traffic routed to the canary. This limits blast radius while still generating enough signal to detect regressions. Traffic splitting can be done at the service mesh layer or using an ingress controller with weighted routing.
Using Istio VirtualService for traffic splitting:
apiVersion: networking.istio.io/v1beta1
kind: VirtualService
metadata:
  name: payment-api
  namespace: production
spec:
  hosts:
  - payment-api.production.svc.cluster.local
  http:
  - match:
    - uri:
        prefix: "/payment"
    route:
    - destination:
        host: payment-api.production.svc.cluster.local
        subset: stable
      weight: 95
    - destination:
        host: payment-api.production.svc.cluster.local
        subset: canary
      weight: 5
---
apiVersion: networking.istio.io/v1beta1
kind: DestinationRule
metadata:
  name: payment-api
  namespace: production
spec:
  host: payment-api.production.svc.cluster.local
  subsets:
  - name: stable
    labels:
      version: stable
  - name: canary
    labels:
version: canaryWait at least 10 minutes at each traffic increment. This ensures you collect enough samples to detect latency regressions and error spikes. Incrementing too fast means you promote a broken canary before the metrics surface the problem.
Common traffic progression: 5% → 10% → 25% → 50% → 100%. Each stage should run long enough to collect statistically significant signal. For high-traffic services, 10 minutes per stage is usually sufficient. For lower-traffic services, wait 30 minutes or longer.
Step 4: Monitor Error Rate Comparison in Real Time
Error rate is the most direct signal of canary health. A spike in 5xx errors or client-side 4xx errors that do not occur in the stable version indicates a regression.
Query error rates per version using Prometheus. Compare the canary error rate to the stable version error rate over the same time window.
# Canary error rate
sum(rate(http_requests_total{version="canary", status=~"5.."}[5m]))
/
sum(rate(http_requests_total{version="canary"}[5m]))
# Stable error rate
sum(rate(http_requests_total{version="stable", status=~"5.."}[5m]))
/
sum(rate(http_requests_total{version="stable"}[5m]))Set an alert that fires if canary error rate exceeds stable error rate by your predefined threshold. If your baseline error rate is 0.1% and your threshold is +0.5%, the canary must stay below 0.6% or trigger a rollback.
# Prometheus alert rule
groups:
- name: canary_health
  interval: 30s
  rules:
  - alert: CanaryErrorRateHigh
    expr: |
      (sum(rate(http_requests_total{version="canary", status=~"5.."}[5m]))
      / sum(rate(http_requests_total{version="canary"}[5m])))
      >
      (sum(rate(http_requests_total{version="stable", status=~"5.."}[5m]))
      / sum(rate(http_requests_total{version="stable"}[5m])) + 0.005)
    for: 2m
    labels:
      severity: critical
    annotations:
      summary: "Canary error rate exceeds stable version"
description: "Canary error rate is {{ $value | humanizePercentage }} higher than stable"Step 5: Compare Latency Percentiles Across Versions
Latency regressions often appear in tail percentiles (p95, p99) before they show up in averages. A new version might handle typical requests fine but degrade badly under load or for specific edge cases.
Calculate p95 and p99 latency per version. Use histogram metrics if available. Prometheus histograms allow you to calculate percentiles accurately.
# Canary p95 latency
histogram_quantile(0.95, sum(rate(http_request_duration_seconds_bucket{version="canary"}[5m])) by (le))
# Stable p95 latency
histogram_quantile(0.95, sum(rate(http_request_duration_seconds_bucket{version="stable"}[5m])) by (le))Alert if canary latency exceeds stable latency by more than your threshold. If stable p95 is 200ms and your threshold is 10%, the canary must stay below 220ms.
- alert: CanaryLatencyHigh
  expr: |
    histogram_quantile(0.95, sum(rate(http_request_duration_seconds_bucket{version="canary"}[5m])) by (le))
    >
    histogram_quantile(0.95, sum(rate(http_request_duration_seconds_bucket{version="stable"}[5m])) by (le)) * 1.10
  for: 3m
  labels:
    severity: warning
  annotations:
summary: "Canary p95 latency is 10% higher than stable"Track both p95 and p99. A regression might only appear at p99, affecting a small percentage of users but still violating SLOs for those requests.
Step 6: Monitor Resource Consumption for the Canary Pods
A new version might introduce a memory leak or CPU spike that does not immediately cause errors but will degrade performance over time. Resource metrics surface these issues before they cascade.
Query CPU and memory usage per version. Use container metrics exposed by cAdvisor or Kubernetes metrics server.
# Canary CPU usage
sum(rate(container_cpu_usage_seconds_total{pod=~"payment-api-canary.*"}[5m])) by (pod)
# Canary memory usage
sum(container_memory_working_set_bytes{pod=~"payment-api-canary.*"}) by (pod)Compare canary resource usage to stable resource usage. A 30% increase in memory usage might indicate a memory leak. A 50% increase in CPU might indicate inefficient code paths.
Alert if canary resource usage exceeds stable resource usage by more than your threshold.
- alert: CanaryMemoryUsageHigh
  expr: |
    avg(container_memory_working_set_bytes{pod=~"payment-api-canary.*"})
    >
    avg(container_memory_working_set_bytes{pod=~"payment-api-stable.*"}) * 1.20
  for: 5m
  labels:
    severity: warning
  annotations:
summary: "Canary memory usage is 20% higher than stable"Step 7: Automate Rollback Using Flagger or ArgoCD Rollouts
Manual rollback decisions introduce delay and human error. Automated rollback based on metrics ensures the canary is pulled immediately when thresholds are breached.
Use Flagger to automate canary analysis and rollback. Flagger integrates with Istio, Linkerd, and other service meshes to analyze metrics and control traffic shifting.
apiVersion: flagger.app/v1beta1
kind: Canary
metadata:
  name: payment-api
  namespace: production
spec:
  targetRef:
    apiVersion: apps/v1
    kind: Deployment
    name: payment-api
  service:
    port: 8080
  analysis:
    interval: 1m
    threshold: 5
    maxWeight: 50
    stepWeight: 5
    metrics:
    - name: request-success-rate
      thresholdRange:
        min: 99
      interval: 1m
    - name: request-duration
      thresholdRange:
        max: 500
      interval: 1m
provider: istioFlagger increments traffic automatically (5% → 10% → 15% → 20% → 25% → 50%) and checks metrics at each stage. If any metric breaches the threshold, Flagger halts the rollout and routes all traffic back to stable.
Using ArgoCD Rollouts for progressive delivery:
apiVersion: argoproj.io/v1alpha1
kind: Rollout
metadata:
  name: payment-api
  namespace: production
spec:
  replicas: 10
  strategy:
    canary:
      steps:
      - setWeight: 5
      - pause: {duration: 10m}
      - setWeight: 10
      - pause: {duration: 10m}
      - setWeight: 25
      - pause: {duration: 10m}
      - setWeight: 50
      - pause: {duration: 10m}
      analysis:
        templates:
        - templateName: error-rate
        - templateName: latency-p95
        args:
        - name: service-name
          value: payment-api
---
apiVersion: argoproj.io/v1alpha1
kind: AnalysisTemplate
metadata:
  name: error-rate
  namespace: production
spec:
  metrics:
  - name: error-rate
    interval: 1m
    successCondition: result < 0.01
    provider:
      prometheus:
        address: http://prometheus.monitoring.svc:9090
        query: |
          sum(rate(http_requests_total{service="{{args.service-name}}",version="canary",status=~"5.."}[5m]))
          /
sum(rate(http_requests_total{service="{{args.service-name}}",version="canary"}[5m]))Step 8: Correlate Canary Metrics with Logs and Traces
Metrics tell you when a problem exists. Logs and traces tell you why. When a canary fails health checks, the next step is correlating the failure with specific requests or code paths.
Filter logs by version label. If your logging system supports structured logs, filter on the version field to see only canary logs.
kubectl logs -l app=payment-api,version=canary --tail=100 | grep ERRORQuery traces for the canary version. Use your tracing backend to filter spans by version attribute and look for high-latency spans or error spans.
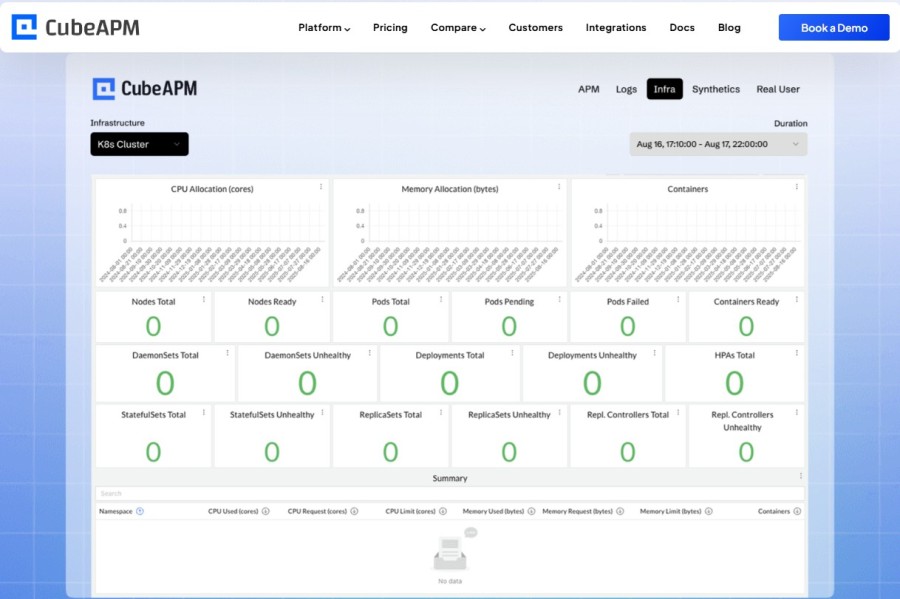
If you are using infrastructure monitoring platforms that support unified logs, metrics, and traces, you can jump directly from a metric spike to the exact trace or log line that caused it. CubeAPM correlates all three signal types automatically, so when a canary error rate alert fires, you see the failing traces and logs in the same view without switching tools.
Example Jaeger query for canary traces:
# Query Jaeger for canary traces with errors
curl "http://jaeger-query:16686/api/traces?service=payment-api&tags=%7B%22version%22%3A%22canary%22%2C%22error%22%3A%22true%22%7D&limit=20"Troubleshooting Common Issues
Canary passes metrics but fails in production after full rollout
This happens when the canary traffic sample is not representative of full production load. Ensure your canary receives traffic from all user segments and geographies. Use header-based routing or cookie-based routing to send a diverse traffic mix to the canary.
Metrics show no difference between canary and stable
Check that version labels are correctly applied to all metrics, logs, and traces. Verify that Prometheus is scraping both canary and stable pods. Confirm that traffic is actually reaching the canary by checking request counts per version.
Automated rollback triggers too aggressively
Tighten your threshold ranges or increase the alert for duration. A threshold that fires after 2 minutes of breach might be too aggressive for a noisy metric. Extend it to 5 minutes to filter transient spikes.
Canary rollback happens, but root cause is unclear
Enable debug logging on the canary version and ensure distributed tracing is capturing 100% of canary requests during the rollout. Sampling traces at 1% might miss the exact request that triggered the rollback.
Traffic split does not match expected percentage
Verify your service mesh or ingress controller configuration. Check that the DestinationRule subsets match the labels on your pods. Use istioctl or linkerd diagnostics to confirm traffic weights.
Conclusion
Canary deployment monitoring is not about watching dashboards manually. It is about defining explicit health criteria, instrumenting your application to emit version-labeled metrics, and automating the promote or rollback decision based on real production signals. Error rate, latency percentiles, and resource consumption give you the three core signals to evaluate canary health. Automated tools like Flagger and ArgoCD Rollouts remove the manual decision step and pull the canary immediately when thresholds are breached.
The result is faster, safer releases with lower risk of production incidents affecting all users.
Disclaimer: The information in this article reflects the latest details available at the time of publication and may change as technologies and products evolve. Features, pricing, and plan limits can change over time. Always verify the latest information directly with the vendor before making purchasing or deployment decisions.
Frequently Asked Questions
What is the difference between canary deployment and blue-green deployment?
Canary deployment routes a small percentage of traffic to the new version while most traffic stays on the stable version. Blue-green deployment switches 100% of traffic from the old version to the new version at once with both environments running in parallel.
How long should a canary run before promoting to 100%?
The canary should run long enough to collect statistically significant metrics. For high-traffic services, 10 minutes per traffic increment is usually sufficient. For low-traffic services, wait 30 minutes or longer to ensure you capture enough samples.
What metrics should trigger an automatic rollback?
Error rate exceeding baseline by a predefined threshold, p95 or p99 latency exceeding baseline by more than 10 to 20 percent, and resource usage spiking above normal levels are the three most common rollback triggers.
Can I run a canary deployment without a service mesh?
Yes, you can use an ingress controller with weighted routing or a simple traffic splitting proxy. Service meshes make it easier to automate traffic shifting and metric collection but are not required.
How do I test a canary deployment locally before production?
Set up a staging environment that mirrors production traffic patterns and use the same traffic splitting and monitoring configuration. Test the canary rollout process end to end including automated rollback before deploying to production.
What happens if the canary passes all metrics but causes issues after full rollout?
This usually means the canary traffic sample was not representative of full production load. Ensure your canary receives diverse traffic including all user segments, geographies, and request types to catch edge cases early.
How does CubeAPM help with canary deployment monitoring?
CubeAPM correlates metrics, logs, and traces automatically so when a canary alert fires you see the failing traces and logs in the same view without switching tools. It supports OpenTelemetry natively and runs on-prem so all telemetry data stays inside your infrastructure during canary rollouts.