










SAP systems power mission-critical operations at thousands of enterprises, from manufacturing order workflows to financial close processes to customer order fulfillment. A single hour of SAP downtime can cost a mid-sized manufacturer $500,000 in lost production, according to ITIC’s 2025 Global Server Hardware Reliability Survey.
Without proper monitoring, performance issues in SAP HANA memory consumption, long-running ABAP transactions, or CPU saturation on application servers can degrade business processes for hours before operations teams even notice. With the right monitoring strategy, the same issues trigger alerts with full context, pinpoint root causes in minutes, and enable teams to resolve problems before end users are affected.
This guide covers what SAP monitoring is, how it works across HANA databases, SAP application servers, and supporting infrastructure, which metrics matter most, and how to choose monitoring tools that fit your SAP landscape and operational requirements.
What Is SAP Monitoring?
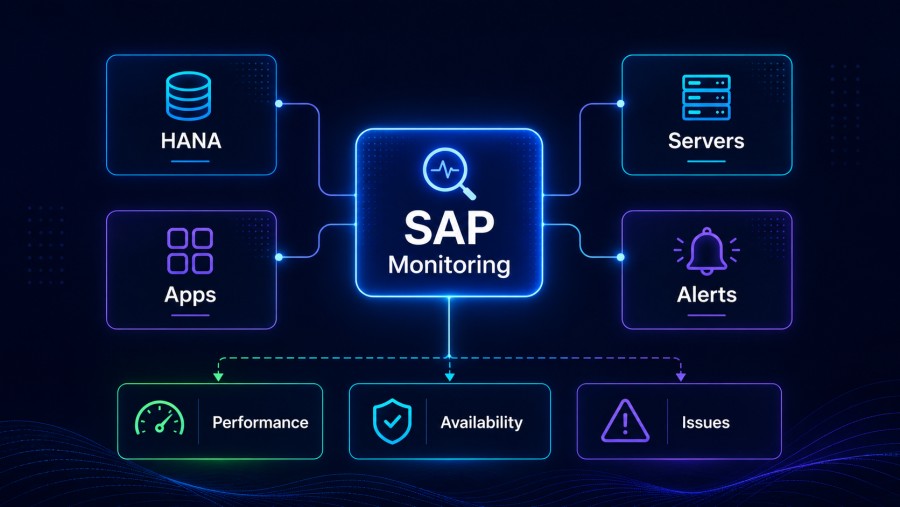
SAP monitoring is the practice of continuously tracking the health, performance, and availability of SAP systems — including SAP HANA databases, SAP application servers (NetWeaver), SAP S/4HANA instances, and the underlying infrastructure — to detect issues, maintain SLAs, and ensure business continuity.
SAP environments are uniquely complex. A typical SAP landscape includes multiple tiers: the HANA database layer handling in-memory data processing, the application layer running ABAP or Java workloads, and the infrastructure layer consisting of virtual machines, storage systems, and network components. Each layer generates distinct telemetry signals that must be correlated to understand end-to-end system health.
Effective SAP monitoring answers three critical questions in real time: Is the system available and responding to user requests? Are business transactions completing within acceptable timeframes? What is causing performance degradation when it occurs?
Traditional infrastructure monitoring tools like infrastructure monitoring platforms provide server-level metrics, but lack SAP-specific context. Purpose-built SAP monitoring solutions understand SAP architecture and surface metrics that matter to SAP Basis administrators: HANA memory pools, transaction response times, dialog work process availability, and background job queue depths.
How SAP Monitoring Works
SAP monitoring operates by collecting telemetry data from three distinct layers in the SAP technology stack: the HANA database, the application servers, and the underlying infrastructure, then correlating this data to provide unified visibility into system health and performance.
At the database layer, monitoring agents connect to SAP HANA via SQL queries or the HANA Python SDK to extract metrics on memory consumption, column store usage, disk I/O patterns, active connections, and expensive SQL statements. HANA exposes these metrics through system views like M_SERVICE_MEMORY and M_EXPENSIVE_STATEMENTS. Monitoring tools query these views at regular intervals (typically every 30 to 60 seconds) to track resource utilization and identify bottlenecks.
The application layer monitoring focuses on SAP NetWeaver work processes, transaction response times, and user session activity. Tools integrate with SAP’s built-in monitoring interfaces, the CCMS (Computing Center Management System) and ST03 transaction statistics, to extract metrics on dialog response times, RFC call latencies, update task queues, and background job execution. Some advanced monitoring platforms inject lightweight agents into the ABAP or Java stack to capture distributed traces across RFC calls and database queries.
Infrastructure monitoring tracks the compute, storage, and network resources supporting SAP. This includes CPU utilization on application servers, memory consumption patterns, disk IOPS rates on storage volumes hosting HANA data files, and network throughput between application and database tiers. These metrics come from standard infrastructure monitoring agents running on the operating system or hypervisor layer.
The value of SAP monitoring emerges when these three data streams are correlated. A spike in HANA CPU usage means nothing in isolation. But when correlated with a specific ABAP transaction code and a surge in user sessions, it surfaces the root cause: a poorly optimized custom report running during peak business hours.
Modern SAP monitoring tools automate this correlation using topology mapping. They understand SAP system architecture and automatically link application server instances to their corresponding HANA database, map transaction codes to the work processes executing them, and connect performance metrics to specific business processes.
SAP HANA Monitoring
SAP HANA monitoring focuses on the in-memory database layer that powers modern SAP applications. HANA stores active data sets entirely in RAM to enable real-time analytics and transaction processing. This architecture makes memory management the single most critical monitoring concern – running out of memory in HANA can halt all business transactions in seconds.
HANA Memory Metrics
The core HANA memory metrics to monitor include used memory across all services, resident memory (actual physical RAM consumed), allocation limit (the maximum memory HANA can use), and per-service memory consumption. When used memory approaches the allocation limit, HANA begins unloading tables from memory to free space, which degrades query performance dramatically.
HANA organizes memory into pools: the column store for compressed analytical data, the row store for transactional tables, code and stack memory for running services, and the buffer cache for temporary data. Monitor each pool separately; column store saturation indicates analytics workload pressure, while row store growth points to transactional volume increases.
The M_SERVICE_MEMORY system view surfaces per-service memory consumption. The indexserver process typically consumes the majority of memory in production HANA systems. Sudden spikes in indexserver memory often correlate with expensive SQL queries or large data loads. Set alerts when indexserver memory grows beyond 85% of its historical average.
HANA Performance Metrics
Beyond memory, HANA performance monitoring tracks SQL statement execution times, data load speeds, and service response latencies. The M_EXPENSIVE_STATEMENTS view lists all SQL queries that exceeded a configurable execution threshold (default is 1 second). Review this view daily to identify optimization candidates; even a single poorly written query can saturate CPU and delay all other transactions.
HANA services, indexserver, nameserver, preprocessor, and xsengine, each have distinct health metrics. Monitor the status of all services via the M_SERVICES view. A stopped or restarting service indicates a crash that requires immediate investigation. Check the HANA trace files (indexserver.trc, nameserver.trc) for error messages explaining the failure.
Disk I/O becomes critical during savepoints (HANA’s mechanism for persisting in-memory data to disk) and data backups. Monitor savepoint duration via the M_SAVEPOINT_STATISTICS view. Savepoints taking longer than 300 seconds indicate storage performance issues or undersized log volumes.
HANA High Availability Monitoring
For HANA systems configured with system replication for high availability, monitor replication status continuously. The M_SERVICE_REPLICATION view shows whether replication is active, the replication mode (sync, syncmem, or async), and the current log shipping delay. A replication delay exceeding 60 seconds in synchronous mode indicates network problems between primary and secondary sites.
The secondary HANA system availability is equally critical. If the secondary becomes unreachable, automatic failover will not work during a primary site outage. Set alerts on secondary system health checks and test failover procedures quarterly to validate your disaster recovery plan.
SAP Application Monitoring
SAP application monitoring tracks the performance and availability of SAP NetWeaver application servers, ABAP and Java work processes, and the business transactions running on top of them. While HANA monitoring focuses on database health, application monitoring ensures that SAP workloads execute efficiently and users experience acceptable response times.
Work Process Monitoring
SAP application servers execute user requests through work processes – concurrent execution units allocated to different task types. Dialog work processes handle interactive user sessions. Background work processes execute batch jobs. Update work processes commit database changes asynchronously. Spool work processes manage print job output.
Monitor the number of available work processes for each type via transaction SM50 (for ABAP) or SMICM (for ICM processes). If all dialog work processes are busy, new user requests queue until a process becomes available. This manifests as slow login times or unresponsive transaction screens.
Set alerts when dialog work process utilization exceeds 80% for more than 5 minutes. This threshold gives administrators time to increase work process allocation or identify and terminate long-running processes consuming resources unnecessarily.
Transaction Response Time Monitoring
SAP transaction response times directly impact user productivity. The ST03 transaction aggregates response time statistics by transaction code, user, and time period. Monitor the average response time for business-critical transactions like VA01 (sales order creation), ME21N (purchase order creation), and FB60 (vendor invoice entry).
Response times consist of multiple components: GUI time (network latency between user workstation and application server), ABAP processing time, database time (HANA query execution), and RFC time (calls to other SAP systems or external services). When total response time degrades, decompose it into these components to isolate the bottleneck.
A sudden spike in database time indicates an inefficient SQL query or HANA memory pressure. An increase in RFC time points to network latency or slow responses from external systems. Elevated ABAP processing time suggests inefficient custom code or CPU saturation on the application server.
Background Job Monitoring
SAP background jobs execute scheduled tasks like report generation, data extraction, and interface file processing. Failed background jobs can disrupt business processes, delay month-end close activities, or cause data inconsistencies.
Monitor background job status via transaction SM37. Set alerts for jobs that exceed their historical runtime by 50% or more, jobs that finish with status “cancelled” or “aborted”, and jobs that fail to start at their scheduled time due to work process shortages.
Critical background jobs should have monitoring rules that escalate immediately upon failure. For example, if your daily invoice posting job fails, accounts payable cannot process payments the next day. This requires human attention within minutes, not hours.
User Session Monitoring
Track the number of active user sessions via transaction SM04 or AL08. Sudden drops in active sessions during business hours indicate system availability problems: users cannot log in or are being disconnected due to work process crashes.
Monitor session distribution across application server instances. If one server hosts 90% of active sessions while others sit idle, load balancing configuration needs adjustment. Uneven session distribution leads to poor resource utilization and localized performance hotspots.
SAP Server Infrastructure Monitoring
SAP server monitoring tracks the compute, storage, and network resources supporting SAP application servers and HANA database hosts. Infrastructure issues, CPU saturation, memory pressure, disk I/O bottlenecks, or network congestion directly impact SAP performance even when application and database metrics appear healthy.
CPU and Memory Monitoring
Monitor CPU utilization on all SAP servers at both the operating system and hypervisor level. Sustained CPU usage above 80% indicates insufficient compute capacity or runaway processes consuming resources. Use OS-level tools (top, vmstat on Linux; Task Manager on Windows) to identify which SAP processes are consuming CPU.
For HANA servers, CPU spikes often correlate with expensive SQL queries or savepoint operations. Cross-reference CPU usage patterns with HANA’s M_EXPENSIVE_STATEMENTS view to identify optimization targets. For application servers, high CPU typically indicates either excessive user load or inefficient ABAP code in frequently executed transactions.
Memory pressure on application servers manifests differently than on HANA hosts. Application server memory issues cause work process restarts, heap overflows in Java stacks, or extended garbage collection pauses. Monitor both physical memory consumption and swap usage. Any sustained swap activity indicates undersized server RAM.
Storage Performance Monitoring
SAP workloads generate distinct I/O patterns that require specific storage metrics. HANA database hosts perform large sequential writes during savepoints and log backups, requiring high-throughput storage (10,000+ IOPS for production systems). Application servers generate smaller random I/O patterns when accessing transport directories, spool files, and application logs.
Monitor disk latency separately for read and write operations. HANA savepoint performance degrades severely when write latency exceeds 10 milliseconds. Application server response times suffer when reading configuration files or transport data encounters read latencies above 5 milliseconds.
Track storage capacity consumption on volumes hosting HANA data and log files. HANA will not start if its data volume reaches 100% capacity. Set alerts at 80% capacity to allow time for capacity expansion or old backup deletion. Monitor log volume separately; transaction log disk full errors halt all database operations immediately.
Network Performance Monitoring
The network layer between SAP application servers and HANA databases carries all SQL query traffic and result set transfers. Network latency directly adds to database response time as measured in transaction statistics.
Monitor round-trip time (RTT) between application and database servers using ping or synthetic transaction tests. RTT above 1 millisecond indicates network problems that will impact HANA query performance. SAP recommends sub-millisecond network latency for optimal application-to-database communication.
Track network throughput on database server interfaces. Large analytical queries can transfer gigabytes of result data from HANA to application servers. If network bandwidth is saturated, these transfers queue and delay subsequent queries even when HANA itself has available capacity.
For distributed SAP landscapes spanning multiple data centers, monitor WAN link utilization between sites. RFC calls between SAP systems across WAN links are particularly sensitive to latency and packet loss. Packet loss above 0.1% causes RFC timeouts and transaction failures.
Best Practices for SAP Monitoring
Effective SAP monitoring requires more than deploying tools. It demands a structured approach to metric collection, alerting strategy, and cross-team coordination. These best practices emerge from production SAP environments running at scale.
Establish Baseline Performance Metrics
Before setting alert thresholds, measure normal system behavior over at least two weeks covering both peak and off-peak business hours. Record typical HANA memory consumption, average transaction response times, work process utilization, and background job runtimes. Use these baselines to configure meaningful alerts that detect genuine anomalies rather than normal operational variance.
Seasonal business patterns affect SAP workload significantly. Month-end financial close processes generate 3x to 5x more database load than mid-month operations. Quarterly reporting cycles spike CPU and memory consumption. Build separate baselines for these recurring patterns to avoid alert fatigue during predictable high-load periods.
Implement Layered Alerting
Not all SAP issues require immediate attention. Structure alerts into three severity tiers: critical (production down or major business impact), warning (degraded performance or resource trending toward exhaustion), and informational (capacity planning data or non-urgent issues).
Critical alerts should go directly to on-call engineers via SMS or paging systems like PagerDuty. Trigger these only for conditions that demand immediate response: all dialog work processes busy, HANA out of memory, primary database unreachable, or critical background job failures.
Warning alerts indicate developing problems that need attention within 1 to 4 hours. Send these to team chat channels (Slack, Microsoft Teams) where they are visible but not interruptive. Examples include HANA memory at 85% capacity, transaction response times 2x above baseline, or replication lag exceeding 30 seconds.
Correlate Across Monitoring Layers
SAP performance problems rarely exist in isolation within a single layer. A slow transaction may be caused by an expensive HANA query, insufficient application server work processes, network latency, or storage I/O contention. Single-layer monitoring surfaces symptoms; correlation reveals root causes.
When alerts fire, check metrics across all three layers simultaneously. If HANA CPU spikes, examine which application server transactions are executing at that moment via ST03. If transaction response times degrade, verify HANA query times, network latency, and application server CPU before concluding the database is the bottleneck.
Purpose-built SAP monitoring tools automate this correlation by maintaining topology awareness. They understand that application server SAPAPP01 communicates with HANA database SAPHANADB01 and automatically link performance data across both when alerting.
Monitor Business Transaction Outcomes
Technical metrics (CPU, memory, response time) are necessary but insufficient. What matters ultimately is whether business transactions complete successfully. Monitor business process completion rates: How many sales orders were created today compared to yesterday? How many invoices posted? How many goods movements processed?
Drops in business transaction volume often precede technical alerts. If invoice posting volume drops 40% during normal business hours, investigate immediately even if all technical metrics appear healthy. The root cause might be an integration failure, authorization issue, or master data problem that does not surface in infrastructure monitoring.
Test Failover and Recovery Procedures
SAP high availability configurations (HANA system replication, application server clustering) are only as reliable as the failover mechanisms supporting them. Test failover quarterly during maintenance windows to validate monitoring alerts fire correctly, automatic failover executes successfully, and recovery time meets SLA requirements.
Document alert response procedures explicitly. When a HANA replication lag alert fires at 2 AM, the on-call engineer should not need to research how to diagnose it. Runbooks covering common scenarios (high memory, slow queries, replication failures, job failures) reduce mean time to resolution from hours to minutes.
Tools and Implementation
Implementing SAP monitoring requires selecting tools that understand SAP architecture, integrate with HANA and NetWeaver components, and fit your operational model (SaaS, self-hosted, or hybrid). The choice depends on several factors: the size and complexity of your SAP landscape, whether your organization prefers cloud-based or on-premises solutions, and whether you need SAP-specific monitoring or plan to unify SAP visibility within a broader observability platform.
SAP-Native Monitoring Tools
SAP provides built-in monitoring capabilities through SAP Solution Manager and SAP Focused Run. These tools are purpose-built for SAP environments and offer deep integration with SAP HANA, NetWeaver, and S/4HANA components.
SAP Solution Manager has been the traditional choice for large SAP installations. It includes technical monitoring (servers, databases, application performance), business process monitoring, and root cause analysis capabilities. The platform understands SAP system topology automatically and monitors system replication status, work process health, and transaction response times without custom configuration.
The primary limitation of Solution Manager is operational complexity. It requires its own dedicated SAP system to run (typically sized at 20 to 30% of production capacity), demands specialized skills to configure and maintain, and has a steep learning curve for administrators unfamiliar with SAP tooling. Many organizations find the total cost of ownership high once infrastructure, licensing, and staffing costs are factored in.
SAP Focused Run is the next-generation platform replacing Solution Manager for greenfield deployments. It offers improved user experience, simplified configuration, and better automation of routine monitoring tasks. Focused Run supports monitoring multiple SAP systems from a single interface and includes health dashboards, alert management, and integration with third-party ticketing systems.
Third-Party APM and Observability Platforms
Many organizations monitor SAP alongside other enterprise applications using unified observability platforms. Tools like Datadog, Dynatrace, and New Relic offer SAP-specific integrations that collect metrics from HANA and application servers while correlating them with broader infrastructure and application data.
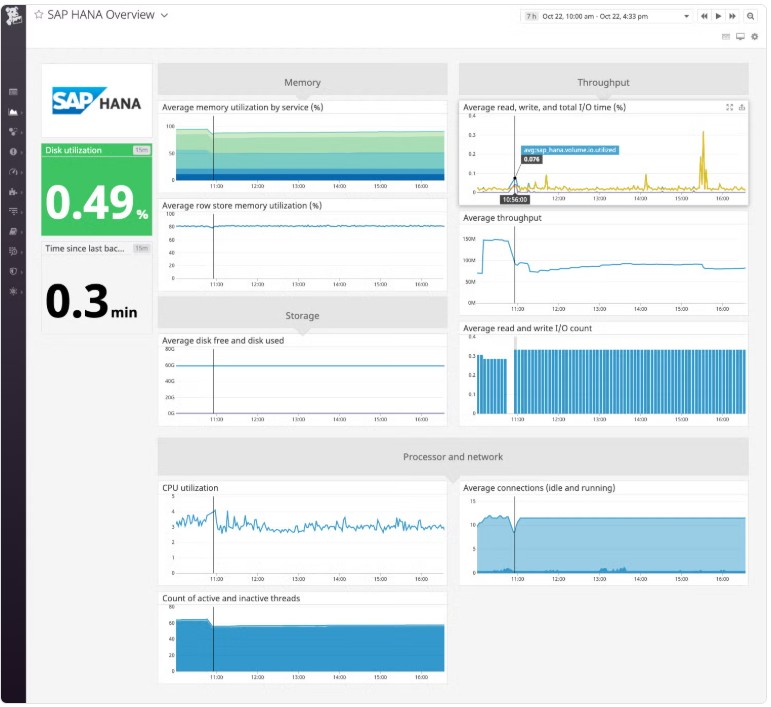
Datadog’s SAP integration connects to HANA via JDBC to extract database metrics and uses the SAP Control Web Service API to collect application server statistics. It surfaces HANA memory consumption, expensive SQL statements, and work process utilization in pre-built dashboards. The advantage is unified visibility if you already use Datadog for other workloads. The limitation is less SAP-specific depth compared to tools purpose-built for SAP.
Dynatrace takes a different approach with its OneAgent, which automatically discovers SAP components and instruments ABAP code to provide distributed tracing across RFC calls, database queries, and external service calls. This gives deep transaction-level visibility but requires installing agents on all SAP hosts and accepting the associated overhead (typically 2 to 4% CPU utilization).
For organizations with strict data residency requirements or those running SAP in air-gapped environments, cloud-only SaaS platforms are not viable. This is where self-hosted monitoring platforms become relevant.
CubeAPM for SAP Monitoring

CubeAPM provides unified monitoring for SAP HANA, application servers, and supporting infrastructure with a key operational difference – it runs inside your own cloud or data center rather than sending telemetry data to an external SaaS vendor. This matters for organizations with regulatory constraints (financial services, healthcare, government) or multi-region SAP deployments where data egress costs make SaaS observability prohibitively expensive.
CubeAPM connects to SAP HANA via standard SQL queries to collect memory metrics, service status, expensive statements, and replication health. It integrates with SAP application servers through the SAP Control API to track work process utilization, transaction response times, and background job status. Infrastructure metrics come from OpenTelemetry-compatible agents running on SAP server operating systems.
The platform correlates these three data streams automatically when HANA memory spikes; CubeAPM surfaces which ABAP transactions were executing at that moment and which users triggered them. This correlation happens inside your infrastructure without requiring a round trip to an external API.
Deployment takes the form of managed self-hosting. CubeAPM runs on your Kubernetes cluster or virtual machines, but the vendor handles updates, patches, and platform support. This contrasts with fully DIY open source stacks (Prometheus, Grafana, Elasticsearch) that leave all operational burden on your team.
Pricing follows a single dimension – $0.20 per GB of telemetry data ingested. A typical mid-sized SAP landscape (3 application servers, 1 HANA database, 200 users) generates 800 GB to 1.2 TB monthly, translating to $120 to $180 per month. This remains flat as user count increases, unlike per-seat pricing models where adding 50 users would multiply monitoring costs.
CubeAPM fits SAP environments where data sovereignty, predictable costs, and integration with existing Kubernetes monitoring or server monitoring tools matter more than the broadest possible feature catalog. It does not replace SAP Solution Manager for organizations deeply invested in SAP’s native tooling, but it provides an alternative for teams seeking unified observability across SAP and non-SAP workloads without vendor lock-in to proprietary query languages or cloud-only architectures.
Selecting the Right Monitoring Approach
The best SAP monitoring strategy depends on your specific context. Organizations running SAP workloads exclusively with dedicated SAP Basis teams often prefer SAP-native tools for their deep integration and SAP-specific expertise.
Enterprises monitoring SAP alongside diverse application portfolios (microservices, databases, cloud services) benefit from unified observability platforms that correlate SAP metrics with everything else. The tradeoff is accepting the operational and cost model of the chosen platform.
For environments with data residency constraints, air-gapped networks, or where SaaS egress costs are prohibitive, self-hosted platforms like CubeAPM or open source stacks (Prometheus + Grafana) become the practical options. The choice between them hinges on whether your team has the bandwidth to maintain the monitoring stack itself or prefers vendor-managed operations.
Regardless of tool choice, successful SAP monitoring requires SAP-specific knowledge on the implementation team. Generic infrastructure monitoring captures server metrics but misses SAP semantics. Understanding what a sudden increase in update work process runtime means for your financial posting processes requires both monitoring data and SAP Basis expertise.
Effective SAP monitoring protects business continuity by detecting issues before they escalate into outages or performance degradation that impacts end users. Whether you implement SAP-native tools, third-party APM platforms, or self-hosted observability stacks, the goal remains the same: maintain comprehensive visibility into HANA databases, application servers, and supporting infrastructure so your SAP systems deliver the performance your business operations depend on.
Disclaimer: The information in this article reflects the latest details available at the time of publication and may change as technologies and products evolve. Features, pricing, and plan limits can change over time. Always verify the latest information directly with the vendor before making purchasing or deployment decisions.
Frequently Asked Questions
What is the difference between SAP monitoring and SAP Basis administration?
SAP Basis administration is the practice of managing SAP system configuration, user authorizations, transport management, and patches. SAP monitoring is the continuous observation of system health and performance. Monitoring tools surface issues that Basis administrators then investigate and resolve.
How much does SAP monitoring cost?
SAP-native tools like Solution Manager require SAP licensing fees and dedicated infrastructure. Third-party APM platforms charge per host (Datadog at $15 to $31 per host per month) or per user (New Relic at $49 to $99 per user per month). Self-hosted platforms like CubeAPM charge per data volume ingested (typically $0.20 per GB).
Can I monitor SAP HANA without installing agents?
Yes, HANA monitoring primarily uses SQL queries against system views like M_SERVICE_MEMORY and M_EXPENSIVE_STATEMENTS. Most monitoring tools connect via JDBC or the HANA Python SDK without requiring in-database agents. Application server monitoring may require agents depending on the depth of visibility needed.
What are the most important SAP HANA metrics to monitor?
The critical HANA metrics are used memory compared to allocation limit, column store and row store consumption separately, expensive SQL statement count and duration, service status (indexserver, nameserver, preprocessor), savepoint duration, and system replication lag if high availability is configured.
How do I monitor SAP system replication for high availability?
Monitor the M_SERVICE_REPLICATION view in HANA to track replication status, mode (sync or async), and log shipping delay. Alert when replication lag exceeds 60 seconds in synchronous mode or when the secondary system becomes unreachable. Test failover quarterly to validate monitoring detects failures correctly.
What causes slow SAP transaction response times?
Slow transactions result from multiple causes, including expensive SQL queries that consume HANA CPU, insufficient application server work processes that create queuing, network latency between the application and database tiers, or storage I/O bottlenecks during HANA savepoints. Use ST03 transaction statistics to decompose response time into GUI, ABAP, database, and RFC components to isolate the bottleneck.
Should I use SAP Solution Manager or a third-party monitoring tool?
SAP Solution Manager provides the deepest SAP-specific monitoring capabilities and integrates tightly with SAP support processes. Third-party tools offer broader visibility if you monitor SAP alongside other applications and typically have better user experience. Self-hosted platforms suit organizations with data residency requirements or air-gapped environments. The choice depends on your SAP landscape size, monitoring team skills, and whether you prefer SAP-native or unified observability approaches.