Oracle Database monitoring tools help teams track SQL query latency, resource utilization, and connection health across mission-critical workloads. But choosing the right Oracle database monitoring tool remains challenging due to unpredictable pricing, steep learning curves, and poor Oracle-specific visibility across distributed environments.
CubeAPM is the best Oracle database monitoring provider, built for simplicity, precision, and scalability. It offers unified dashboards for metrics, logs, and traces, OpenTelemetry-native ingestion, and slow queries. In this guide, we’ll explore the top Oracle database monitoring tools, comparing their features, pricing, pros and cons, and more.
8 Best Oracle Database Monitoring Tools
- CubeAPM
- Datadog
- New Relic
- Dynatrace
- Oracle Enterprise Manager (OEM)
- SolarWinds Database Performance Analyzer (DPA)
- Quest Foglight for Oracle
- ManageEngine Applications Manager
What is an Oracle Database Monitoring Tool?
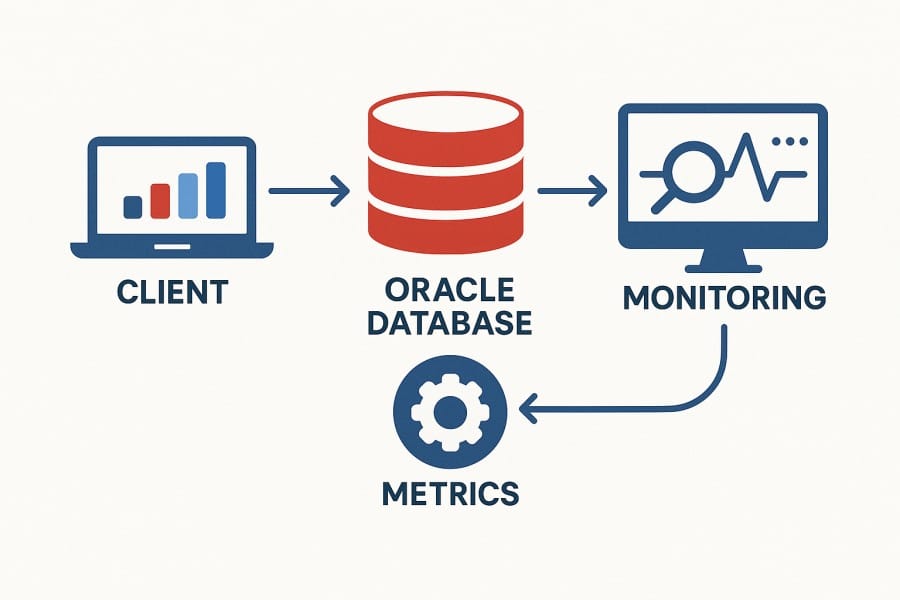
An Oracle database monitoring tool is a software platform that continuously tracks the health, performance, and resource utilization of Oracle database environments. It captures key telemetry, such as query execution time, I/O latency, wait events, CPU consumption, and session locks, to help database administrators detect performance bottlenecks, optimize queries, and prevent downtime before it impacts users.
Modern Oracle database monitoring tools don’t just report metrics; they unify metrics, logs, traces, and events (MELT) into a single observability layer. This gives real-time visibility across on-prem, cloud, and hybrid Oracle deployments. For today’s digital-first enterprises, Oracle monitoring is essential because it:
- Ensures consistent performance across mission-critical systems such as finance, ERP, and CRM applications that rely on Oracle.
- Reduces Mean Time to Detect (MTTD) and Resolve (MTTR) by providing automated alerts and root-cause insights.
- Optimizes resource allocation using intelligent sampling and cost-efficient telemetry retention, helping control observability spend.
- Supports compliance and audit readiness with detailed telemetry logs and secure data retention—vital for regulated sectors like banking or healthcare.
- Enables proactive scalability, helping teams anticipate capacity issues and plan database growth efficiently.
Example: Monitoring Banking Transactions with CubeAPM
Consider a financial institution running high-volume Oracle Database workloads for real-time transaction processing. Using CubeAPM, the team instruments the database with OpenTelemetry agents, automatically collecting query traces, lock wait times, and connection pool metrics. When a latency spike occurs in the “fund transfer” workflow, CubeAPM’s Smart Sampling engine (which retains critical high-latency samples while filtering noise) identifies a specific SQL procedure causing 1.2-second delays.
Within the CubeAPM dashboard, correlated metrics from infrastructure monitoring and error tracking reveal that the spike aligns with a temporary CPU saturation on one node. The DBA team receives instant alerts on Slack, enabling them to scale resources and resolve the issue in minutes—without affecting transaction SLAs.
Why Do Teams Choose Different Oracle Database Monitoring Tools?
Cost Predictability and Scalability
Enterprises running large Oracle RAC or Data Guard clusters generate massive telemetry volumes. On forums, like Reddit, users consistently report budget overruns from host-based or feature-based billing models in platforms like Datadog and New Relic. Each metric, log, or synthetic run adds incremental cost, making total spend unpredictable. As Oracle workloads scale, teams prefer tools with simple, ingestion-based pricing that align with data volume, such as CubeAPM’s $0.15/GB model—allowing clear monthly forecasts without hidden fees.
Oracle-Native Telemetry Depth
Unlike generic APM platforms, Oracle monitoring requires visibility into AWR, ASH, and wait-event analytics, as well as insights on blocking sessions, redo logs, and RAC interconnect delays. Reviews on G2 and the Oracle Community emphasize that DBAs need access to these deep internals to diagnose latch contention, buffer cache issues, or SQL plan regressions. Tools that lack this level of granularity force teams to pivot between OEM and third-party dashboards, leading many to seek platforms that natively understand Oracle’s performance schema.
Lightweight Deployment and Low Overhead
DBAs are wary of agents that increase CPU load or require complex JDBC integration. Threads on DBA Stack Exchange highlight production environments where traditional collectors introduced measurable query lag. As a result, teams now favor agentless or lightweight OpenTelemetry collectors that pull Oracle metrics asynchronously with <1% overhead. CubeAPM, for instance, supports containerized collectors deployable via Helm and pre-configured to scrape Oracle telemetry efficiently.
Strong Correlation Across SQL, Application, and Infrastructure
Modern Oracle systems don’t operate in isolation—they’re tightly coupled with middleware, APIs, and microservices. Observability platforms like Dynatrace or CubeAPM offer topology mapping that connects slow SQL queries to application traces and host metrics. According to Gartner Peer Insights 2025, this cross-layer correlation reduces mean time to resolution (MTTR) by up to 45%. It lets SREs instantly see if a bottleneck originates from inefficient SQL, JVM GC cycles, or node resource starvation.
Multi-Cloud and Hybrid Environment Support
With Oracle workloads running across OCI, AWS, Azure, and on-prem, teams need tools that unify data collection and alerting across all environments. A 2025 IDC Cloud Survey notes that 64% of Oracle customers operate hybrid estates. Monitoring tools built for single-cloud or local deployments often fail here, prompting adoption of multi-cloud-ready solutions like CubeAPM or Datadog that integrate with Kubernetes, Terraform, and native cloud services for real-time discovery.
OEM and Licensing Considerations
While Oracle Enterprise Manager (OEM) offers deep native integration, many organizations face licensing complexity and cost add-ons for advanced features like the Diagnostic or Tuning Packs. G2 reviewers note that smaller teams or cost-sensitive enterprises prefer external tools to avoid these extra license fees while still retaining rich telemetry. This is where OpenTelemetry-based solutions like CubeAPM or ManageEngine fill the gap—offering similar insights without restrictive licensing.
8 Best Oracle Database Monitoring Tools
1. CubeAPM
Overview
CubeAPM is an OpenTelemetry-native observability platform designed for full-stack visibility across metrics, logs, traces, and events. Known for its simplicity and transparent pricing, it’s becoming a preferred choice among engineering and SRE teams monitoring Oracle databases across hybrid and on-prem environments. With native Oracle integration, CubeAPM correlates SQL query performance with infrastructure metrics and application traces—helping teams detect slow queries, deadlocks, or replication delays in real time. Its on-prem hosting and BYOC deployment options make it ideal for enterprises prioritizing data sovereignty and compliance.
Key Advantage
Unified MELT observability for Oracle workloads—combining metrics, logs, and traces into a single correlated view with zero vendor lock-in.
Key Features
- SQL Query Tracing: Tracks query latency, execution time, and blocking sessions across Oracle instances.
- Wait Event Analysis: Visualizes AWR/ASH metrics to help identify I/O bottlenecks or lock contention.
- Smart Sampling: Retains high-value traces (slow queries, errors) for accurate Oracle performance insights while optimizing data volume.
- Real-Time Alerts: Configurable PromQL and OpenTelemetry alerts for CPU spikes, failed connections, or long-running queries.
- On-Prem & BYOC Support: Enables secure deployment within private clouds to comply with data localization and regulatory requirements.
Pros
- Predictable pricing without feature-based tiers
- Deep Oracle and infrastructure correlation in one dashboard
- OpenTelemetry-first and compatible with Datadog/New Relic agents
- Quick setup using Helm and automated instrumentation guides
- Supports 800+ integrations and multi-environment observability
Cons
- Less suitable for teams seeking a fully managed off-prem solution
- Focused on observability and does not include cloud security or compliance management features
CubeAPM Pricing at Scale
CubeAPM uses a transparent pricing model of $0.15 per GB ingested. For a mid-sized business generating 45 TB (~45,000 GB) of data per month, the monthly cost would be ~$7,200/month*.
*All pricing comparisons are calculated using standardized Small/Medium/Large team profiles defined in our internal benchmarking sheet, based on fixed log, metrics, trace, and retention assumptions. Actual pricing may vary by usage, region, and plan structure. Please confirm current pricing with each vendor.
Tech Fit
CubeAPM integrates seamlessly with Oracle Database (19c, 21c) across Linux, Windows, and Kubernetes environments. It’s optimized for teams using Java, .NET, Python, Node.js, and Go applications that depend on Oracle backends, and fits hybrid or self-hosted deployments needing OpenTelemetry compatibility.
2. Datadog
Overview
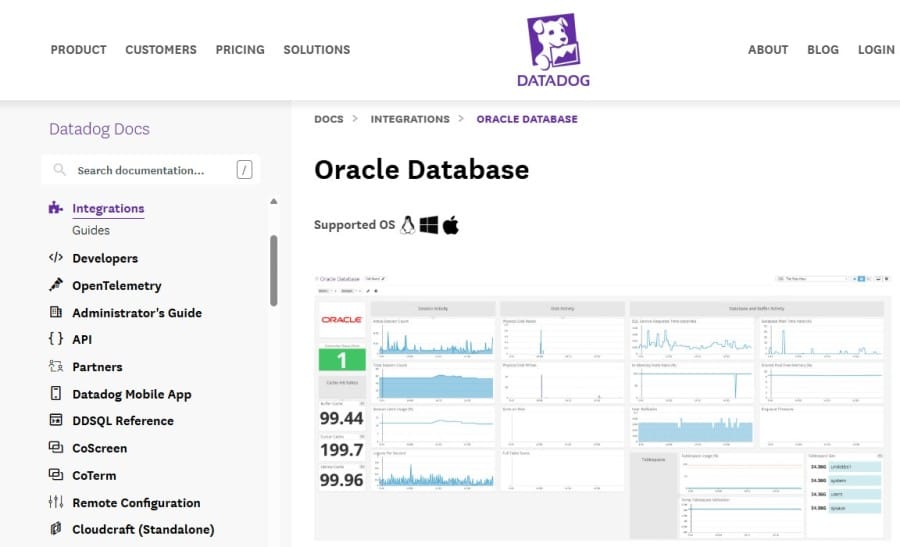
Datadog is a well-established observability platform known for its deep integrations and extensive analytics, making it a popular choice among large enterprises monitoring complex Oracle environments. Its Oracle Database Monitoring (DBM) module provides visibility into SQL query performance, wait events, connection health, and resource utilization across on-premises, multitenant, and containerized Oracle setups. Datadog’s strength lies in its cloud-native architecture and ability to correlate Oracle telemetry with application and infrastructure data across multi-cloud deployments—though its layered pricing often challenges cost predictability at scale.
Key Advantage
End-to-end visibility into Oracle SQL performance with automated query aggregation, wait-time analysis, and historical trend visualization—all within a unified APM and infrastructure view.
Key Features
- Query Performance Analytics: Automatically collects and aggregates Oracle SQL metrics, helping identify slow or resource-intensive queries.
- Wait Event Insights: Tracks common Oracle wait events like db file sequential read or log file sync to surface bottlenecks faster.
- Session & Connection Monitoring: Monitors active sessions, user connections, and blocking locks in real time.
- Multitenant & RAC Support: Compatible with Oracle RAC, PDBs, and CDBs for multi-instance environments.
- Correlation Across Stack: Links Oracle query data with host metrics, traces, and logs for faster root cause analysis.
Pros
- Mature ecosystem with 600+ prebuilt integrations
- Rich visualization dashboards for Oracle SQL and infrastructure metrics
- Strong AI-based anomaly detection and alerting
- Easy deployment via Datadog Agent or Dockerized collector
- Granular access control and multi-cloud support
Cons
- Costs increase quickly as ingestion and feature usage grow
- SaaS-only platform; no self-hosting option
Datadog Pricing at Scale
Datadog charges differently for different capabilities. Database Monitoring ($70 per host/month; APM starts at $31/month; infra starts at $15/month; logs start at $0.10/GB, and so on. For a mid-sized business ingesting around 45 TB (~45,000 GB) of data per month, the cost would come around $27,475/month*.
Tech Fit
Datadog is ideal for cloud-native Oracle deployments on AWS RDS, OCI, and Azure, and for teams managing hybrid workloads with diverse technologies like Java, Python, or .NET. It’s particularly suited for enterprises that already rely on Datadog for application or infrastructure monitoring and want Oracle telemetry within the same dashboard. However, teams needing on-prem data control or simplified pricing may find CubeAPM a more efficient and transparent alternative.
3. New Relic
Overview
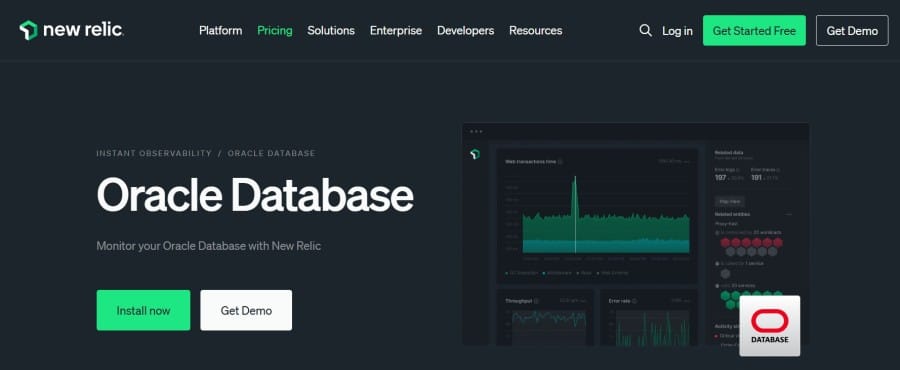
New Relic is a broad observability platform with a mature Oracle integration that collects database, tablespace, memory, and session metrics via the Infrastructure agent (nri-oracledb). It’s often chosen by teams that want Oracle telemetry to live alongside app and infra views, and by enterprises running Exadata Cloud@Customer (ExaCC) or hybrid estates who benefit from curated Oracle dashboards and quickstarts.
Key Advantage
Unified Oracle telemetry inside a single New Relic workspace—bringing query, wait, and resource signals together with APM, logs, and infra for faster investigations.
Key Features
- Oracle integration (nri-oracledb): Collects core Oracle metrics for databases, tablespaces, memory, sessions, and more via the Infrastructure agent.
- Wait/SQL visibility: Surfaces performance indicators you can chart and alert on, tying slow operations back to database behavior.
- ExaCC coverage: How-to guidance and curated views for monitoring Oracle Exadata Cloud@Customer deployments.
- Instant Observability quickstarts: Prebuilt dashboards (including DBmarlin quickstart) to accelerate Oracle monitoring setup.
- Correlated investigations: Pivot from DB metrics to APM traces, logs, and hosts within the same UI to reduce MTTR.
Pros
- Broad platform with APM, infra, logs, and database views in one place
- Helpful quickstarts and curated Oracle dashboards to speed onboarding
- Works well for hybrid estates and ExaCC scenarios
- Mature visualization and alerting built around NRQL
Cons
- Data ingest and user licensing can raise costs at higher volumes
- No option to self-host; SaaS-only
New Relic Pricing at Scale
New Relic’s billing is based on data ingested, user licenses, and optional add-ons. The free tier offers 100 GB of ingest per month, then it costs $0.40 per GB after that. For a business ingesting 45 TB of logs per month, the cost would come around $25,990/month*.
Tech Fit
Strong fit for teams already on New Relic APM/infra who want Oracle in the same pane of glass, including on-prem, OCI/ExaCC, and hybrid environments. Works well for mixed Java, .NET, Python, Node.js stacks that rely on Oracle and need fast correlation from DB symptoms to application traces and host metrics.
4. Dynatrace
Overview
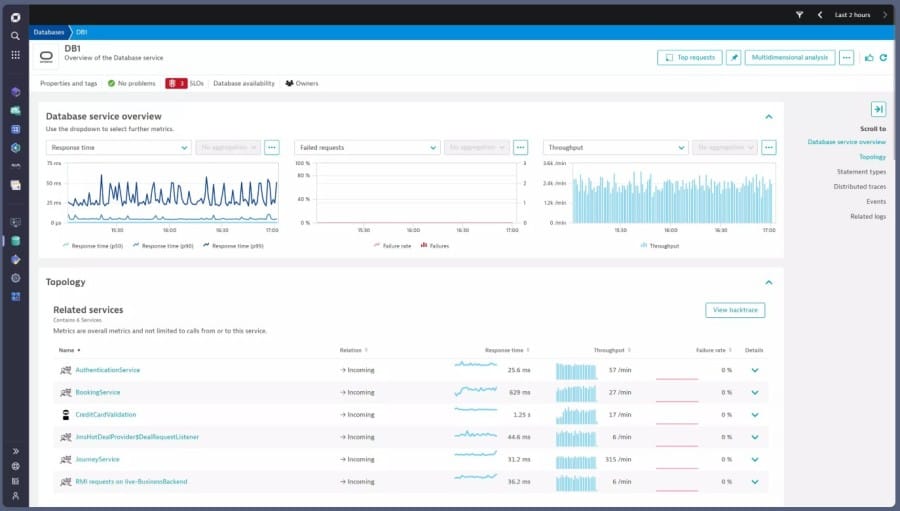
Dynatrace brings AI-assisted, full-stack observability to Oracle Database with OneAgent-driven discovery and an Oracle extension that adds server-side insights. It’s chosen by enterprises that want topology mapping (Smartscape), automatic dependency detection, and deep correlation from slow SQL to host and service conditions—across on-prem, OCI, and multi-cloud estates. Its Oracle setup supports classic database insights and Extensions 2.0 for fine-grained telemetry, giving DBAs a high-fidelity view of wait events, statements, and connection health.
Key Advantage
AI-assisted root cause for slow Oracle transactions, linking SQL statements and wait classes to application traces and infrastructure conditions in one workflow.
Key Features
- Oracle extension (Extensions 2.0): Adds server-side Oracle metrics and SQL visibility via an officially distributed JDBC driver (with license acceptance).
- Database Insights: Surfaces Oracle performance drivers and bottlenecks with an infrastructure perspective for faster RCA.
- Smartscape topology: Auto-discovers dependencies between services, hosts, and the Oracle layer to map blast radius quickly.
- RAC/Multicloud context: Works across hybrid deployments, including OCI integrations and RAC-backed applications.
- Davis AI correlation: Prioritizes anomalies and connects slow SQL to upstream services and resource contention.
Pros
- Highly automated discovery and dependency mapping
- Strong correlation across SQL, apps, hosts, and Kubernetes
- Extensions 2.0 offers flexible, declarative Oracle data collection
- Mature dashboards and alerting, with AI-driven triage
- Suitable for multi-cloud and OCI scenarios
Cons
- Cost can rise with memory-based host monitoring plus data ingest, depending on footprint
- Steep learning curve
Dynatrace Pricing at Scale
- Full stack: $0.01/8 GiB hour/month or $58/month/8GiB host
- Log Ingest & process: $0.20 per GiB
For a similar 45 TB (~45,000 GB/month) volume, the cost would be $21,850/month*.
Tech Fit
Best for organizations standardizing on Dynatrace for AI-assisted, full-stack observability and needing Oracle visibility alongside microservices and Kubernetes. Works well across on-prem, OCI, AWS, and Azure; suited to mixed Java, .NET, Node.js, Python stacks where Oracle backs critical services and correlation from SQL to service to host is essential.
5. Oracle Enterprise Manager (OEM)
Overview
Oracle Enterprise Manager (OEM), and its Oracle Cloud Infrastructure counterpart—provides native visibility into Oracle Databases, offering detailed performance analytics through AWR, ASH, ADDM, and SQL Monitoring. It’s the most deeply integrated Oracle monitoring solution, giving DBAs precise insights into workload patterns, query performance, and database health across on-premises, Exadata, and OCI deployments. OEM remains the preferred tool for Oracle-heavy enterprises that require first-party telemetry, compliance automation, and patch management.
Key Advantage
End-to-end visibility for Oracle workloads with deep AWR- and ASH-level metrics, performance tuning workflows, and automation built directly into the Oracle ecosystem.
Key Features
- Performance Hub & ASH Analytics: Monitors real-time and historical SQL execution times, waits, and I/O bottlenecks.
- Fleet Monitoring: Enables centralized visibility across hundreds of Oracle instances with automatic incident detection.
- Historical SQL & Baselines: Detects query regressions using optimizer plan baselines and workload comparisons.
- Exadata & Cloud Database Awareness: Integrates cell metrics, RAC status, and OCI performance views in a unified console.
- Automation & Compliance: Delivers patching, backup validation, and vulnerability assessment from one interface.
Pros
- Deepest Oracle-native telemetry for diagnostics and tuning
- Seamless integration with OCI, Exadata, and RAC environments
- Powerful automation and compliance management
- Fleet-wide observability with actionable insights
Cons
- Needs improvement in the UI and notifications
- Integration issues
- Complex configuration for non-DBA users
OEM Pricing at Scale
According to Oracle’s Database Management pricing, OEM and OCI Database Management services are billed per CPU usage rather than data volume.
- Database Management for Cloud Databases: $0.05 per OCPU-hour
- Database Management for External Databases: $0.05 per Host CPU-hour
- Database Management for External Databases (BYOL): $0.025 per Host CPU-hour
For a mid-sized company managing 10 Oracle hosts (8 cores each, 24×7 monitoring), the estimated cost is:
10 × 8 × 24 × 30 × $0.05 = $2,880/month, excluding storage and optional patching services.
Tech Fit
OEM is best for enterprises fully invested in Oracle Database, including OCI, Exadata, and RAC deployments. It’s ideal for DBA-driven teams requiring deep performance diagnostics, tuning automation, and compliance visibility, while CubeAPM offers a simpler, more cost-effective alternative for hybrid observability across Oracle and non-Oracle stacks.
6. SolarWinds Database Performance Analyzer (DPA)
Overview
SolarWinds DPA is a popular database performance monitoring tool designed for Oracle DBAs who need granular SQL-level diagnostics with minimal system impact. It’s known for its agentless architecture, collecting metrics remotely to maintain production stability. With strong visualizations around wait-time, blocking sessions, and execution plans, DPA helps operations teams resolve performance issues before they affect business applications.
Key Advantage
Industry-leading wait-time analysis that isolates the precise cause of Oracle performance degradation—whether it’s a blocking session, I/O bottleneck, or inefficient SQL.
Key Features
- Agentless Oracle Monitoring: Captures database metrics via direct connections, adding less than 1% overhead.
- Wait-Time Analysis: Surfaces top waits and locking events that affect Oracle session responsiveness.
- Query Tuning Insights: Identifies inefficient SQL statements and plan changes with tuning suggestions.
- Historical Baselines: Provides long-term performance comparisons for detecting regressions and growth patterns.
- Cross-Engine Visibility: Monitors Oracle alongside other databases like SQL Server, MySQL, and PostgreSQL.
Pros
- Extremely lightweight and safe for production monitoring
- Focused SQL and wait-event analysis ideal for Oracle DBAs
- Clear visualization of workload trends and bottlenecks
- Easy deployment without agents or complex collectors
Cons
- Focused on the database layer; lacks full-stack observability
- Learning curve
- Database integration issues
SolarWinds DPA Pricing at Scale
Database Observability (DPA) starts at $142 per month per database instance. For a mid-sized company monitoring 30 Oracle databases, the estimated cost is 30 × $142 = $4,260/month.
Tech Fit
SolarWinds DPA suits Oracle-centric teams running on-prem, Exadata, or IaaS environments that demand low-overhead monitoring and granular query visibility. It’s ideal for DBAs focused solely on performance tuning. However, organizations seeking multi-cloud observability, unified MELT correlation, or predictable pricing at scale will find CubeAPM a more modern, cost-efficient choice.
7. Quest Foglight for Oracle
Overview
Quest Foglight for Oracle is a DBA-focused monitoring platform built specifically for Oracle performance troubleshooting. It provides deep visibility into SQL execution, waits, blocking, I/O, and memory—backed by change tracking and multi-dimensional drill-downs. Foglight’s Oracle cartridge ships curated dashboards for CDB/PDB estates and guides you through setup, including required DB user/privileges for secure collection. It’s widely chosen by DBA teams that want Oracle-native depth without adopting a broader, app-first observability suite.
Key Advantage
Purpose-built Oracle performance analytics with detailed drill-downs (SQL/plan/wait/locks) and historical change tracking that speeds true root-cause analysis.
Key Features
- SQL, waits & blocking analysis: Investigate expensive statements, top wait events, latch/contention, and blocking chains with drill-downs.
- Change tracking & baselines: Compare periods and configuration changes to spot regressions quickly.
- CDB/PDB (multitenant) support: Monitor container and pluggable databases; documented setup and limitations.
- Guided Oracle setup: Clear prerequisites for creating a dedicated Foglight user/roles and secure connections.
- Admin controls & retention: Central dashboard to tune collection/retention for Oracle agents across estates.
Pros
- Deep Oracle telemetry with focused DBA workflows
- Strong historical context and change correlation for RCA
- Multitenant awareness for CDB/PDB topologies
- Clear documentation for setup and administration
Cons
- Navigation difficulties
- Complex dashboard and GUI
Quest Foglight Pricing at Scale
Quest does not publish list pricing for Foglight for Oracle; licensing is typically per database instance (named or monitored), quoted via sales. In practice, costs scale linearly with the number of Oracle databases you monitor rather than by data volume. For a mid-sized company ingesting 45 TB/month across, say, 30 Oracle instances, spend will depend on per-instance quotes and maintenance.
Tech Fit
Best for Oracle-centric teams that need fine-grained SQL/wait/lock diagnostics and multitenant visibility in on-prem, Exadata, or IaaS environments. If your priority is OpenTelemetry pipelines, unified MELT correlation, or predictable data-based pricing, CubeAPM is generally easier to scale and budget for.
8. ManageEngine Applications Manager
Overview
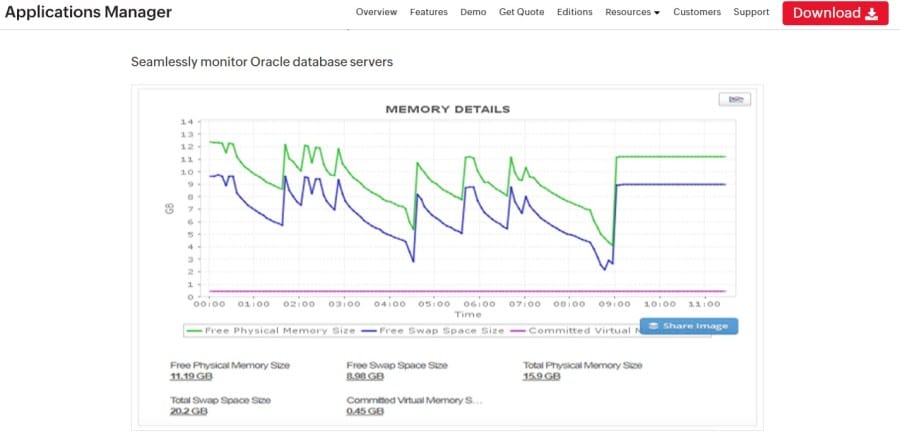
ManageEngine Applications Manager offers Oracle-specific monitoring across on-prem, OCI, and hybrid environments. It tracks core database health—PGA/SGA memory, ASM, tablespaces, sessions, wait events, and query performance—while providing curated Oracle views (RAC, CDB/PDB) and root-cause workflows. Because licensing is per monitor/user (not per-GB), it appeals to Oracle shops that want predictable instance-based pricing and a broad toolkit for app, server, and DB metrics in one console.
Key Advantage
Instance-centric Oracle monitoring with rich DBA metrics (PGA/SGA, ASM, sessions, waits) and RAC/CDB awareness—packaged in an edition-based, per-monitor licensing model.
Key Features
- PGA/SGA & Memory Insight: Tracks Oracle PGA/SGA utilization and cache efficiency to prevent memory bottlenecks.
- Sessions, Waits & Locks: Surfaces active sessions, wait classes, and blocking chains for faster triage.
- Tablespace & ASM Metrics: Monitors growth, free space, and ASM health for capacity planning.
- RAC & Multitenant Views: Provides topology and KPIs for RAC clusters and CDB/PDB estates.
- OCI Monitoring Hooks: Pulls VM/storage/network signals from Oracle Cloud to correlate with DB behavior.
Pros
- Strong Oracle telemetry coverage for DBAs
- RAC and multitenant awareness with actionable dashboards
- Edition-based pricing can be economical for small to mid estates
- Broad platform coverage beyond Oracle (apps, servers, services)
Cons
- Per-monitor licensing scales with instance count rather than usage
- Limited features and customization
- Complexity for new users
ManageEngine Applications Manager Pricing at Scale
Pricing is edition-based and tied to monitor counts/users, not data volume. For example, the Professional edition lists 50 monitors at $1,795/year and 100 monitors at $3,195/year, while Enterprise tiers scale to thousands of monitors. Oracle Database monitors consume “standard” monitor slots, so total cost depends on the number of Oracle instances you track (plus any users/add-ons you choose).
Tech Fit
Best for Oracle-centric teams that prefer instance-based licensing and need practical DBA metrics across on-prem and OCI, including RAC and CDB/PDB topologies. If your roadmap leans toward OpenTelemetry pipelines, deep trace-level correlation, and predictable data-based pricing for growing observability volumes, CubeAPM is typically the more affordable and scalable choice.
Conclusion
Choosing the right Oracle database monitoring tool often challenges teams with complex pricing models, heavy deployments, and limited Oracle-native visibility. Many find that traditional monitoring platforms struggle to unify logs, metrics, and traces from hybrid Oracle environments, making troubleshooting and cost optimization harder.
CubeAPM solves these issues by offering a single OpenTelemetry-based platform for Oracle metrics, logs, and traces, backed by real-time dashboards, smart sampling, and on-prem hosting for compliance. It simplifies performance diagnostics and drastically lowers operational costs.
For teams seeking powerful, transparent, and scalable Oracle observability, CubeAPM is the smarter choice.
Schedule a FREE demo with CubeAPM today.
Disclaimer: The information in this article reflects the latest details available at the time of publication and may change as technologies and products evolve.
FAQs
1. What are Oracle database monitoring tools used for?
They help DBAs and developers track Oracle performance metrics like query latency, wait events, and resource usage, ensuring databases stay stable and optimized across on-prem and cloud setups.
2. How does CubeAPM monitor Oracle databases?
CubeAPM uses OpenTelemetry collectors to capture Oracle query performance, I/O, and connection metrics in real time. It correlates these with application and infrastructure data for faster root-cause detection.
3. What should I look for in an Oracle database monitoring tool?
Focus on deep Oracle telemetry (AWR, ASH, SQL plan), lightweight deployment, multi-cloud readiness, and predictable pricing. Tools like CubeAPM excel by combining these in one platform.
4. Are Oracle monitoring tools suitable for hybrid environments?
Yes, especially solutions like CubeAPM that support both on-prem and cloud (OCI, AWS, Azure) Oracle deployments with unified observability and compliance options.
5. How do pricing models differ across Oracle monitoring tools?
Most tools use per-host or per-database licensing, which scales unpredictably. CubeAPM simplifies this with a data-ingestion-based pricing model, $0.15/GB, making it far more cost-efficient as data grows.


