










Platform selection in observability has moved well beyond feature checklists. Engineering teams evaluating tools in 2026 are asking harder questions: Where does telemetry data actually live? What happens to the bill when log volume triples or trace volume spikes during an incident? Does the platform support OpenTelemetry natively, or does switching vendors mean re-instrumenting every service?
This guide compares three platforms that frequently appear together in observability evaluations: New Relic, Splunk Observability Cloud, and CubeAPM. All three cover the core observability signals. Where they differ is in architectural philosophy, MELT signal coverage, pricing mechanics, sampling approach, data retention, and long-term operational fit. The goal is to give engineering teams and platform architects an honest, vendor-neutral basis for evaluation.
Quick Comparison: New Relic vs Splunk Observability Cloud vs CubeAPM
| Dimension | New Relic | Splunk Observability Cloud | CubeAPM |
|---|---|---|---|
| Primary Focus | Full-stack APM and observability, SaaS-first | Unified observability: APM, infrastructure, digital experience monitoring | Unified MELT observability with predictable pricing |
| Deployment | SaaS only | SaaS only (Splunk Cloud) | Self-hosted in customer environment, vendor-managed ops |
| Pricing Model | Ingestion-based + user seats; $0.30/GB (Original Data) or $0.50/GB (Data Plus) plus per-user fees | Host-based tiers: Starter $15/host/month, | Ingestion-based ($0.15/GB); no per-user or per-host fees |
| MELT Coverage | Full MELT | Full MELT | Full MELT |
| OpenTelemetry | Yes | Yes | Fully OTel-native |
| Retention | 8 days default (Original Data); up to 90 days (Data Plus) | 8 days to 13 months depending on tier and data type | Unlimited |
| Sampling | Head-based and tail-based trace sampling | Full-fidelity by default; no sampling applied | Context-aware smart sampling |
| Best For | Developer-centric teams wanting a managed SaaS platform with broad integrations | Enterprise teams needing full-fidelity tracing, real-time streaming | OTel-native teams needing full-stack observability, data ownership, and predictable cost |
How We Evaluated These Platforms
To keep this comparison grounded and reproducible, all three platforms were evaluated against a consistent set of technical and commercial assumptions.
Test Architecture Assumptions
- Kubernetes-based microservices architecture
- JVM and Node.js services with distributed tracing enabled
- Centralized log ingestion from multiple sources (applications, containers, cloud infrastructure)
- 30, 125, and 250 engineer team models
Telemetry Assumptions
- Logs: 250 to 1,500 GB/month (scaled by team size)
- Traces: 20 to 200M spans/month
- Metrics: Standard infrastructure and application metrics
- Retention: 30 to 90 days baseline for cost modelling
This comparison focuses on architectural design and pricing behaviour at scale. It does not evaluate entry-level free-tier experiences in isolation, since the meaningful cost and coverage differences emerge under real production workloads.
Architecture Philosophy
Deployment Model and Data Control
The most structurally important difference between these three platforms is not feature coverage. It is where the data lives and who controls the operational environment.
| Dimension | New Relic | Splunk Observability Cloud | CubeAPM |
|---|---|---|---|
| Deployment | Fully managed SaaS | Fully managed SaaS (Splunk Cloud) | Self-hosted in customer environment; vendor-managed ops |
| Data location | New Relic cloud infrastructure | Splunk cloud infrastructure | Inside customer’s own cloud or on-prem |
| Operational ownership | New Relic manages everything | Splunk manages everything | Vendor manages operations; customer owns data and infra |
| Self-hosted option | No | No | Yes |
| Compliance readiness | Regional data center options; compliance certifications available | Regional deployment options; compliance certifications available | Strong; data never leaves customer boundary; SOC 2 and ISO 27001 certified |
Feature Evaluation
Core Focus
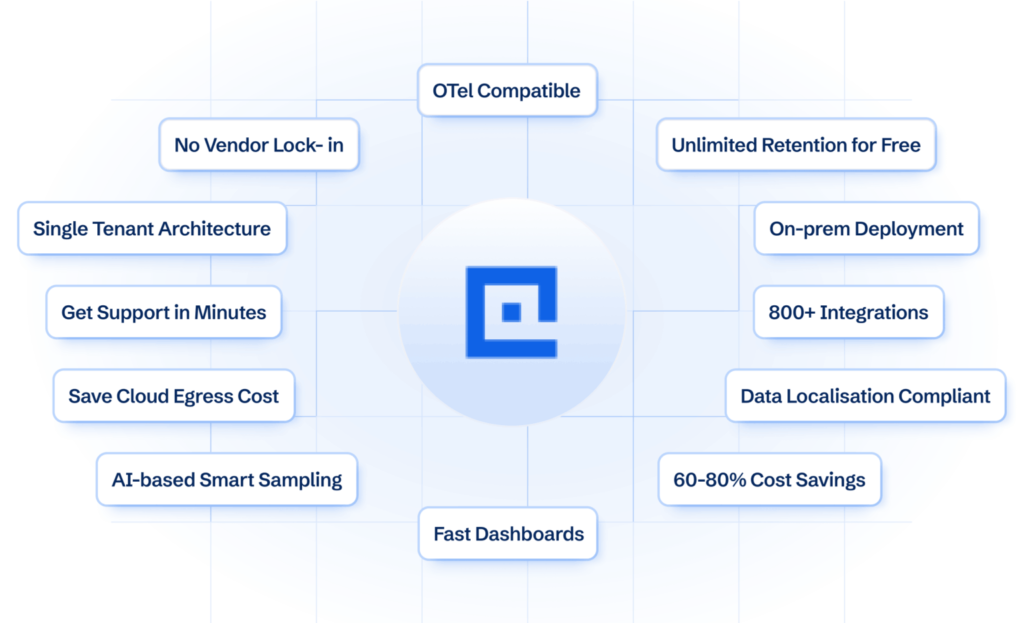
CubeAPM is built for teams that want full-stack observability without giving up control over where their telemetry data lives. Its core strength is bringing metrics, events, logs, and traces together in one OpenTelemetry-native platform running inside the customer’s own cloud or on-premises environment. That makes it a strong fit for teams that care about unified MELT visibility, predictable ingestion-based pricing, and data ownership as systems scale.
New Relic is built for engineering teams that want a fully managed, developer-centric observability platform. Its core strength is combining APM, distributed tracing, infrastructure monitoring, log management, browser and mobile monitoring, and synthetics in a single SaaS interface with a unified query language (NRQL) across all telemetry types.
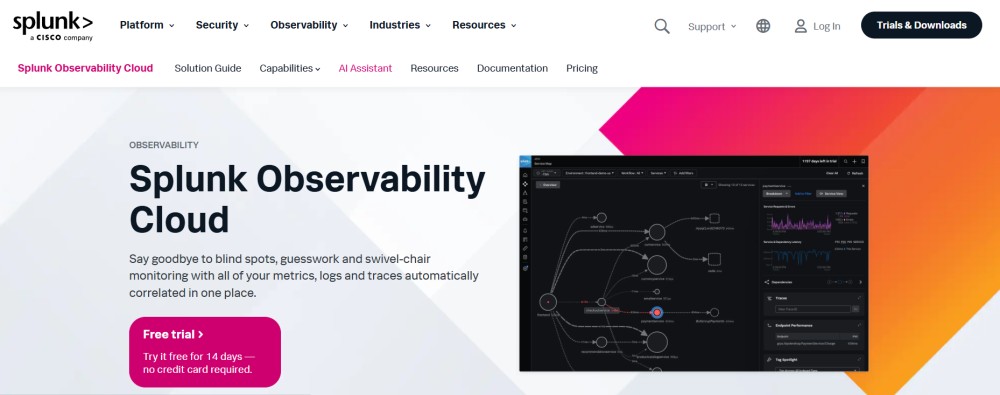
Splunk Observability Cloud is built for enterprise engineering and ITOps teams that need full-fidelity trace retention, real-time streaming telemetry, and tight integration with the broader Splunk data and security ecosystem. Its core strength is full-fidelity APM with no default trace sampling, combined with one-second metrics collection designed for ephemeral Kubernetes environments. Teams that also use Splunk Enterprise Security or the broader Splunk data platform can correlate observability signals with security and business event data in the same ecosystem.
MELT Coverage
CubeAPM provides full MELT coverage across APM with distributed tracing, infrastructure monitoring for Kubernetes and cloud infrastructure, log management, error tracking, RUM, synthetics, and session replay. Its strength is not just collecting all four signals, but letting teams investigate them together inside their own environment without sending data to an external SaaS backend. Smart sampling preserves the highest-signal traces while reducing routine baseline traffic, keeping the total ingestion volume predictable at scale.
New Relic delivers full MELT coverage across metrics, events, logs, and traces. APM with distributed tracing, infrastructure monitoring across unlimited hosts, log management, browser and mobile monitoring, synthetic monitoring, and vulnerability management are all available in a single platform. Its NRQL query language lets teams query across all telemetry types from one interface, without switching between separate tools or dashboards.
Splunk Observability Cloud provides full MELT coverage with a particular strength in full-fidelity tracing and real-time infrastructure monitoring. Its APM includes AI-driven analytics with service maps and trace analytics to guide troubleshooting. Teams have access to all signals from an incident window, which is especially useful for debugging low-frequency or intermittent failures that a fixed-rate sampler would discard. RUM and synthetic monitoring round out the digital experience side of its coverage.
Sampling Strategy
CubeAPM implements context-aware smart sampling natively. The platform automatically prioritises retention of anomalous traces, high-latency spans, and error-path traces, while applying more aggressive sampling to healthy baseline request flows. This means the data most useful for debugging is disproportionately retained, while routine traffic is sampled at a higher ratio. CubeAPM reports that smart sampling reduces effective trace ingestion volume by up to 80 percent in typical deployments, which directly reduces the monthly bill while preserving debugging coverage.
New Relic supports both head-based and tail-based trace sampling. Head-based sampling makes the decision at request start and reduces ingest volume early in the pipeline. Tail-based sampling defers the decision until a full trace is collected, allowing teams to preserve traces that involve errors or high latency more reliably. The choice of strategy affects both debugging coverage and data ingest cost, particularly on the Original Data plan where every GB above the free tier is billed directly.
Splunk Observability Cloud APM is built around full-fidelity, no-sample tracing. By default, it analyzes all traces from instrumented services, which helps teams catch rare errors and incident-window requests that sampled systems might miss.
Real-world debugging scenario: Intermittent API latency spike
A payments service jumps from 90 ms to more than 2 seconds during peak traffic. An alert fires, and the on-call engineer starts investigating.
Using New Relic
The engineer sees the latency spike in the APM response-time chart. Distributed tracing helps identify the slow downstream span, while related logs and database query data can be viewed in context. The workflow is strong, but costs can rise during high-traffic incidents because New Relic bills beyond the free 100 GB/month data threshold.
Using Splunk Observability Cloud
Splunk APM uses full-fidelity tracing, so engineers can inspect slow traces without relying on sampled data. Service maps help locate the degrading dependency, and infrastructure metrics can show whether the affected pod was under pressure. The caveat is retention: raw traces are retained for 8 days unless viewed and covered by extended retention.
Using CubeAPM
CubeAPM’s smart sampling keeps high-latency traces in full detail while sampling healthy traffic more aggressively. Engineers can move from the slow trace to related logs and infrastructure metrics in the same platform. Since CubeAPM runs in the customer’s environment, data stays within the customer boundary, and long-term retention depends mainly on provisioned storage, not SaaS retention tiers.
New Relic vs. Splunk Observability Cloud vs. CubeAPM: Pricing Behavior at Scale
Pricing differences between observability platforms tend to be modest at low volumes and material at scale. Understanding how each model behaves as telemetry grows is essential for total cost of ownership projections.
Modeled Cost Overview
The following estimates use standardised telemetry assumptions scaled by team size, with a 30 to 90 day retention baseline and publicly documented pricing. Actual costs will vary by contract, usage patterns, negotiated discounts, and retention configuration.
| Team Size | New Relic (est.) | Splunk Observability Cloud (est.) | CubeAPM (est.) |
|---|---|---|---|
| ~30 engineers | $3,000–$6,000/month | $1,500–$4,500/month | ~$2,080/month |
| ~125 engineers | $12,000–$25,000/month | $7,500–$22,500/month | ~$7,200/month |
| ~250 engineers | $25,000–$50,000+/month | $15,000–$45,000+/month | ~$15,200/month |
Key Pricing Dynamics to Watch
- New Relic: Charges across two independent variables simultaneously, data ingest volume and billable user type. As team size grows and more engineers need full platform access, per-user costs compound on top of ingest charges. Full platform users on the Standard plan are $99 per user per month (up to five users); the Pro plan lists full platform users at $349 per user per month under annual commitment. For a 20-person team requiring full access, seat costs alone can reach approximately $6,980 per month before any ingest charges are added . A Compute pricing model that removes per-user billing is in Public Preview as of early 2026; teams should confirm availability with their account representative.
Want to model what New Relic would actually cost your team? Our calculator breaks down ingest charges, full platform user seats, and core user costs so you can see the full picture before committing.
Try the New Relic Pricing Calculator- Splunk Observability Cloud: Host-based pricing across three published tiers (Starter $15, Growth $60, Enterprise $75 per host per month) makes cost predictable for stable infrastructure, but host count can change quickly in dynamic Kubernetes environments. The published tiers cover Splunk Observability Cloud only. Broader Splunk platform licensing for log analytics and SIEM uses separate, significantly higher ingest-based pricing and should be modelled independently. Total cost of ownership for full Splunk deployments often runs materially above published licensing once implementation, training, and support are included .
- CubeAPM: Flat per-GB pricing at $0.15/GB with no per-user, per-host, or per-module charges. All platform capabilities including APM, RUM, Synthetics, Infrastructure, Logs, and Traces are included in the single ingestion rate. Context-aware smart sampling reduces effective trace ingestion volume by up to 80 percent, which directly lowers the monthly bill. Because cost scales with data volume rather than seat count, broad platform access across junior engineers, support teams, and product managers adds no additional cost.
Data retention
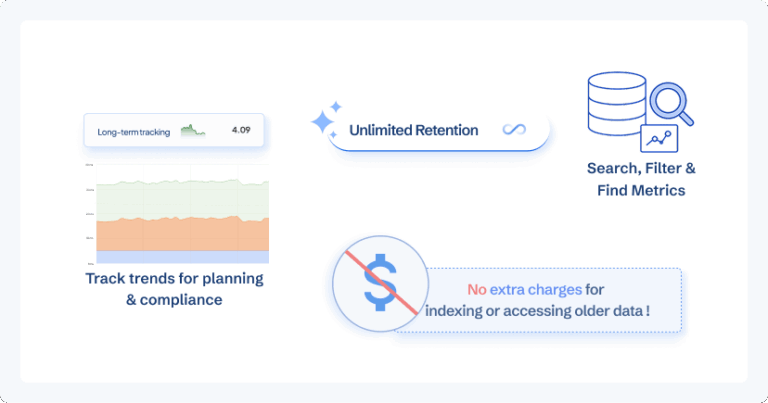
CubeAPM retention is different because data stays in the customer’s own infrastructure. Retention is not capped by a vendor SaaS tier, so teams get unlimited retention. For compliance audits, long debugging windows, or comparing current failures with older baselines, this makes retention an architectural choice rather than a recurring SaaS add-on.
New Relic retention depends on the data type and pricing option. Original Data starts at $0.40/GB, while Data Plus is listed at $0.60/GB and adds longer retention, higher query limits, and enterprise governance features. For logs, New Relic lists 30 days of regular retention on Original Data and 120 days on Data Plus. Live Archives can extend log storage for up to seven years, but it adds separate storage and query-related costs. For teams that need longer lookback windows, New Relic retention is a recurring pricing decision, not a fixed default.
Splunk Observability Cloud retention varies by signal. Raw traces are retained for 8 days, while traces viewed in the Splunk APM UI can be retained for up to 13 months through extended trace retention. Monitoring MetricSets are retained for 13 months, while some troubleshooting data has shorter retention. Teams that need compliance-driven lookback windows beyond these limits may need archival options or the broader Splunk data platform, which can add separate cost and planning work.
CubeAPM retention is different because data stays in the customer’s own infrastructure. Retention is not capped by a vendor SaaS tier, so teams can keep logs, metrics, and traces for 12, 18, or 24 months if they provision enough storage. For compliance audits, long debugging windows, or comparing current failures with older baselines, this makes retention an architectural choice rather than a recurring SaaS add-on.
Best-Fit Scenarios and Trade-offs
CubeAPM
Best for: Engineering teams running Kubernetes-based microservices who need full OpenTelemetry-native observability with stronger data control, predictable ingestion-based pricing, and deployment inside their own cloud or on-premises environment. Especially relevant for teams in regulated industries where telemetry must not leave a defined infrastructure perimeter, and for teams that want unified MELT visibility without moving telemetry to an external SaaS platform.
Strengths: Full MELT coverage including APM, logs, metrics, traces, error tracking, RUM, synthetics, and session replay; fully OTel-native with no proprietary agent required; data remains in the customer environment; vendor-managed operations model; SOC 2 and ISO 27001 certified; unlimited retention with no billing caps; flat $0.15/GB pricing with no per-user or per-host fees; setup in under 60 minutes; context-aware smart sampling reduces ingestion costs by up to 80 percent.
Limitations: Not suited for teams that require a fully off-premises SaaS backend with no infrastructure involvement. Strictly an observability platform; does not support SIEM, cloud security management, or threat detection workflows. Customers must provision and own the underlying infrastructure.
New Relic
Best for: Engineering-led teams that want a fully managed, developer-centric SaaS observability platform with broad out-of-the-box integrations, a unified query language across all telemetry types, and a single interface covering APM, infrastructure, logs, browser, mobile, and synthetic monitoring, and for whom sending telemetry to New Relic’s cloud is acceptable from a compliance standpoint.
Strengths: Full MELT coverage with 780+ integrations; unified NRQL query language across all telemetry types; strong APM with database monitoring and distributed tracing; unlimited hosts and containers included at no additional charge; generous free tier with 100 GB/month; 13 consecutive years as a Gartner Magic Quadrant Leader in observability.
Limitations: All telemetry is sent to New Relic’s cloud, restricting data residency options; full platform user pricing compounds rapidly as team size grows; default retention is 8 days on the base plan; the Compute pricing model that removes per-user billing is still in Public Preview as of early 2026.
Splunk Observability Cloud
Best for: Enterprise engineering and ITOps teams that need full-fidelity tracing without default sampling, real-time streaming metrics designed for Kubernetes and ephemeral environments, AI-driven service map analytics, and tight integration with the broader Splunk ecosystem for security and log analytics alongside observability.
Strengths: Full-fidelity tracing with no default sampling, giving teams access to every trace from any incident window; one-second streaming metrics collection built for ephemeral Kubernetes environments; AI-driven service maps and trace analytics; strong integration with the broader Splunk security and data platform; Gartner Magic Quadrant Leader recognition.
Limitations: Host-based pricing can scale significantly as infrastructure grows; total cost of ownership substantially exceeds published licensing once implementation, training, and support are included; post-Cisco acquisition roadmap uncertainty worth factoring into multi-year decisions; dashboard customisation options cited as a limitation by some users who need highly granular visualisation control.
Decision Framework
Teams evaluating these three platforms typically prioritise one of the following needs. The table below maps common requirements to the most likely architectural fit, along with the key trade-off to evaluate.
| Primary Priority | Likely Best Fit | Key Trade-off to Consider |
|---|---|---|
| Fully managed SaaS with broad integrations | New Relic | All telemetry leaves your environment; user seat pricing compounds as team size grows |
| Full-fidelity tracing with no default sampling | Splunk Observability Cloud | Higher host-based pricing; total cost of ownership substantially exceeds published licensing |
| Full-stack observability with data ownership | CubeAPM | Not suited for off-prem SaaS-only requirements; no built-in SIEM or security management |
| OpenTelemetry-native stack without re-instrumentation | CubeAPM | Customer-hosted deployment model; requires infrastructure the team operates or delegates to CubeAPM |
| Real-time streaming metrics for Kubernetes | Splunk Observability Cloud | Premium host-based pricing; post-Cisco acquisition roadmap uncertainty |
| Predictable billing at scale, no per-user costs | CubeAPM | Not a SIEM platform; no cloud security management module |
| Unified observability plus Splunk security | Splunk full platform | Requires broader Splunk platform licensing beyond Observability Cloud; significantly higher total cost |
| Compliance-ready VPC or on-prem deployment | CubeAPM | Observability only; no SIEM or threat detection capabilities |
| Unlimited log and trace retention without added cost | CubeAPM | Retention bounded by customer-provisioned storage, not a fixed vendor-managed cap |
Conclusion
New Relic, Splunk Observability Cloud, and CubeAPM reflect three different priorities in observability architecture.
New Relic is the strongest fit for developer-centric teams that want a fully managed SaaS platform with broad integrations, a unified query interface across all telemetry types, and minimal operational overhead. The trade-off is that all telemetry flows to New Relic’s cloud, which restricts data residency, and the user-based pricing model can grow significantly as teams scale and more engineers need full platform access.
Splunk Observability Cloud is the strongest fit for enterprise teams that need full-fidelity tracing without default sampling, real-time streaming metrics designed for Kubernetes, and the ability to connect observability signals with the broader Splunk security and data analytics ecosystem. The trade-off is a significantly higher total cost of ownership compared to published pricing, host-based pricing that can change with dynamic infrastructure, and uncertainty around the long-term product roadmap following the Cisco acquisition.
CubeAPM is the strongest fit for teams that want OpenTelemetry-native, full-stack observability with stronger data control, predictable ingestion-based pricing, and deployment inside their own environment. The trade-off is that it is not a SIEM platform, does not support cloud security management workflows, and requires customer-controlled infrastructure, either self-managed or delegated to CubeAPM’s vendor-managed operations model.
In practice, the decision comes down to three things: where your data needs to live, how the pricing model behaves as telemetry volume and team size grow, and whether your primary requirement is full-fidelity traces, unified MELT correlation, or developer-centric SaaS simplicity.
Disclaimer: The information in this article reflects the latest details available at the time of publication and may change as technologies and products evolve. Pricing figures are based on publicly available or documented information as of April 2026.
FAQs
1. What is the main difference between New Relic and Splunk Observability Cloud?
Both cover full-stack observability, but they are built for different buyers and use different pricing models. New Relic is developer-centric and SaaS-first, with usage-based pricing built around data ingest volume and user seat type. Splunk Observability Cloud is enterprise-centric with full-fidelity tracing by default, one-second streaming metrics designed for Kubernetes, and deep integration with the broader Splunk security and data platform. New Relic charges per GB of ingest plus per user; Splunk Observability Cloud charges per monitored host on a tiered basis. The two platforms also take opposite positions on trace sampling: New Relic uses configurable sampling, while Splunk defaults to retaining every trace.
2. Is CubeAPM a replacement for New Relic or Splunk Observability Cloud?
Not as a direct drop-in replacement, but it covers full MELT observability including APM, logs, infrastructure monitoring, error tracking, RUM, synthetics, and session replay inside the customer’s own environment. The main structural difference is deployment model and data ownership. CubeAPM is the stronger fit when data sovereignty, unlimited retention, OTel-native instrumentation, and predictable flat-rate pricing are the priorities. It is not suited for teams that specifically need a vendor-hosted SaaS backend or SIEM and security management capabilities.
3. Does New Relic support OpenTelemetry?
Yes. New Relic supports OTLP ingestion for logs, metrics, and traces via the OpenTelemetry Collector. Teams can instrument with OTel and send data to New Relic without using New Relic’s proprietary agents. However, some advanced features such as CodeStream IDE integration and certain curated APM views work best with New Relic’s own agents. Teams who want full backend portability may encounter some friction depending on how deeply they rely on New Relic-specific instrumentation.
4. Does Splunk Observability Cloud sample traces by default?
No. Splunk Observability Cloud defaults to full-fidelity tracing and retains all traces without applying default sampling. Every trace from an incident window is available for inspection. This is its primary differentiator for debugging intermittent or low-frequency issues that a fixed-rate sampler would discard. Teams can configure sampling to control storage and ingest costs if needed, but the default behaviour is to retain everything.
5. How does OpenTelemetry support compare across these platforms?
CubeAPM is positioned as fully OTel-native, built from the ground up on the OpenTelemetry data model with no proprietary instrumentation layer required. Splunk Observability Cloud is built on OTel standards and supports OTLP ingestion natively. New Relic supports OTLP for logs, metrics, and traces but some advanced features still depend on New Relic’s proprietary agents. Teams who want complete backend portability and the lowest switching cost in the future should give most weight to native OTel design rather than OTLP ingestion support alone.
6. Which platform handles data retention better for compliance use cases?
CubeAPM is the strongest fit for compliance-driven retention requirements. Because data is stored inside the customer’s own infrastructure, retention is bounded only by the storage capacity the customer provisions, not by a SaaS billing tier or vendor-imposed cap. Teams can maintain 12, 18, or 24 months of fully queryable logs and traces at a fraction of the cost of equivalent SaaS retention windows. Splunk Observability Cloud offers 8 days to 13 months depending on the tier, with additional cost for extensions. New Relic defaults to 8 days on the base plan, with Data Plus extending to 90 days and Live Archives available as a paid add-on for longer log storage.
7. How do I migrate from New Relic or Splunk to CubeAPM?
CubeAPM supports ingestion from existing instrumentation via the OpenTelemetry Collector and also accepts telemetry from agents used by Datadog, New Relic, and other platforms, enabling incremental migration without re-instrumenting every workload. Most teams complete migration in under 60 minutes according to CubeAPM. The team provides active onboarding support during the transition