Next.js monitoring tools help teams track Core Web Vitals, detect API route bottlenecks, and ensure seamless SSR performance across distributed environments. However, choosing the right Next.js monitoring tool is difficult for teams due to rising data costs, limited correlation between logs and traces, and vendor-locked telemetry pipelines.
CubeAPM is the best Next.js monitoring tool provider for engineering teams that demand depth, flexibility, and reliability. It delivers OpenTelemetry-native instrumentation, smart sampling, full MELT visibility, and seamless correlation between frontend and backend data for faster debugging. In this guide, we’ll explore the best Next.js monitoring tools based on features, pricing, use cases, and more.
9 Best Next.js Monitoring Tools
- CubeAPM
- New Relic
- Datadog
- Dynatrace
- Sentry
- Sematext
- SigNoz
- AppSignal
- Middleware
What is a Next.js Monitoring Tool?

A Next.js monitoring tool is a performance observability platform that helps developers track, analyze, and optimize every layer of a Next.js application—from React components and API routes to serverless edge functions and backend dependencies. It provides end-to-end visibility across metrics, events, logs, and traces (MELT), allowing engineering teams to pinpoint bottlenecks in rendering, measure user experience through Core Web Vitals, and troubleshoot issues in real time.
Modern businesses rely on Next.js monitoring tools to maintain uptime, ensure fast page loads, and deliver consistent digital experiences across geographies. In an era where even a 100 ms delay can reduce conversion rates by 7 %, performance monitoring directly impacts both customer retention and revenue.
Here’s why such tools are crucial for Next.js-powered teams today:
- Comprehensive visibility: Monitor both SSR (server-side rendering) and CSR (client-side rendering) paths, capturing end-to-end transaction flows.
- User experience tracking: Measure TTFB, LCP, FID, and CLS to optimize user journeys and page responsiveness.
- Error correlation: Link frontend JavaScript exceptions with backend traces to accelerate root-cause analysis.
- Cost and performance efficiency: Identify resource-heavy endpoints, inefficient queries, or misconfigured caching layers that drive up infrastructure costs.
- Data-driven optimization: Use continuous feedback loops from synthetic and real-user monitoring (RUM) to guide deployments and frontend improvements.
Example: Tracking Slow API Routes in a Next.js App with CubeAPM
Consider a SaaS team running a Next.js application where users experience intermittent delays on the /api/orders route. Using CubeAPM, the team sets up OpenTelemetry-based tracing for the API handler and enables real user monitoring (RUM) for the frontend.
Within CubeAPM’s unified dashboard, traces automatically connect the API call latency to downstream PostgreSQL queries and Kubernetes pod metrics. The smart sampling engine highlights slow spans with contextual tags, like latency > 500ms and status: error. At the same time, the log monitoring view shows correlated error logs and stack traces from the API route, and the infrastructure monitoring module reveals high CPU throttling on a specific node.
By combining distributed tracing, synthetic testing, and error tracking, CubeAPM helps developers isolate the performance issue, enabling faster fixes, fewer production outages, and a more consistent user experience across the entire Next.js stack.
Why Teams Choose Different Next.js Monitoring Tools
Choosing a monitoring platform for a Next.js app goes far beyond checking boxes for APM or logs. Teams today need visibility into React Server Components, edge runtimes, and serverless APIs, without losing control over cost, compliance, or data ownership.
Cost Predictability and Scaling Transparency
Many developers cite unpredictable cost escalation as their top pain point when monitoring SSR-heavy Next.js workloads. Every API trace, RUM session, or log event adds up quickly under volume-based pricing. Teams increasingly go for platforms that provide transparent pricing and adaptive sampling, ensuring stable costs as traffic and build complexity grow.
OpenTelemetry-First and Vendor Neutrality
Next.js officially supports OpenTelemetry instrumentation in its App Router architecture, empowering developers to collect consistent traces and metrics across frameworks. Tools that are OpenTelemetry-native allow teams to retain data ownership, integrate with any backend, and avoid vendor lock-in — a key driver for long-term observability strategy.
Deep Correlation: RUM ↔ Traces ↔ Logs ↔ Infra
Next.js apps often span multiple layers, from edge caching and API routes to databases and Node runtimes. Teams increasingly want real-user monitoring (RUM) data correlated with distributed traces and logs, so they can connect slow page interactions to backend performance or infrastructure spikes. This cross-layer visibility accelerates root-cause detection and reduces MTTR.
Next.js-Aware Visibility: RSC, ISR, and Edge Functions
With Next.js 14 and beyond, React Server Components (RSC), Incremental Static Regeneration (ISR), and edge runtimes introduce unique observability needs. Generic APM tools often fail to visualize how rendering flows between the client and server. Developers now prioritize platforms that provide component-level spans, SSR performance tracking, and Edge Function tracing—key for diagnosing latency in hybrid rendering.
Deployment Flexibility and Multi-Cloud Readiness
Next.js projects rarely live in one place. Teams deploy parts on Vercel, others on AWS Lambda, Google Cloud Run, or Kubernetes clusters. That diversity makes multi-cloud monitoring critical. Businesses now prefer tools that seamlessly ingest telemetry from distributed environments, while also supporting on-prem or BYOC deployments for compliance and data localization.
Evolving SEO & UX Metrics Integration
With INP replacing FID in Google’s Core Web Vitals (March 2024), Next.js developers have shifted focus to correlating UX metrics with backend traces. Tools that unify web vitals, API latency, and rendering spans in one view are now favored by marketing and engineering teams alike.
9 Best Next.js Monitoring Tools
1. CubeAPM
Overview
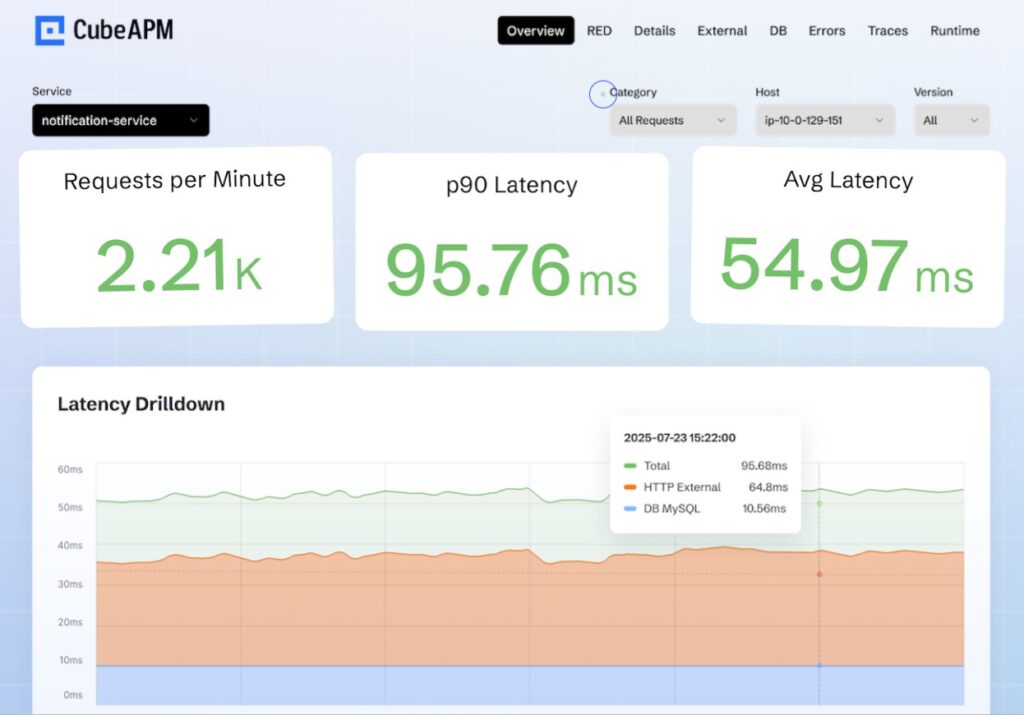
CubeAPM is an OpenTelemetry-native observability platform purpose-built for modern, JavaScript-heavy applications like Next.js. Known for its end-to-end MELT visibility (Metrics, Events, Logs, Traces), it enables teams to monitor SSR, ISR, and API routes seamlessly across frontend and backend layers. With flexible deployment options—SaaS or Bring-Your-Own-Cloud (BYOC)—CubeAPM stands out as a developer-friendly, cost-efficient platform that balances simplicity, scalability, and control, making it ideal for growing engineering teams and enterprise-grade observability at scale.
Key Advantage
Smart Sampling with contextual trace retention — preserves the most valuable traces based on latency, errors, and throughput, ensuring full visibility without excessive data ingestion.
Key Features
- Next.js SSR Trace Mapping: Captures render durations, API calls, and hydration latency across client and server layers.
- Edge & ISR Monitoring: Tracks incremental static regeneration, cache invalidation, and edge function latency.
- Real User Monitoring (RUM): Measures Core Web Vitals (LCP, INP, CLS) and correlates them with backend spans.
- Error Tracking: Automatically logs runtime and API errors with complete trace context.
- OpenTelemetry Integration: Native OTLP ingestion enables consistent, vendor-agnostic instrumentation.
Pros
- Highly cost-effective for large-scale and high-traffic applications
- Unified MELT observability across SSR, ISR, and API layers
- Flexible hosting (SaaS or BYOC) for compliance and data localization
- Strong correlation between frontend performance and backend metrics
- Intuitive dashboards and near real-time trace visualization
Cons
- Not suited for teams seeking fully managed, off-prem-only solutions
- Focused purely on observability and does not include cloud security or posture management features
CubeAPM Pricing at Scale
CubeAPM uses a transparent pricing model of $0.15 per GB ingested. For a mid-sized business generating 45 TB (~45,000 GB) of data per month, the monthly cost would be ~$7,200/month*.
*All pricing comparisons are calculated using standardized Small/Medium/Large team profiles defined in our internal benchmarking sheet, based on fixed log, metrics, trace, and retention assumptions. Actual pricing may vary by usage, region, and plan structure. Please confirm current pricing with each vendor.
Tech Fit
CubeAPM integrates seamlessly with Next.js, Node.js, React, Python, Go, Java, Kubernetes, Docker, and serverless platforms. It’s especially effective for JavaScript-heavy, cloud-native workloads that depend on SSR, API routes, and edge rendering.
2. New Relic
Overview
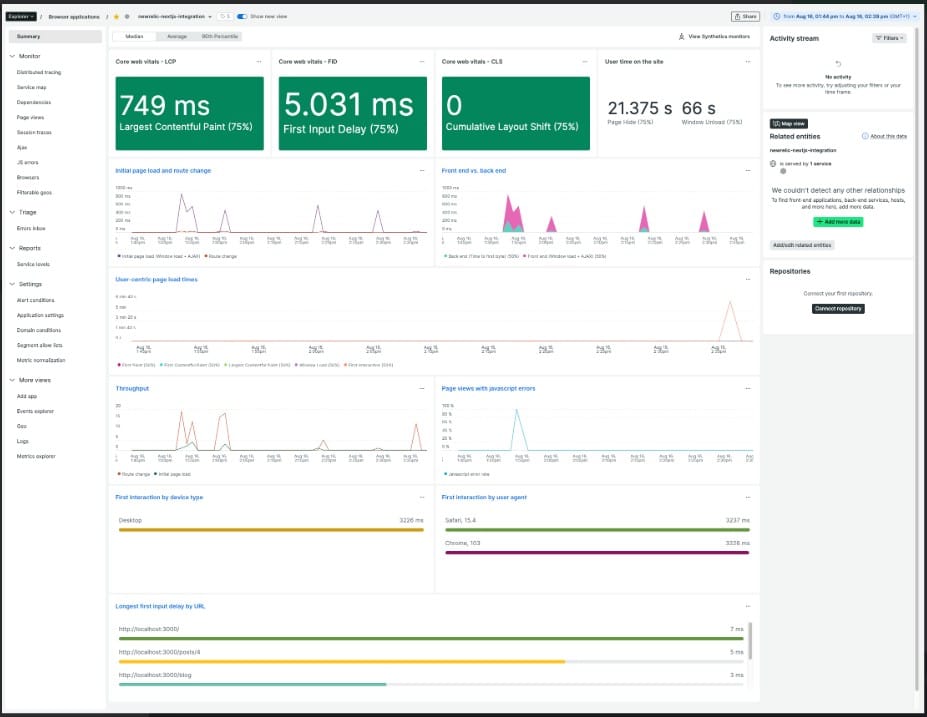
New Relic is a mature, enterprise observability platform with documented guides for Next.js App Router and full-stack monitoring. It combines Browser (RUM) for Core Web Vitals with APM for Node/SSR, letting teams trace user interactions through API routes, server components, and infrastructure. Its Next.js how-to articles show practical setup patterns for capturing client metrics and linking them to backend spans, which helps teams running modern App Router architectures and mixed edge/server deployments.
Key Advantage
Full-stack correlation for Next.js—connect Browser (CWV, route changes, errors) to APM spans for SSR/API routes and drill down to the slow backend hop.
Key Features
- App Router & Browser RUM: Track Core Web Vitals, SPA route changes, page load timing, and JS errors for Next.js frontends.
- SSR & API Tracing: Use Node/APM to instrument server-side handlers and API routes, then link them to frontend sessions.
- Source Maps in Browser: Upload source maps to make production stack traces readable during incidents.
- OpenTelemetry Alignment: Ingest OTel signals for JavaScript/Node services to standardize context across your stack.
- Session Replay (optional): Visualize user flows and correlate with web vitals for faster UX triage.
Pros
- Strong Next.js App Router and Browser (RUM) guidance
- Mature APM + infra coverage with correlation to frontend metrics
- Large ecosystem and dashboards suited to enterprise teams
- Documented source map and session replay workflows
Cons
- Data ingest beyond the free tier billed per GB; total cost can climb with scale
- SaaS-only; no self-hosting deployment
New Relic Pricing at Scale
New Relic’s billing is based on data ingested, user licenses, and optional add-ons. The free tier offers 100 GB of ingest per month, then it costs $0.40 per GB after that. For a business ingesting 45 TB of logs per month, the cost would come around $25,990/month*.
Tech Fit
Well-suited for Next.js teams on App Router that want enterprise-grade Browser + APM correlation, operate across Vercel/AWS/Kubernetes, and value a broad ecosystem with advanced dashboards, OTel ingestion paths, and optional session replay.
3. Datadog

Overview
Datadog is an enterprise observability suite with first-party guidance for Next.js RUM and Node.js APM, giving teams a clear path to monitor App Router or Pages Router frontends and link them to SSR/API spans on the backend. Its Next.js RUM guide covers route-change tracking, Core Web Vitals, and error reporting, while APM instruments server handlers and downstream services—useful for correlating slow user interactions with a specific API call, database query, or edge function.
Key Advantage
First-party Next.js RUM with seamless linkage to APM traces—connects user interactions and Core Web Vitals to the exact backend span causing latency.
Key Features
- Next.js RUM setup: NPM package and snippet to capture SPA route changes, web vitals, and frontend errors.
- RUM ↔ APM correlation: Tie a slow click or route transition to specific API spans and resources for faster root cause.
- Source maps & error detail: Upload sourcemaps for readable stack traces across browser and SSR errors.
- SSR/API instrumentation: APM for Node.js traces server components, handlers, and upstream services.
- Session Replay (add-on): Visualize user journeys alongside vitals and traces for deeper triage.
Pros
- Strong, documented RUM workflow for Next.js
- Mature APM and a large integration ecosystem
- Good correlation from browser metrics to backend spans
- Scales well across multi-service and multi-team environments
Cons
- Pricing spans multiple SKUs and can be expensive at scale
- No self-hosting; only SaaS
Datadog Pricing at Scale
Datadog charges differently for different capabilities. APM starts at $31/month; infra starts at $15/month; logs start at $0.10/GB, and so on. For a mid-sized business ingesting around 45 TB (~45,000 GB) of data per month, the cost would come around $27,475/month*.
Tech Fit
Well-suited for Next.js teams running across Vercel, AWS Lambda, Kubernetes, or hybrid environments who want a broad, enterprise feature set with RUM-to-APM correlation, session replay options, and a large ecosystem of integrations.
4. Dynatrace
Overview
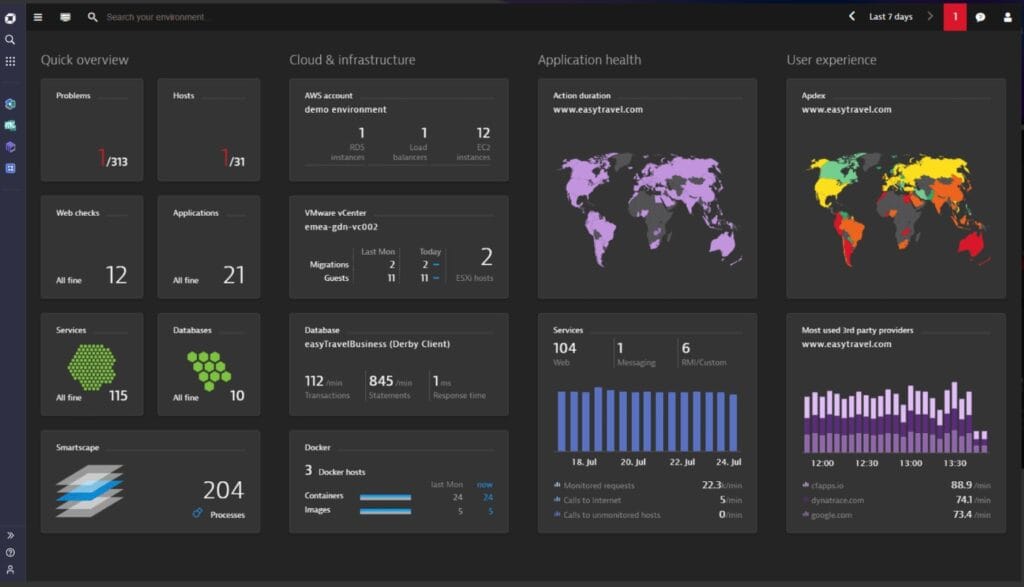
Dynatrace is an enterprise observability platform with robust Digital Experience Monitoring (RUM) and deep backend visibility that Next.js teams can leverage to trace user interactions through SPA route changes, XHR/fetch calls, and into backend services. It supports agentless RUM script injection or OneAgent-based auto-injection, plus a new RUM experience (preview) that emphasizes event-level analytics and richer interaction capture—useful for modern App Router deployments and mixed edge/server architectures.
Key Advantage
SPA/XHR action capture with user-action ↔ distributed-trace linkage—tying route transitions and fetches to the exact backend service when OneAgent or supported server tech is in place.
Key Features
- Agentless RUM for SPAs: Insert Dynatrace’s RUM JS to capture page loads, route changes, and errors in Next.js without server access; OneAgent recommended for full fidelity.
- XHR/Fetch Action Detection: Enable generic SPA support to record user actions triggered by XHR/fetch, improving visibility beyond simple page loads.
- User-action ↔ Trace Correlation: Correlate front-end actions to backend distributed traces across supported technologies and serverless endpoints.
- New RUM Experience (preview): Opt-in event-based model on Grail with auto-captured user interactions and richer analytics apps.
- React.js Hub Guidance: Best practices for React/SPA error prioritization, third-party/CDN impact, and “visually complete” UX metrics.
Pros
- Strong SPA/XHR capture that fits Next.js routing
- Mature end-to-end correlation with Davis AI for root cause
- Flexible injection paths: agentless snippet or OneAgent auto-injection
- Broad ecosystem and enterprise governance tools
Cons
- Pricing spans multiple meters (ingest, retain, query, sessions) that require careful planning
- Steep learning curve
Dynatrace Pricing at Scale
- Full stack: $0.01/8 GiB hour/month or $58/month/8GiB host
- Log Ingest & process: $0.20 per GiB
For a similar 45 TB (~45,000 GB/month) volume, the cost would be $21,850/month*.
Tech Fit
Well-suited for Next.js SPAs on Vercel or custom hosting that need SPA/XHR action capture and enterprise-grade correlation across services; strongest when paired with OneAgent on Node/edge backends and when teams want platform-level analytics (Dashboards, Notebooks, Workflows) on a unified Grail data lake.
5. Sentry
Overview
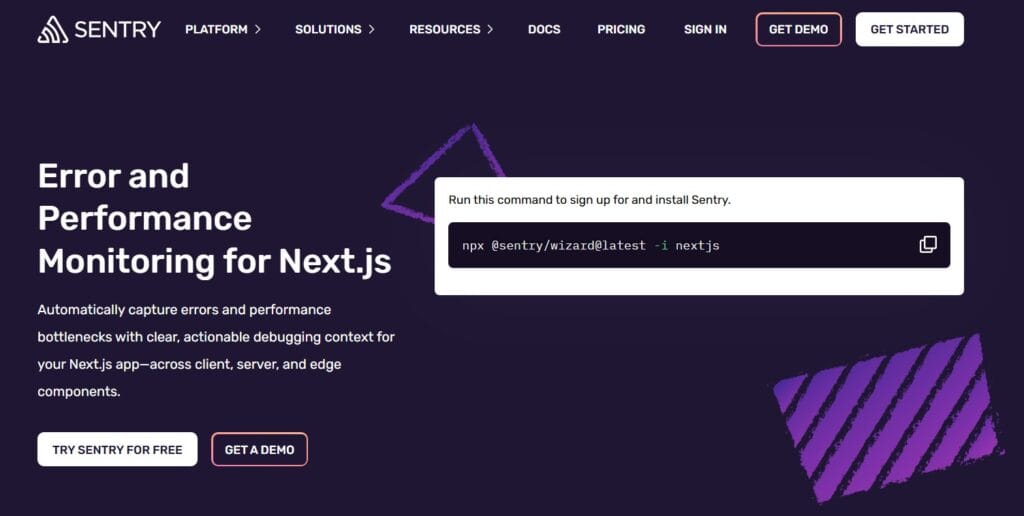
Sentry is a developer-focused platform for error tracking, performance monitoring, and session replay, purpose-built for modern JavaScript frameworks like Next.js. It ships with a dedicated Next.js SDK (@sentry/nextjs) and a one-command setup wizard that automatically configures error tracking, tracing, and source-map uploads. It offers deep integration with the App Router, Pages Router, and API routes, allowing teams to capture performance bottlenecks, exceptions, and frontend issues in a single, unified view. Sentry’s developer-first design makes it a go-to for engineering teams that value fast debugging and seamless CI/CD integration.
Key Advantage
Next.js-native SDK with automatic instrumentation and replay—tracks user interactions, errors, and performance spans across both client and server with minimal setup.
Key Features
- Next.js SDK & Setup Wizard: One-command setup (
npx @sentry/wizard -i nextjs) that auto-configures tracing, release tracking, and source-map management. - Automatic Performance Tracing: Instruments route transitions, API calls, React Server Components, and slow SSR operations.
- Error Tracking: Captures JavaScript and API exceptions with full context, stack traces, and breadcrumbs.
- Session Replay: Records user sessions linked to errors for instant visual reproduction of bugs.
- Release Health & Version Tracking: Monitors deployment health, crash-free sessions, and version-specific performance regressions.
Pros
- Purpose-built Next.js support with minimal manual setup
- Real-time error and performance correlation
- Clear replay-based debugging for frontend and server code
- Strong developer ecosystem with GitHub, Slack, and Vercel integrations
Cons
- Event-based pricing can scale up quickly for high-traffic applications
- Occasional delays in error reporting
Sentry Pricing at Scale
Free up to 5K events/month; Teams: from $26/month; Business: usage-based, with tiers for performance monitoring and session replay, starting from $80/month. For mid-sized teams ingesting 45 TB of data, the cost could be $12,100/month*.
Tech Fit
Best suited for Next.js developers seeking a streamlined, code-level view of performance and errors with integrated replays. Ideal for teams deploying on Vercel, AWS Lambda, or Kubernetes, where quick setup and actionable insights are priorities over infrastructure-level analytics.
6. Sematext

Overview
Sematext is a unified observability platform that brings Experience (RUM), Logs, Tracing, Monitoring, and Synthetics together with a documented Next.js integration. For Next.js teams, it provides a lightweight script for SPA route change tracking, Core Web Vitals, and error capture, plus back-end visibility via logs and tracing. Vercel-friendly setup and a flexible pricing dashboard make it appealing to product teams that want to get RUM and server insights running quickly.
Key Advantage
Next.js Experience integration with SPA route-change tracking—simple <Head> snippet and config to start collecting CWV, page views, and navigations without custom plumbing.
Key Features
- Next.js RUM (Experience): Add the Experience script via the Next.js
<Head>component to capture CWV, page views, and SPA route changes. - Vercel Integration: One-click marketplace path to enable RUM for sites hosted on Vercel with straightforward deployment steps.
- Browser SDK: Open-source SDK to extend front-end metrics, errors, and interaction data in your Next.js app.
- Logs + Tracing Correlation: Ship server logs and spans to link API latency or errors back to user-impacting pages.
- Synthetics & Uptime: Add browser/API monitors to validate critical Next.js routes and journeys from global regions.
Pros
- Clean Next.js and SPA setup with clear route-change guidance
- Unified platform covering RUM, logs, tracing, infra, and synthetics
- Cost calculator and metered plans help right-size per app
- Vercel-friendly integration and quick time to value
Cons
- Multiple meters (page views, log GB, retention, agents, monitors) require careful budgeting
- Occasional downtimes
Sematext Pricing at Scale
Sematext Cloud uses a usage-based pricing model where logs are charged at $0.10 per GB ingested, regardless of plan or retention choice, and storage/pricing depends on daily volume and retention settings you select. Using this official log ingest rate, ingesting 45 TB/month (~45,000 GB) would cost about 45,000 × $0.10 = $4,500/month for logs alone.
In addition, infrastructure/host monitoring starts at low monthly rates per host, and tracing and other modules (Network Map, Experience, Synthetics) have separate starting prices that scale with usage. This usage-based model means total Sematext spend scales with your telemetry volume and retention choices rather than a flat ingestion cap.
Tech Fit
Well-suited for Next.js teams on Vercel, serverless, or containers who want quick RUM enablement plus consolidated logs and tracing in one place; a strong choice when you prefer a SaaS platform with a cost calculator and per-app metering to tailor retention and coverage.
7. SigNoz

Overview
SigNoz is an OpenTelemetry-native observability platform with step-by-step guides for instrumenting Next.js across browser and server. It shows how to wire App/Pages Router tracing, track Core Web Vitals, add structured logging with trace correlation, and run an OTel Collector that forwards telemetry to SigNoz Cloud or a self-hosted cluster—useful for teams standardizing on vendor-neutral pipelines.
Key Advantage
OpenTelemetry-first Next.js monitoring—one pipeline for traces, logs, and web vitals that you can run in the cloud or self-host without changing app code.
Key Features
- Next.js OTel setup: Official guide to instrument route handlers, server components, and API calls, then visualize traces in SigNoz.
- Web Vitals for Next.js: Collect LCP/INP/CLS from real users and chart regressions alongside backend spans.
- Structured logging with correlation: Emit browser/server logs enriched with trace IDs for one-click pivoting from spans to logs.
- Production-grade collector: Use the OpenTelemetry Collector to route data, throttle, or mirror to multiple backends.
- Vendor-neutral pipeline: Keep instrumentation portable; swap backends without rewriting Next.js code.
Pros
- Strong Next.js documentation for OTel traces, Web Vitals, and correlated logging
- Cloud or self-host options for data control and residency
- Usage-based pricing with no host or user licensing
- Good fit for teams standardizing on OpenTelemetry across services
Cons
- Multiple signal types (logs, traces, metrics) still need tuning to manage volume
- Fewer integrations
SigNoz Pricing at Scale
SigNoz Cloud bills logs/traces as per usage; around $0.30 per GB for ingested traces/logs, and $0.10/GB for metrics, plus you may wish to pay extra for add-ons. Using our 45 TB scenario, the cost could be $16,000/month*.
Tech Fit
Best for Next.js teams that want an OTel-standard stack spanning browser, API routes, and server components; works across Vercel, serverless, and Kubernetes with the flexibility to choose SigNoz Cloud or self-host as requirements evolve.
8. AppSignal
Overview
AppSignal is a developer-friendly APM that ships a Next.js integration and an OpenTelemetry ingestion path. For Next.js apps, it records a per-request performance sample with an event timeline that shows document rendering, getServerSideProps (Pages Router), route handler execution, and server-side fetch calls (App Router). Combined with error tracking and uptime checks, AppSignal gives product teams a clear view of SSR and API performance without heavy setup.
Key Advantage
Per-request event timeline for Next.js SSR and APIs — surfaces render, data fetching, and route handler spans out of the box to speed up root-cause analysis.
Key Features
- SSR & API event timeline: Visualizes document render,
getServerSideProps, route handlers, and server-sidefetch, so you can see where time is spent. - Error tracking with source maps: Captures exceptions across client and server, with readable stack traces for faster debugging.
- Web Vitals awareness: Next.js integration and guides to track CWV and surface slow interactions that impact UX.
- OpenTelemetry for Next.js: Send OTel traces/metrics to AppSignal to standardize instrumentation and keep vendor flexibility.
- Uptime monitoring: Global pings for critical Next.js routes and health endpoints, with alerts and simple status pages.
Pros
- Purpose-built Next.js integration with automatic request sampling
- Clear event timeline that maps directly to Next.js render and data-fetch phases
- Simple pricing entry point and relaxed upgrade policy
- OTel ingestion lets you keep instrumentation portable
Cons
- SaaS-hosted only, with no self-host option
- Fewer integrations
AppSignal Pricing at Scale
AppSignal lists APM in USD at approximately $23.25/month (monthly) for 250K requests/month. Logging is a paid add-on with 1 GB included and larger storage buckets available on higher-priced tiers; enterprise add-ons (e.g., HIPAA, SAML SSO, long-term log storage) are billed separately.
For a mid-sized company emitting 45 TB/month of telemetry, the total cost depends on how that 45 TB splits across requests vs. logs and which logging buckets you choose, but at this volume, you’ll move beyond base allowances into larger buckets or enterprise discussions.
Tech Fit
Great for Next.js on Vercel, serverless, or Node/Kubernetes, where teams want request-level timelines, error tracking, and uptime in a single developer-centric UI. Works well if you prefer request-based plans and want the option to instrument via OpenTelemetry without reworking your Next.js code.
9. Middleware
Overview
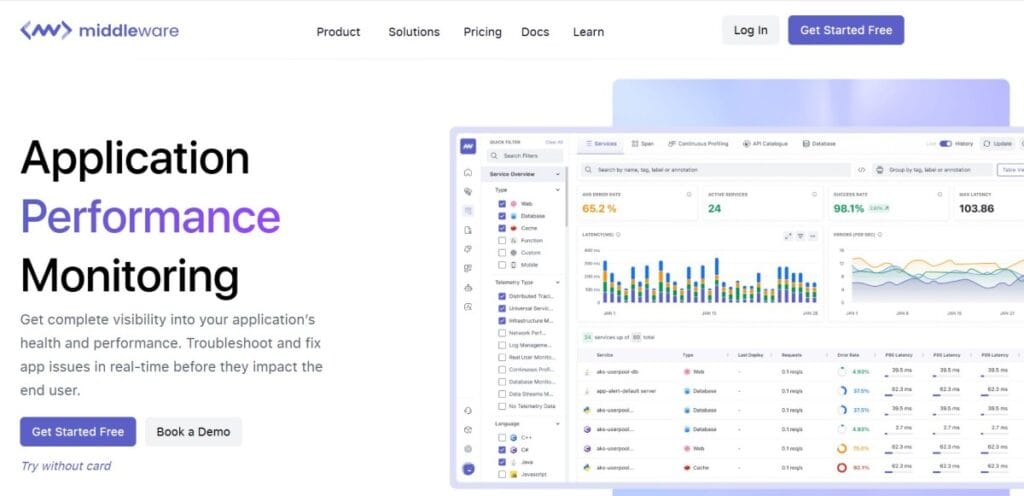
Middleware is a full-stack observability platform with a dedicated Next.js APM SDK and Next.js RUM guides. It focuses on quick framework-level setup—instrumenting route handlers and capturing exceptions—while handling sourcemaps automatically for clearer JS stack traces. For teams standardizing on Next.js 13.4+ and wanting packaged APM + RUM without heavy DIY, Middleware offers concise, framework-aware docs and deployment notes.
Key Advantage
Automated sourcemap handling and exception capture for Next.js—speeding up debugging of server and browser errors with minimal config.
Key Features
- Next.js APM SDK: Add
@middleware.io/agent-apm-nextjsand wire aninstrumentation.tsto trace server actions and capture runtime exceptions. - Automatic Sourcemaps: Webpack plugin uploads browser + server sourcemaps for readable stack traces during production incidents.
- RUM for App & Pages Router: Next.js-specific RUM snippet via
next/scriptfor both routers, capturing browser performance signals. - OTel Alignment & Versioning: Docs specify
@opentelemetry/apiversion bounds for compatibility in Next.js projects. - Dual-ship Options: Send data to Middleware while testing a parallel backend (e.g., Datadog) during migrations.
Pros
- Straightforward Next.js APM and RUM setup with clear docs
- Automated sourcemap upload improves error readability
- Data-volume pricing with free tier and enterprise controls available
- Dual-ship and OTel alignment ease phased migrations
Cons
- Integration and dashboard issues
- Learning curve
- Complex setup
Middleware Pricing at Scale
Pay-as-you-go lists $0.30 per GB for logs, metrics, and traces, with extras like $1 per 1K RUM sessions, $1 per 5K synthetic checks, and $9.99 per 1K browser test runs; free tier includes 100 GB and 1K RUM sessions.
45,000 GB × $0.30/GB = $13,500/month in core ingestion costs. This excludes other usage-based charges like real user monitoring sessions ($1 per 1K), synthetic checks ($1 per 5K), or OpsAI error credits ($1 per error).
Tech Fit
Well-suited to Next.js on Vercel, serverless, or containers where teams want packaged APM + RUM, automated sourcemaps, and OTel-aligned pipelines; works for JavaScript/TypeScript backends and mixed cloud environments.
How to Choose the Right Next.js Monitoring Tool
Choosing the right Next.js monitoring solution means focusing on how well it understands the framework’s rendering model, scaling behavior, and observability depth.
Native Instrumentation and OpenTelemetry Support
The ideal tool should integrate natively with the Next.js App Router, React Server Components, and the framework’s built-in OpenTelemetry hooks. This ensures zero-friction setup, unified span context, and future compatibility without vendor lock-in.
Context-Aware Sampling for Scalable Monitoring
Next.js APIs and SSR functions often experience sudden load bursts. A strong platform uses smart or adaptive sampling that retains traces for error or latency outliers, ensuring diagnostic accuracy without overwhelming storage or costs.
End-to-End Correlation Across Frontend and Backend
For hybrid rendering frameworks, correlating RUM metrics (like INP, LCP) with backend traces and logs is non-negotiable. Tools that connect user interactions to the originating API or database span help teams pinpoint slow paths instantly.
Deep Visibility into SSR, ISR, and Edge Runtimes
Next.js workloads rely on multiple rendering modes—SSR for personalization, ISR for cached content, and edge functions for geo latency control. The right monitoring tool must visualize span lifecycles across these runtimes for full execution clarity.
Multi-Environment Compatibility and Data Control
Enterprises often deploy parts of their Next.js stack on Vercel, others on AWS Lambda or Kubernetes. Choose platforms that handle telemetry across these environments seamlessly, while offering BYOC or on-prem options for compliance.
Operational Maturity and Actionable Dashboards
Beyond data collection, the platform should deliver Next.js-aware dashboards—showing route performance, hydration time, API latency, and errors—alongside automated alerts and SLO tracking to enable proactive performance management.
Conclusion
Choosing the right Next.js monitoring tool can be overwhelming—teams often struggle with unpredictable pricing, complex setup, and fragmented visibility across SSR, API routes, and user experience. Without unified observability, diagnosing latency, tracing user actions, or managing errors across distributed environments becomes difficult.
CubeAPM solves these challenges with its OpenTelemetry-native platform, seamless Next.js integration, and unified MELT visibility (Metrics, Events, Logs, Traces). It correlates frontend performance with backend behavior, empowering teams to optimize rendering, resolve API slowdowns, and enhance overall reliability.
If you’re scaling Next.js applications and want deeper insights without breaking your budget, start monitoring with CubeAPM.
Schedule a FREE demo to explore CubeAPM.
Disclaimer: The information in this article reflects the latest details available at the time of publication and may change as technologies and products evolve.
FAQs
1. What are the key metrics to monitor in a Next.js application?
Essential metrics include TTFB (Time to First Byte), LCP (Largest Contentful Paint), INP (Interaction to Next Paint), API latency, and server response time. Monitoring these ensures both frontend performance and backend efficiency are optimized.
2. How do Next.js monitoring tools help improve Core Web Vitals?
These tools track user interactions and rendering timelines in real time. By identifying slow components or blocking scripts, developers can optimize hydration speed and reduce layout shifts.
3. Can CubeAPM monitor both frontend and backend performance in Next.js?
Yes. CubeAPM provides full-stack visibility by combining RUM metrics, APM traces, and logs across client and server components, making it ideal for SSR and API route monitoring.
4. Is it possible to self-host a Next.js monitoring platform?
Yes, some OpenTelemetry-native tools like CubeAPM offer BYOC or self-hosting options. This ensures data residency compliance and greater control over security and retention.
5. What’s the most cost-effective way to monitor a large Next.js application?
Look for a transparent, usage-based model like CubeAPM, which charges $0.15 per GB ingested—no hidden fees or host-based billing. It keeps costs predictable, even as data scales into terabytes.


