










Neo4j’s graph database architecture creates unique monitoring challenges that traditional relational database tools miss entirely. A slow Cypher query or memory leak in a traversal algorithm can quietly degrade user experience for hours before cluster health metrics surface the problem. According to the CNCF Annual Survey 2024, 67% of organizations using graph databases report that generic database monitoring tools fail to capture graph-specific performance bottlenecks like relationship traversal depth and pattern matching efficiency.
This guide compares 9 Neo4j monitoring tools across open source options, enterprise platforms, and specialized graph database solutions. Each is evaluated on metrics coverage (Cypher query performance, cluster health, memory allocation), deployment model (self-hosted vs. SaaS), and total cost of ownership for teams at every scale.
Quick Comparison: 9 Neo4j Monitoring Tools at a Glance
| Tool | Best For | Pricing | Free Plan | Deployment |
|---|---|---|---|---|
| CubeAPM | Full stack observability with Neo4j metrics | $0.20/GB ingested | No | Self hosted |
| Halin | Real-time Neo4j cluster monitoring | Free (open source) | Yes | Self hosted |
| Prometheus + Neo4j Exporter | Teams already using Prometheus | Free (open source) | Yes | Self hosted |
| Grafana + Neo4j Plugin | Custom Neo4j dashboards | Free OSS / Grafana Cloud from $49/mo | Yes | Self-hosted + SaaS |
| Datadog | Multi-cloud with 700+ integrations | From $15/host/month | 14-day trial | SaaS only |
| Dynatrace | Enterprise AI-assisted analysis | Custom pricing | 15-day trial | SaaS + hybrid |
| New Relic | Managed observability platform | From $0.40/GB beyond 100GB free | Limited free tier | SaaS only |
| Neo4j Ops Manager | Official Neo4j Enterprise tool | Included with Enterprise license | No | Self hosted |
| AppDynamics | Cisco-heavy enterprises | From $50/vCPU core/month | 15-day trial | SaaS + on-prem |
1. CubeAPM

CubeAPM is a self-hosted, OpenTelemetry native observability platform that monitors Neo4j clusters alongside your entire application stack in one unified view. It tracks Cypher query performance, cluster health, and infrastructure metrics while correlating them with application traces and logs.
Key Features:
- Native Neo4j metrics collection via Prometheus exporters and OpenTelemetry
- Real-time Cypher query performance tracking with execution plan visualization
- Cluster health monitoring covering memory allocation, GC pressure, and replication lag
- Automatic correlation between Neo4j metrics and application traces
- Unlimited data retention with predictable per GB pricing
Pricing: $0.20/GB ingested. For a 50-node Neo4j cluster generating 2TB monthly telemetry (metrics + logs + traces), total cost is $400/month with unlimited retention and no per-host fees.
Pros:
- Full data control with self-hosted deployment inside your VPC
- Correlates Neo4j performance with application behavior automatically
- Predictable pricing with no surprise overages
- Fast setup using existing Prometheus exporters
Cons:
- Requires infrastructure management (though CubeAPM handles platform updates)
- Smaller integration ecosystem than enterprise SaaS platforms
- Limited pre-built Neo4j-specific dashboards compared to specialized tools
Best for: Teams running Neo4j as part of a larger microservices stack who need unified observability without sending graph data to external SaaS platforms.
2. Halin
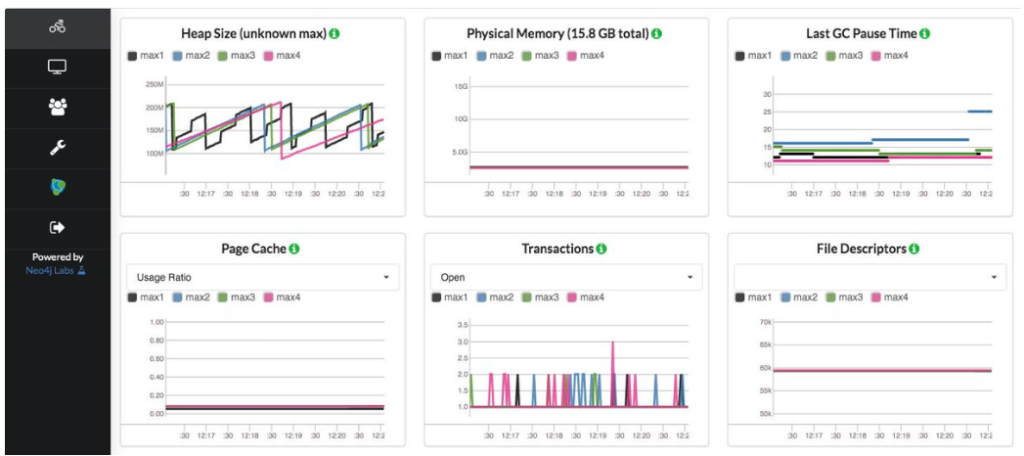
Halin is an open-source monitoring dashboard built specifically for Neo4j databases and clusters. It provides real-time insights into query performance, cluster topology, and resource utilization through a browser-based interface.
Key Features:
- Real time Neo4j cluster monitoring dashboard
- Cypher query execution tracking with slow query identification
- Memory and GC metrics visualization
- Diagnostic advisor for common Neo4j configuration issues
- Built-in cluster topology visualization
Pricing: Free and open source. Requires only Neo4j Enterprise Edition for cluster monitoring features.
Pros:
- Purpose-built for Neo4j with deep graph database insights
- Zero cost for teams already on Neo4j Enterprise
- No external dependencies or data egress
- Active community support and documentation
Cons:
- Limited to Neo4j monitoring only, no broader observability
- Lacks long term data retention capabilities
- No built-in alerting system (requires external integration)
- Development activity has slowed since 2022
Best for: Neo4j Enterprise teams who need dedicated graph database monitoring without paying for additional tooling or sending data outside their infrastructure.
Note: Halin has been graduated to Neo4j Operations Manager, and the labs project has been discontinued. Users are requested to move their operations to Neo4j Operations Manager.
3. Prometheus + Neo4j Metrics Exporter
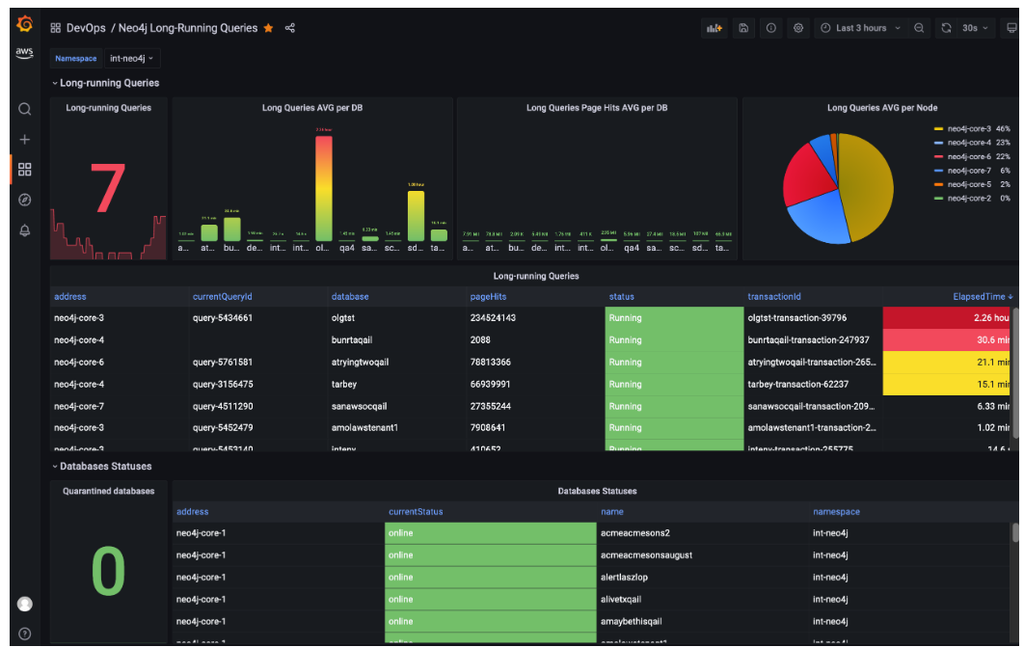
Prometheus combined with the Neo4j Metrics Exporter provides comprehensive time series monitoring for Neo4j clusters. The exporter surfaces Neo4j internal metrics in Prometheus format, enabling teams to track database performance alongside infrastructure monitoring metrics.
Key Features:
- Full Neo4j metrics collection via official metrics exporter
- Time series data storage with configurable retention
- PromQL query language for flexible metric analysis
- Native integration with Grafana for visualization
- Alertmanager for threshold-based notifications
Pricing: Free and open source. Infrastructure costs depend on data volume and retention period.
Pros:
- Complete control over data and infrastructure
- Large ecosystem of integrations and community dashboards
- Powerful query language for complex metric analysis
- Battle-tested at scale by major tech companies
Cons:
- Steep learning curve for teams new to Prometheus
- Requires significant operational overhead for setup and maintenance
- No built-in support for logs or distributed traces
- Storage costs grow linearly with retention period
Best for: Engineering teams already using Prometheus who want to add Neo4j monitoring to their existing observability stack.
4. Grafana + Neo4j Plugin
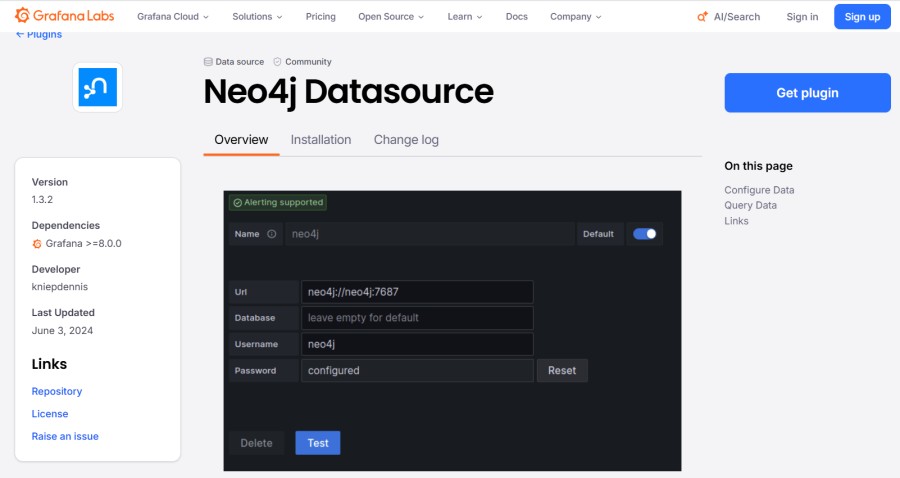
Grafana is an open-source visualization platform that connects to Neo4j as a data source through community plugins. It enables teams to build custom dashboards combining Neo4j metrics with other telemetry sources.
Key Features:
- Custom Neo4j dashboard creation with a drag-and-drop interface
- Multiple data source support (Neo4j + Prometheus + logs in one view)
- Pre-built community dashboards for common Neo4j use cases
- Alert rules with notification routing to Slack, PagerDuty, email
- Grafana Cloud option for managed hosting
Pricing: Free for self-hosted OSS deployment. Grafana Cloud starts at $49/month for the Pro plan with 10K active series. Enterprise pricing available on request.
Pros:
- Highly customizable dashboard experience
- Combines Neo4j data with other monitoring sources seamlessly
- Large plugin ecosystem for additional data sources
- Active development and strong community support
Cons:
- Requires separate data collection layer (Prometheus, InfluxDB)
- Dashboard creation demands time investment upfront
- No native Neo4j query execution plan visualization
- Alert configuration can be complex for multi-source dashboards
Best for: Teams that want flexible, customizable Neo4j monitoring integrated with their existing Grafana observability stack.
5. Datadog
Datadog is a cloud-based observability platform with 1,000+ integrations, including Neo4j monitoring through its Prometheus integration. It provides managed infrastructure, application, and database monitoring in one unified view.
Key Features:
- Neo4j monitoring via Prometheus OpenMetrics integration
- Pre-built Neo4j dashboard templates
- APM correlation linking database queries to application traces
- Anomaly detection with machine learning
- Alert routing to 400+ notification channels
Pricing: Infrastructure monitoring starts at $15/host/month. APM adds $31/host/month. A 50-host Neo4j cluster with APM costs approximately $2,300/month before logs, custom metrics, or network performance monitoring.
Pros:
- Managed service with no infrastructure overhead
- Correlates Neo4j metrics with full stack telemetry automatically
- Strong mobile app for on-the-go monitoring
- Extensive integration catalog
Cons:
- Per-host pricing multiplies quickly in large Neo4j clusters
- Limited Neo4j-specific query optimization features
- Data egress costs not included in advertised pricing
- Vendor lock-in through proprietary query language
Best for: Enterprise teams with large budgets who want comprehensive managed observability across their entire multi cloud infrastructure.
6. Dynatrace

Dynatrace is an enterprise observability platform using AI to automatically map dependencies and detect anomalies across applications, infrastructure, and databases, including Neo4j.
Key Features:
- Automatic discovery and mapping of Neo4j cluster topology
- AI-powered root cause analysis for performance issues
- Full stack monitoring from user experience to database queries
- Davis AI assistant for natural language queries
- Business analytics tying Neo4j performance to revenue metrics
Pricing: Custom enterprise pricing typically starting around $0.08/host/hour for infrastructure monitoring plus application monitoring add-ons. Annual contracts are common with a minimum commitment.
Pros:
- Powerful AI-driven anomaly detection reduces alert noise
- Automatic dependency mapping shows how Neo4j impacts services
- Strong enterprise support and account management
- Unified platform eliminates tool sprawl
Cons:
- Complex pricing model makes cost forecasting difficult
- Heavy initial setup and tuning investment required
- Limited Neo4j-specific graph traversal metrics
- Overkill for smaller teams or simpler monitoring needs
Best for: Large enterprises running mission-critical Neo4j deployments who need AI-assisted root cause analysis and can justify premium pricing.
7. New Relic

New Relic is a managed observability platform providing full-stack monitoring, including database performance tracking through its infrastructure and APM modules.
Key Features:
- Neo4j monitoring via Prometheus integration or custom instrumentation
- Distributed tracing linking application requests to Neo4j queries
- NRQL query language for flexible metric analysis
- Alerting with anomaly detection and incident intelligence
- Pre-built quickstart dashboards for common databases
Pricing: Data ingestion-based pricing at $0.40/GB beyond the 100GB free tier. User seats range from $49 to $99/user/month depending on plan. A 50-node Neo4j cluster generating 2TB monthly telemetry costs approximately $840/month (data only) before user seats.
Pros:
- Unified platform covering full-stack observability
- Strong developer community and documentation
- Mobile app for monitoring on the go
- Generous free tier for small projects
Cons:
- Per-seat pricing compounds fast as teams grow
- NRQL lock-in makes dashboards non-portable
- Limited Neo4j-specific query optimization insights
- Cloud-only architecture unsuitable for data residency requirements
Best for: Teams already invested in New Relic who want to add Neo4j database monitoring to their existing observability stack.
8. Neo4j Ops Manager
Neo4j Ops Manager is the official enterprise monitoring and management tool for Neo4j clusters. It provides centralized administration, monitoring, and automation for multi-cluster Neo4j deployments.
Key Features:
- Official Neo4j tool with deep integration
- Centralized cluster management and health monitoring
- Automated backup scheduling and disaster recovery
- User management and security policy enforcement
- Query performance monitoring with execution plan analysis
Pricing: Included with the Neo4j Enterprise Edition license. Enterprise Edition pricing starts at approximately $180,000 annually for unlimited CPU cores.
Pros:
- Purpose-built for Neo4j by the Neo4j team
- Deep integration with all Neo4j features and versions
- Comprehensive cluster administration beyond just monitoring
- Official support backed by Neo4j engineers
Cons:
- Requires Neo4j Enterprise Edition (significant cost barrier)
- Limited integration with broader observability tools
- Monitoring scope restricted to Neo4j only
- No application trace correlation capabilities
Best for: Large enterprises already committed to Neo4j Enterprise who need official tooling with vendor support guarantees.
9. AppDynamics
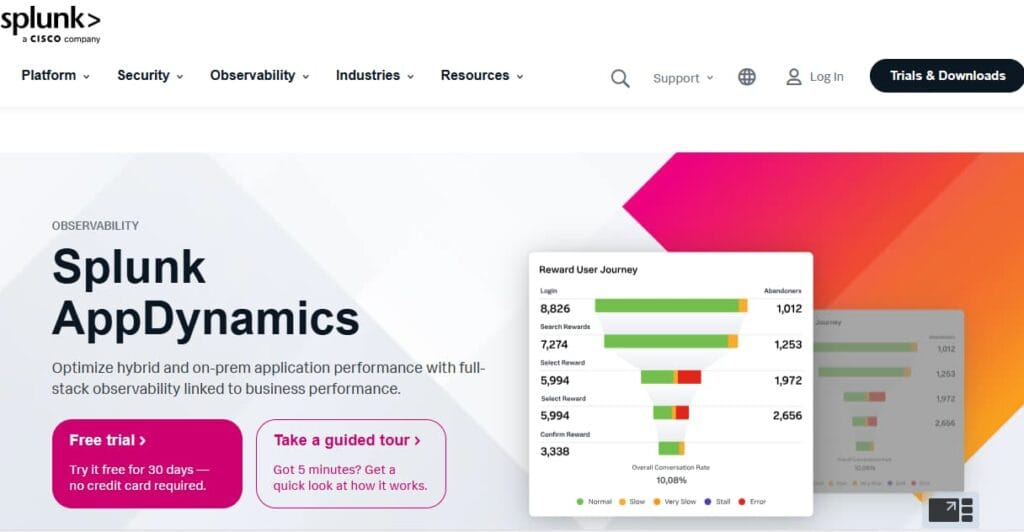
AppDynamics is a Cisco-owned application performance management platform that monitors business transactions end-to-end, including database tier performance.
Key Features:
- Business transaction monitoring from user to database
- Database performance tracking including Neo4j queries
- Automatic baseline creation and anomaly detection
- Root cause analysis linking slow transactions to database queries
- Business metrics dashboard tying performance to revenue impact
Pricing: Custom enterprise pricing typically starting at $50/vCPU core/month. Annual contracts with minimum commitment common. Pricing verification required directly with vendor.
Pros:
- Strong business context linking Neo4j performance to revenue
- Deep application transaction tracing
- Good for organizations already using Cisco infrastructure
- Mature platform with extensive enterprise features
Cons:
- Complex and expensive pricing model
- Heavy resource consumption in monitored environments
- Limited Neo4j-specific graph database insights
- Overkill for teams focused primarily on database performance
Best for: Large Cisco-centric enterprises needing business-focused APM that includes database monitoring as part of transaction tracking.
How to Choose the Right Neo4j Monitoring Tool
Selecting a Neo4j monitoring tool depends on your cluster size, budget, existing observability stack, and data residency requirements. This framework breaks down the decision by team profile.
For teams under 20 engineers with limited budget: Start with Halin or Prometheus + Grafana. Both provide comprehensive Neo4j monitoring at zero software cost. Halin offers faster setup with Neo4j-specific insights out of the box. Prometheus + Grafana requires more initial configuration but scales better as you add other services to monitor.
For mid size teams (20-100 engineers) with existing Prometheus infrastructure: Stick with Prometheus + Neo4j Exporter and add Grafana for visualization. You already have the collection infrastructure and operational knowledge. Adding Neo4j monitoring requires only deploying the exporter and importing community dashboards. Total incremental cost is infrastructure only, typically under $200/month for 50 nodes.
For teams with data residency or compliance requirements: CubeAPM or self-hosted Prometheus + Grafana are the only viable options. Both keep all telemetry data inside your infrastructure. CubeAPM adds unified observability across logs, traces, and metrics with managed platform updates. Prometheus + Grafana gives you full control but requires operational investment.
For enterprise teams with large budgets prioritizing managed services: Datadog or Dynatrace provide comprehensive managed observability with Neo4j support. Datadog offers a broader integration ecosystem and simpler pricing. Dynatrace provides stronger AI-assisted root cause analysis but at a premium cost. Both require accepting data egress and vendor lock-in.
For Neo4j Enterprise customers needing official tooling: Neo4j Ops Manager is included with your license and provides the deepest Neo4j-specific features. Use it for cluster administration and add a broader observability platform (CubeAPM, Datadog, or Prometheus) for correlating Neo4j performance with application behavior.
Three questions that eliminate 80% of options:
- Do you have data residency requirements or regulatory constraints preventing external SaaS? If yes, you need self-hosted tools: CubeAPM, Halin, Prometheus, or Grafana. This rules out Datadog, New Relic, and Dynatrace cloud offerings.
- Are you monitoring Neo4j in isolation or as part of a larger application stack? If part of a larger stack, unified observability platforms (CubeAPM, Datadog, New Relic, Dynatrace) provide better value than Neo4j-specific tools.
- What is your monthly budget per host? Under $10/host: open source only (Halin, Prometheus, Grafana). $10-30/host: CubeAPM or Grafana Cloud. Over $30/host: enterprise SaaS platforms (Datadog, Dynatrace, New Relic).
Cost Comparison: Real Pricing for a 50-Node Neo4j Cluster
This scenario models a production Neo4j cluster with 50 nodes generating 2TB monthly telemetry (1TB metrics, 600GB logs, 400GB traces) with 30-day retention. Pricing reflects publicly available rate cards as of April 2026.
CubeAPM: $400/month
- $0.20/GB × 2,000GB = $400
- Includes unlimited users, unlimited retention, all features
- Infrastructure cost: approximately $200/month for self-hosted deployment
- Total monthly cost: $600
Halin + Prometheus + Grafana (self hosted): $0/month software
- Software cost: $0 (all open source)
- Infrastructure cost: approximately $300/month for Prometheus storage and Grafana hosting
- Operational overhead: 10-15 hours/month for maintenance and updates
- Total monthly cost: $300 + engineer time
Datadog: $2,300/month
- Infrastructure monitoring: $15/host × 50 = $750
- APM: $31/host × 50 = $1,550
- Does not include logs ($0.10/GB ingest + $1.70/million events indexed)
- Data egress fees: approximately $60/month
- Total monthly cost: $2,360 before logs
Grafana Cloud: $500/month
- Pro plan for 50K active series: $400/month
- Additional series and logs charged separately
- Does not include metrics collection (requires separate Prometheus or agent deployment)
- Total monthly cost: $500-800 depending on usage
New Relic: $1,040/month
- Data ingestion: $0.40/GB × 2,000GB = $800
- Assumes using the free tier for the first 100GB
- User seats: $49/user/month × 5 full platform users = $245
- Total monthly cost: $1,045 before additional features
This estimate models a production-ready Neo4j cluster with comprehensive monitoring. Smaller deployments or basic monitoring will cost significantly less. Pricing is based on publicly available information as of April 2026.
Understanding Neo4j-Specific Metrics That Generic Monitoring Misses
Generic database monitoring tools track CPU, memory, and query counts. Neo4j graph databases require monitoring relationship traversal depth, pattern matching efficiency, and cluster consensus health that traditional tools ignore.
Cypher query execution plans: Unlike SQL explain plans, Cypher execution plans show how the query traverses relationships through the graph. A poorly optimized traversal can touch millions of nodes unnecessarily. Tools like Halin and Neo4j Ops Manager surface execution plan statistics. Generic tools see only query duration without the graph context needed to optimize it.
Heap memory allocation patterns: Neo4j uses off-heap page cache for graph storage and heap memory for query execution. Monitoring only total JVM heap misses the critical page cache hit ratio that determines read performance. Prometheus with the Neo4j exporter surfaces these metrics. Most APM tools report only generic JVM heap stats.
Cluster consensus and replication lag: Neo4j clusters use Raft consensus for write coordination. Replication lag between leader and followers causes stale reads. Infrastructure monitoring platforms that understand distributed systems track these metrics. Generic database monitors show only node health without cluster topology awareness.
Transaction lock contention: Graph databases experience unique lock patterns during concurrent writes affecting the same subgraph. High lock wait times indicate schema design issues or write hotspots. Neo4j-specific tools like Ops Manager surface these metrics. Generic monitors show only generic lock counts without graph context.
Store file health and index fragmentation: Neo4j stores graph data in multiple store files (nodes, relationships, properties) with separate indexes. Fragmentation in any store file degrades performance across all queries. Neo4j exporters expose these internal metrics. Standard database monitors miss them entirely.
This is why teams monitoring Neo4j seriously either use Neo4j-specific tools (Halin, Ops Manager) or extensible platforms (CubeAPM, Prometheus + Grafana) that can collect Neo4j internal metrics through exporters.
Frequently Asked Questions
What metrics should I monitor for Neo4j in production?
Track Cypher query execution time (p95 and p99 latency), page cache hit ratio (target above 98%), heap memory usage (alert when over 80% utilized), GC pause frequency and duration, cluster replication lag (target under 1 second), and transaction throughput. These cover the critical signals that predict Neo4j performance issues before they affect users.
Can I use Prometheus to monitor Neo4j clusters?
Yes, Neo4j provides an official Prometheus exporter that surfaces internal database metrics in Prometheus format. Deploy the exporter as a sidecar container or separate service, configure Prometheus to scrape the metrics endpoint, and use Grafana to visualize the data. This setup works well for teams already using Prometheus for infrastructure monitoring.
Do I need Neo4j Enterprise Edition for monitoring?
No, Community Edition supports basic metrics collection through JMX and Prometheus exporters. Enterprise Edition adds cluster monitoring features, detailed query metrics, and support for tools like Ops Manager. For single-node deployments, Community Edition provides sufficient monitoring capabilities through open-source tools.
How does CubeAPM monitor Neo4j compared to Datadog?
CubeAPM collects Neo4j metrics through Prometheus exporters or OpenTelemetry, storing all data in your infrastructure with unlimited retention at $0.20/GB flat rate. Datadog also uses Prometheus integration but sends data to their SaaS platform at per-host pricing starting at $15/host/month for infrastructure monitoring plus $31/host/month for APM. CubeAPM typically costs up to 50% less for the same visibility while keeping data under your control.
What is the difference between Halin and Neo4j Ops Manager?
Halin is an open-source monitoring dashboard focused on real-time cluster health visualization. It runs in your browser and connects directly to your Neo4j cluster. Neo4j Ops Manager is the official enterprise tool providing centralized administration, backup automation, and monitoring across multiple clusters. Ops Manager requires Enterprise Edition, while Halin works with any Neo4j edition.
Can I monitor Neo4j query performance without enabling query logging?
Yes, Neo4j exposes query metrics through JMX and Prometheus exporters without requiring query logging. These metrics include query count, execution time statistics, and memory allocation per query type. For detailed per-query analysis, including execution plans, enable query logging and analyze logs with tools like CubeAPM log management or the ELK stack.
How much does it cost to run Prometheus and Grafana for Neo4j monitoring?
Software cost is zero (both are open source). Infrastructure cost depends on data volume and retention. For a 50-node Neo4j cluster with 30-day retention, expect approximately $200-400/month in cloud compute and storage costs. Add 10-15 hours/month of engineer time for initial setup, maintenance, and dashboard creation. Managed Grafana Cloud reduces operational burden at $49-400/month depending on scale.
Disclaimer: The information in this article reflects the latest details available at the time of publication and may change as technologies and products evolve. Features, pricing, and plan limits can change over time. Always verify the latest information directly with the vendor before making purchasing or deployment decisions.