










Developer observability has shifted from a nice-to-have to a production requirement. As systems grow more distributed with microservices, Kubernetes clusters, and serverless functions, the traditional monitoring approach of tracking uptime and basic metrics no longer suffices. According to the CNCF 2025 Annual Survey, 87% of organizations now use logs, 57% use traces, and the average company deploys eight different observability technologies to maintain visibility across their stack.
This guide compares 10 developer observability platforms on pricing transparency, deployment model, OpenTelemetry support, and signal depth. Each platform is evaluated on what it actually costs at scale, where it excels, and what teams discover only after using it in production. Real cost scenarios are built for small, mid-market, and enterprise teams.
| Tool | Best For | Pricing Model | Deployment | Free Plan |
|---|---|---|---|---|
| CubeAPM | On-prem teams, data sovereignty, predictable cost | $0.20/GB ingestion, unlimited users | Self-hosted (vendor-managed) | Free trial |
| Datadog | Managed multi-cloud with breadth of integrations | Host-based + ingestion ($15–$31/host/mo) | SaaS only | 14-day trial |
| New Relic | Broad platform with user-based pricing | User seats + ingestion ($49–$99/user/mo) | SaaS only | 100GB/mo free |
| Grafana | Teams already using Prometheus, Loki, Tempo | OSS free, Cloud usage-based | Self-hosted + SaaS | OSS free |
| Dynatrace | Enterprise AI-assisted analysis | Host-based licensing | SaaS + on-prem | 15-day trial |
| Honeycomb | High-cardinality debugging, distributed systems | Free tier, Pro $130/mo+ | SaaS only | 20M events/mo free |
| SigNoz | OTel-native teams wanting open source | OSS free, Cloud $0.30/GB | Self-hosted + SaaS | OSS free |
| Better Stack | Fast setup, developer-friendly UX | Free tier, paid from $29/mo | SaaS only | Free tier |
| Splunk | Enterprise SIEM and log-heavy workflows | Host-based + ingestion | SaaS + on-prem | 15-day trial |
| Elastic APM | Teams already on ELK stack | OSS free, Cloud $99/mo+ | Self-hosted + SaaS | OSS free |
1. CubeAPM
CubeAPM is a self-hosted, OpenTelemetry-native observability platform covering APM, logs, infrastructure, Kubernetes, RUM, synthetic monitoring, and error tracking. It runs inside your cloud or on-prem, eliminating data egress fees and external dependencies during incidents. Recognized as a High Performer in G2’s Spring 2026 APM Grid Report and ranked #4 among easiest-to-use APM tools.
Pricing: $0.20/GB ingestion with unlimited retention. No per-user, per-host, or per-metric fees.
Key Features:
- Full-stack unified monitoring: APM, logs, infrastructure, Kubernetes, Kafka, RUM, synthetics, error tracking
- Native OpenTelemetry support from day one with compatibility for Datadog, New Relic, Elastic, and Prometheus agents
- Self-hosted BYOC deployment for complete data sovereignty
- AI-based smart sampling that retains high-value traces while cutting storage costs
- Unlimited data retention with no egress charges
- Direct engineering support via WhatsApp and Slack during incidents
Pros:
- Simplest pricing model in the category: single dimension at $0.20/GB means no surprise bills from hosts, metrics, or users
- Up to 50% lower cost than enterprise APM at scale, documented by Delhivery and Mamaearth case studies
- Multi-agent compatible; works alongside existing Datadog, New Relic, or Prometheus agents for incremental migration
- Complete data ownership; no telemetry leaves your infrastructure, meeting SOC, ISO 27001, and data residency requirements
- Engineering-level support that responds in minutes, not ticket queues
Cons:
- Requires BYOC or on-prem deployment; your team manages the infrastructure
- No autonomous anomaly detection; AI-based smart sampling is not full AIOps alerting
- SSO and RBAC features less mature than enterprise SaaS incumbents
Best for: DevOps and platform teams that need full stack observability inside their own cloud without SaaS data egress, pricing sprawl, or DIY self-hosting overhead.
This estimate models production deployment with high availability. A smaller setup may cost significantly less.
2. Datadog
Datadog is a managed SaaS observability platform with 1,000+ integrations across metrics, logs, traces, RUM, synthetics, and security monitoring. It offers the broadest native integration ecosystem in the category, making it a strong fit for multi-cloud environments where teams want vendor-managed infrastructure.
Pricing: Host-based starting at $15/host/month for infrastructure monitoring. APM costs $31/host/month. Additional charges apply for logs ($0.10/GB ingest + $1.70/million events indexed), custom metrics, and synthetics. Pricing is based on publicly available information as of April 2026.
For a 50-node cluster with moderate APM and log usage, monthly cost typically ranges from $4,000 to $8,000 before custom metrics or RUM. Egress fees when sending telemetry to Datadog run approximately $0.10/GB from AWS or GCP.
Key Features:
- 1,000+ integrations covering cloud providers, databases, messaging systems, CI/CD tools
- Full stack monitoring: infrastructure, APM, logs, RUM, synthetics, security, network performance
- Real-time anomaly detection and AI-assisted alerting
- Unified dashboards that correlate metrics, traces, and logs
- Extensive plugin ecosystem for custom integrations
Pros:
- Deepest integration library in the category — if a service exists, Datadog likely supports it natively
- Fully managed SaaS with no infrastructure burden
- Strong correlation between APM traces, logs, and infrastructure metrics
- Mature RBAC, SSO, and audit capabilities for enterprise compliance
Cons:
- Pricing complexity creates surprise bills; per-host fees compound with logs, custom metrics, and RUM charges
- SaaS-only deployment means telemetry data leaves your infrastructure, ruling it out for regulated environments
- High cardinality metrics and long retention periods drive costs up rapidly at scale
- Proprietary agent and query language create lock-in
Best for: Large enterprises needing managed observability with the broadest integration support, where budget flexibility exists, and data residency is not a blocker.
3. New Relic

New Relic offers a unified observability platform covering APM, infrastructure, logs, browser monitoring, and synthetics. It operates on a user-based pricing model where teams pay per full platform user rather than per host or GB ingested, which works well for small teams but scales poorly as headcount grows.
Pricing: Standard plan at $49/user/month, Pro at $99/user/month. First 100GB of data ingestion free monthly, then $0.40/GB beyond that. Enterprise contracts include custom pricing with volume discounts. Pricing based on publicly available information as of April 2026.
A 20-person engineering team on Standard seats alone costs $980/month before any data ingestion charges. At 500GB/month ingestion, add $160 in overage fees. The per-seat model creates a rationing dynamic where junior developers often get locked out to control costs.
Key Features:
- Unified platform with APM, logs, infrastructure, browser monitoring, synthetics
- NRQL query language for custom dashboards and alerts
- Real-time anomaly detection with AI-assisted root cause analysis
- Mobile app monitoring for iOS and Android
- Extensive marketplace of pre-built integrations and dashboards
Pros:
- First 100GB/month of data ingestion free makes it cost-effective for very small teams
- Strong APM trace fidelity with distributed tracing across services
- Unified UI reduces context switching between logs, metrics, and traces
- Good documentation and active community
Cons:
- Per-user pricing punishes team growth: a 50-person team pays $2,450/month in seats alone before data costs
- NRQL query language creates lock-in: dashboards and alerts are not portable to other platforms
- SaaS-only deployment rules it out for data residency or HIPAA-regulated environments
- Data retention limits on lower tiers force teams to export or lose historical data
Best for: Small to mid-size teams that value a unified platform with strong APM capabilities and can absorb per-user pricing as they scale.
4. Grafana
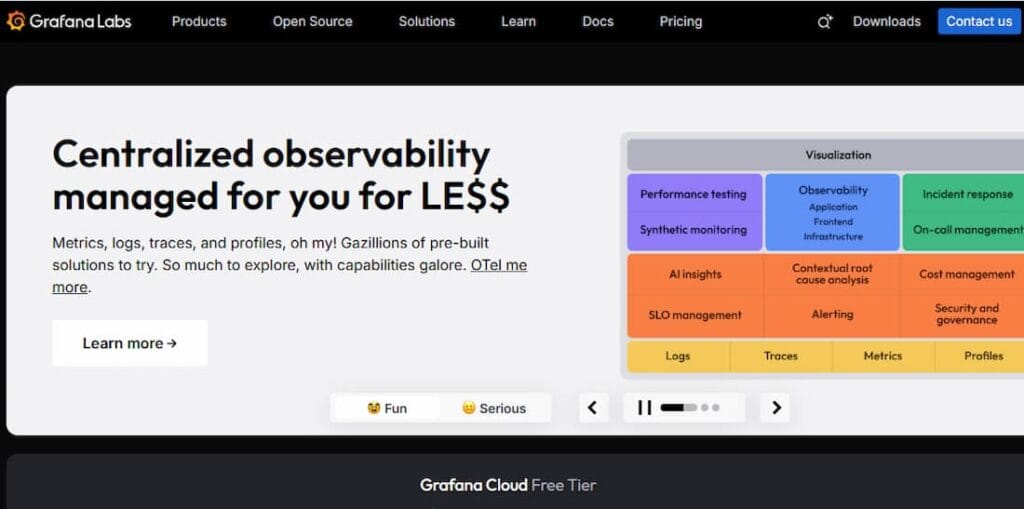
Grafana is an open-source visualization and dashboarding platform that integrates with Prometheus (metrics), Loki (logs), and Tempo (traces) to create a full observability stack. It gives teams complete control over their monitoring infrastructure but requires operational expertise to deploy and maintain at scale.
Pricing: Grafana OSS is free. Grafana Cloud offers a free tier (10k series, 50GB logs, 50GB traces/month), with Pro plans starting usage-based. Self-hosted infrastructure costs vary by deployment size and retention requirements. Pricing is based on publicly available information as of April 2026.
For a self-hosted stack handling 30TB/month with 30-day retention, infrastructure typically costs $2,000–$4,000/month depending on cloud provider and instance types. Grafana Cloud at the same scale runs $8,000–$12,000/month.
Key Features:
- Open source core with no vendor lock-in
- Native support for Prometheus, Loki, Tempo, and 100+ data sources
- Highly customizable dashboards and alerting
- Strong community and plugin ecosystem
- On-prem or cloud deployment flexibility
Pros:
- Complete control over data and infrastructure
- No licensing fees for OSS version
- Deep Prometheus integration makes it the default choice for teams already on Prometheus
- Extensive plugin ecosystem for custom visualizations
Cons:
- Self-hosting requires significant operational overhead: teams need expertise in managing Prometheus, Loki, Tempo, and Grafana itself
- High cardinality queries can cause performance issues without careful tuning
- Correlation between metrics, logs, and traces requires manual configuration
- Steeper learning curve compared to managed SaaS platforms
Best for: Teams with strong DevOps capabilities already using Prometheus, Loki, or Tempo who value control and customization over managed convenience.
5. Dynatrace
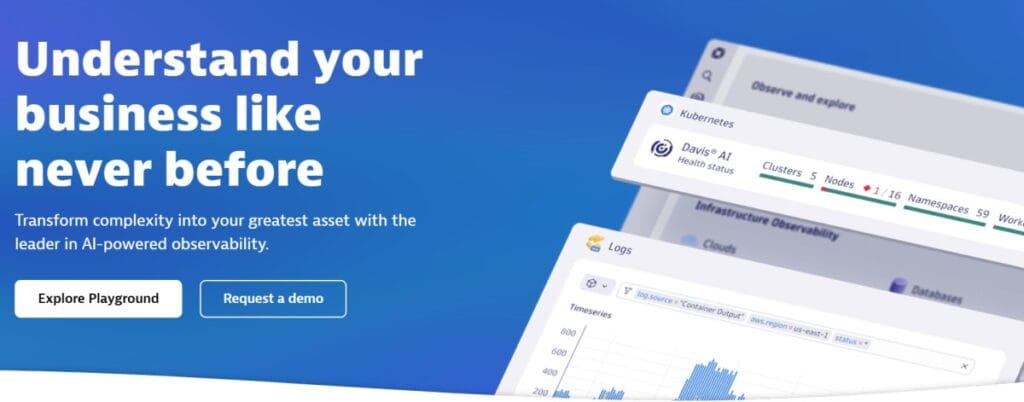
Dynatrace is an enterprise observability platform that emphasizes AI-driven automation for root cause analysis and anomaly detection. It automatically instruments applications, discovers dependencies, and builds real-time topology maps without manual configuration. Designed for large organizations managing complex hybrid cloud environments.
Pricing: Host-based licensing model with costs varying by product module and host size. Full stack monitoring typically starts around $0.08 per hour per host for infrastructure, with additional fees for application monitoring, log analytics, and synthetic monitoring. Enterprise contracts include custom pricing. Pricing is based on publicly available information as of April 2026.
A 100-host production environment with full stack monitoring and log analytics typically runs $7,000–$12,000/month before synthetics or RUM.
Key Features:
- AI-powered root cause analysis (Davis AI engine)
- Automatic instrumentation and dependency discovery
- Full stack monitoring: infrastructure, applications, logs, RUM, synthetics
- Real-time topology mapping with service dependencies
- Support for hybrid cloud and mainframe environments
Pros:
- Davis AI engine reduces alert noise by correlating events and surfacing root causes automatically
- Automatic instrumentation minimizes setup time for new services
- Strong support for legacy and mainframe systems alongside cloud native workloads
- Mature enterprise features: RBAC, SSO, audit logs, compliance reporting
Cons:
- High cost at scale; host-based licensing compounds quickly in elastic cloud environments
- Complexity requires dedicated training for teams to use effectively
- Proprietary query language (DQL) creates lock-in similar to New Relic’s NRQL
- SaaS architecture with limited on-prem deployment options
Best for: Large enterprises with complex hybrid environments needing AI-assisted observability and willing to invest in both licensing and training.
6. Honeycomb
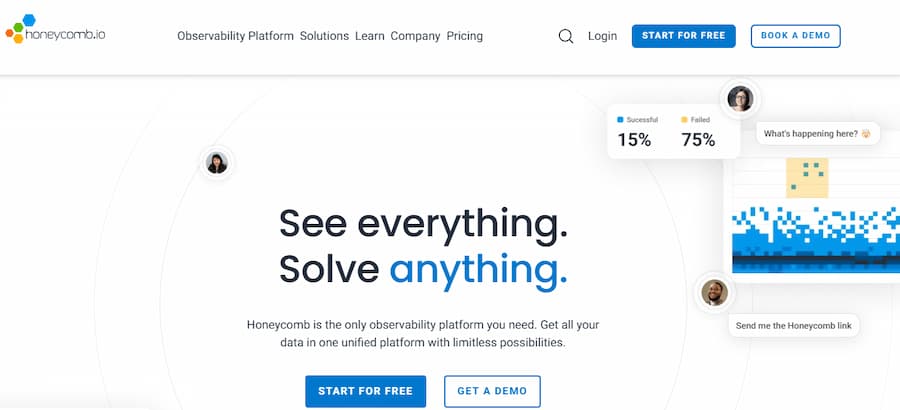
Honeycomb is an observability platform designed for high cardinality debugging of distributed systems. Unlike traditional APM tools that aggregate metrics, Honeycomb retains individual events with full context, making it possible to query arbitrary fields and dimensions to debug complex production issues.
Pricing: Free tier includes 20 million events/month. Pro plan starts at $130/month for 100 million events. Enterprise pricing scales with event volume and retention requirements. Pricing is based on publicly available information as of April 2026.
A team ingesting 5 billion events/month with 30-day retention typically pays $2,500–$4,000/month depending on query frequency and feature usage.
Key Features:
- High cardinality event storage; query any field without pre-aggregation
- BubbleUp feature automatically surfaces correlated fields causing anomalies
- Distributed tracing with full context retention
- Service level objective (SLO) tracking and alerting
- Native OpenTelemetry support
Pros:
- High cardinality queries make it possible to debug issues that aggregate-based tools miss entirely
- BubbleUp reduces time to root cause by automatically finding correlations
- Fast query performance even on billions of events
- Strong focus on developer experience and workflow integration
Cons:
- Event-based pricing can surprise teams during traffic spikes or instrumentation changes
- SaaS-only deployment rules it out for data residency requirements
- Less breadth than full stack platforms; primarily focused on traces and events, not infrastructure or RUM
- Smaller integration ecosystem compared to Datadog or New Relic
Best for: Engineering teams debugging complex distributed systems where high cardinality queries and full event context are critical to root cause analysis.
7. SigNoz
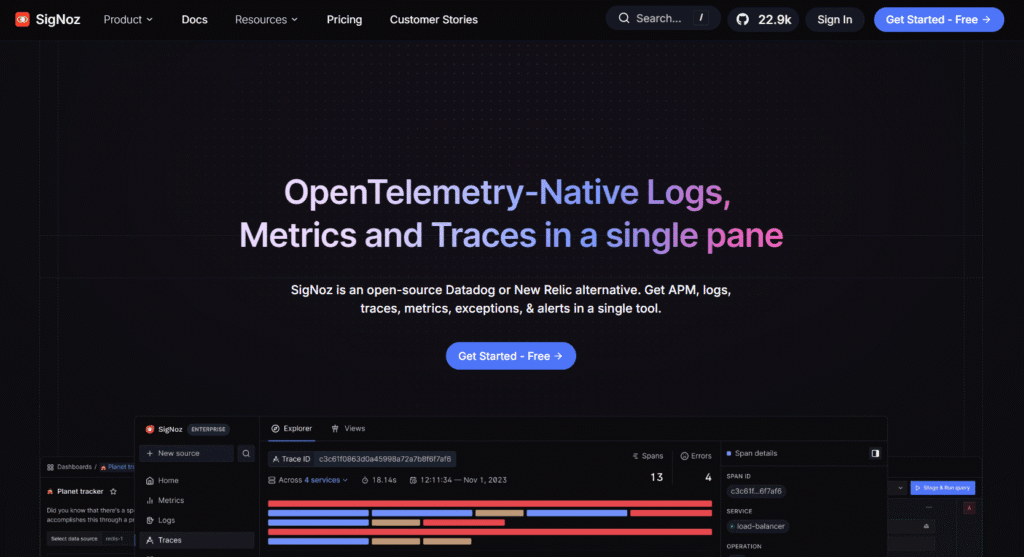
SigNoz is an open-source, OpenTelemetry-native observability platform offering APM, logs, and infrastructure monitoring. It provides a managed cloud option alongside self-hosted deployment, making it one of the few OSS projects that bridges the gap between full control and managed convenience.
Pricing: The open-source version is free. SigNoz Cloud starts at $0.30/GB ingestion with a free tier of 1GB traces, 1GB logs, 100 million samples/month. Self-hosted infrastructure costs depend on deployment size. Pricing is based on publicly available information as of April 2026.
For a team running 10TB/month on SigNoz Cloud, monthly cost is approximately $3,000. Self-hosted at the same scale typically runs $1,500–$2,500/month in infrastructure.
Key Features:
- Native OpenTelemetry support with ClickHouse storage backend
- APM with distributed tracing, service maps, and RED metrics
- Log management with full-text search and filtering
- Infrastructure monitoring for hosts, containers, and Kubernetes
- Alerts and dashboards with customizable visualizations
Pros:
- Open source with no vendor lock-in; export or migrate anytime
- ClickHouse backend provides fast query performance even at high cardinality
- Native OpenTelemetry means no proprietary agents or query languages
- Active community and responsive development team
Cons:
- Self-hosted deployment requires operational expertise to manage ClickHouse clusters at scale
- Smaller ecosystem of integrations compared to commercial platforms
- UI and feature set still maturing compared to Datadog or New Relic
- Managed cloud option is newer with less proven reliability than established SaaS platforms
Best for: OTel-first teams that want open source flexibility with the option to offload hosting to a managed service as they scale.
8. Better Stack
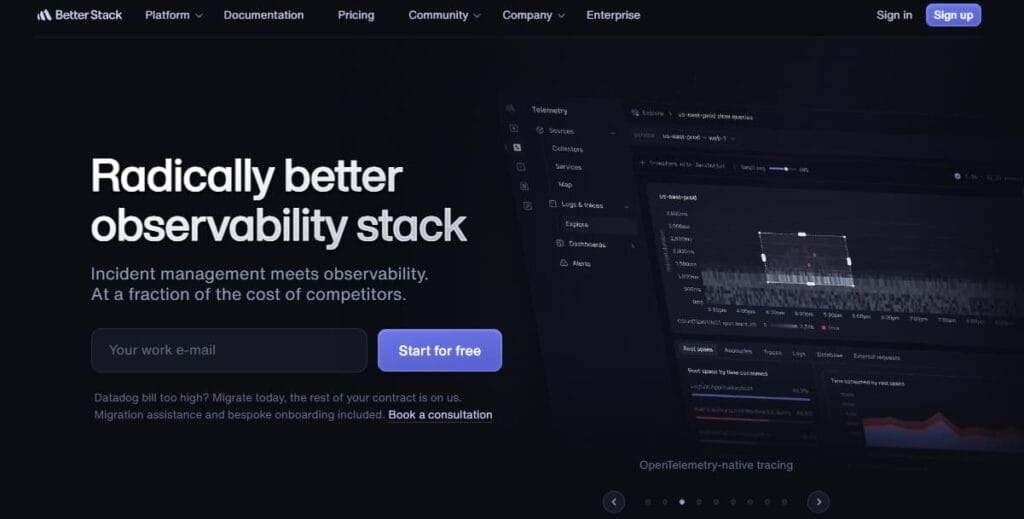
Better Stack is a developer-focused observability platform emphasizing fast setup, clean UI, and incident management workflows. It integrates uptime monitoring, log management, and incident response into a unified experience designed to get teams productive in minutes rather than days.
Pricing: Free tier includes basic uptime monitoring and limited log retention. Paid plans start at $29/month for small teams. Enterprise pricing scales based on team size and feature usage. Pricing is based on publicly available information as of April 2026.
A mid-size team with 5 responders and moderate log volume typically pays $200–$400/month.
Key Features:
- Uptime monitoring with multi-region checks
- Log management with fast search and filtering
- Incident management with on-call scheduling and escalation
- Status pages for customer-facing communication
- Integrations with Slack, PagerDuty, and major CI/CD tools
Pros:
- Fastest onboarding in the category; teams report being productive in under 30 minutes
- Clean, modern UI optimized for developer workflows
- Unified incident management eliminates context switching between monitoring and alerting tools
- Competitive pricing for small to mid-size teams
Cons:
- SaaS-only deployment rules it out for on-prem or data residency requirements
- Less signal depth than full stack APM platforms; primarily focused on logs and uptime
- Smaller integration ecosystem compared to established players
- Limited distributed tracing and infrastructure monitoring capabilities
Best for: Small to mid-size development teams wanting fast, developer-friendly observability without deep APM or infrastructure requirements.
9. Splunk
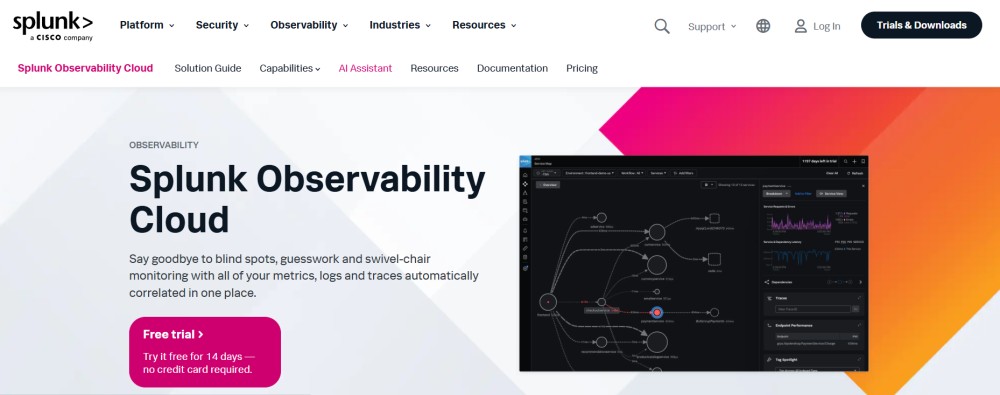
Splunk is an enterprise data analytics platform that originated in log management and expanded into observability, SIEM, and security analytics. It excels in environments where log data drives compliance, security investigations, and business intelligence alongside operational monitoring.
Pricing: Infrastructure monitoring starts at $15/host/month. Log ingestion pricing varies by volume and retention. APM and RUM modules add additional per-host or per-user fees. Enterprise contracts include custom pricing. Pricing is based on publicly available information as of April 2026.
A 100-host environment with 5TB/month log ingestion typically costs $8,000–$15,000/month depending on retention and feature modules.
Key Features:
- Enterprise log analytics with search processing language (SPL)
- SIEM and security analytics capabilities
- APM with distributed tracing and service maps
- Infrastructure monitoring for hybrid cloud and on-prem
- Extensive ecosystem of apps and integrations
Pros:
- Industry-leading log analytics with powerful SPL query language
- Deep SIEM integration makes it strong for security-heavy workflows
- Mature enterprise features: RBAC, audit, compliance reporting
- On-prem deployment option for regulated industries
Cons:
- High cost at scale; log ingestion and retention fees compound quickly
- SPL query language creates lock-in similar to Datadog and New Relic
- Complexity requires dedicated training and Splunk-specific expertise
- Observability features less mature than purpose-built APM platforms
Best for: Large enterprises with heavy log analytics, SIEM, or compliance requirements where Splunk already serves as the data analytics backbone.
10. Elastic APM
Elastic APM is the application performance monitoring component of the Elastic Stack (Elasticsearch, Logstash, Kibana). It integrates natively with existing ELK deployments, making it a natural choice for teams already using Elastic for log management or search.
Pricing: Elastic APM is free in the open source version. Elastic Cloud starts at $99/month for standard tier with basic features. Enterprise features require higher tiers. Self-hosted infrastructure costs depend on cluster size and retention. Pricing based on publicly available information as of April 2026.
A self-hosted ELK stack handling 15TB/month with APM typically costs $3,000–$5,000/month in infrastructure. Elastic Cloud at the same scale runs $8,000–$12,000/month.
Key Features:
- Native integration with Elasticsearch, Logstash, Kibana
- Distributed tracing with service maps and transaction sampling
- Real user monitoring (RUM) for frontend performance
- Machine learning-based anomaly detection (on higher tiers)
- Support for multiple programming languages and frameworks
Pros:
- Seamless integration with existing ELK deployments eliminates the need for separate APM infrastructure
- Open source version offers full APM capabilities at no licensing cost
- Flexible deployment: self-hosted, cloud, or hybrid
- Strong community and extensive documentation
Cons:
- Self-hosting requires deep Elasticsearch expertise; managing clusters at scale is operationally complex
- APM features less mature than purpose-built platforms like Datadog or Dynatrace
- Query performance degrades with high-cardinality data without careful index tuning
- Elastic Cloud pricing scales quickly with retention and feature usage
Best for: Teams already running the Elastic Stack for logs or search who want to add APM without introducing a separate platform.
How to Choose the Right Developer Observability Tool
Choosing an observability platform depends on five core dimensions: deployment model, cost structure, signal depth, existing stack integration, and team expertise. The wrong choice here compounds over time — either in runaway costs, operational burden, or gaps in visibility that surface only during production incidents.
Deployment model and data sovereignty
If your organization operates under HIPAA, GDPR, or strict data residency requirements, SaaS-only platforms like Datadog, New Relic, and Honeycomb are ruled out immediately. Telemetry data contains sensitive user information, API keys, and application logic that many regulated industries cannot send outside their infrastructure. Data privacy and on-prem security in modern observability architectures cover the compliance and architectural implications in depth.
Self-hosted or BYOC platforms, CubeAPM, SigNoz, Grafana, and Elastic APM, keep telemetry data within your VPC or data center. The tradeoff is operational overhead. Grafana and Elastic require deep expertise to deploy and scale. CubeAPM and SigNoz offer vendor-managed self-hosted options that reduce Day 2 operations burden while maintaining data control.
Cost structure and predictability
Observability pricing models vary widely, and the wrong choice creates budget surprises. Host-based pricing (Datadog, Dynatrace, Splunk) compounds in elastic cloud environments where auto-scaling can triple your bill during traffic spikes before completing a single revenue-generating transaction. User-based pricing (New Relic) creates a rationing dynamic where junior developers get locked out to control costs.
Ingestion-based pricing (CubeAPM at $0.20/GB, SigNoz Cloud at $0.30/GB) offers the most predictable model because you pay only for data volume, not infrastructure elasticity or team growth. The catch is understanding what drives ingestion: high cardinality metrics, verbose logging, and full trace sampling all increase volume. Why observability costs become unpredictable at scale breaks down the cost drivers teams discover only after deployment.
For a growing team ingesting 30TB/month:
- CubeAPM: $6,000/month
- SigNoz Cloud: $9,000/month
- Datadog: $15,000–$25,000/month (host fees + logs + metrics + RUM)
- New Relic: $12,000–$18,000/month (user seats + ingestion overages)
- Grafana self-hosted: $3,000–$5,000/month infrastructure, no licensing fees
This estimate models production deployment with moderate retention and feature usage. Actual costs vary based on retention period, indexing strategy, and add-on modules.
Signal depth and correlation
Full stack observability requires metrics, logs, traces, infrastructure data, and user experience monitoring working together. Not every platform covers all signals equally. Datadog and Dynatrace offer the broadest native coverage but at a premium cost. Honeycomb excels at high-cardinality trace debugging but lacks infrastructure monitoring depth. Better Stack focuses on logs and uptime, leaving APM and RUM to other tools.
The correlation problem matters more than breadth. If your logs live in Splunk, traces in Jaeger, and metrics in Prometheus, incident response becomes a context-switching nightmare. Unified platforms like CubeAPM, Datadog, New Relic, and Dynatrace correlate signals automatically, linking a slow API trace to the specific database query and the infrastructure bottleneck causing it. Top observability tools compare signal coverage and correlation capabilities across platforms.
Existing stack integration
Teams already invested in specific ecosystems face migration costs that outweigh platform features. If your team runs Prometheus and Grafana in production, adding Elastic APM creates operational complexity with minimal benefit. If you’ve standardized on AWS CloudWatch and X-Ray, migrating to Datadog requires reworking every dashboard and alert.
OpenTelemetry support reduces this friction. CubeAPM, SigNoz, and Grafana offer native OpenTelemetry compatibility, meaning you can instrument once and switch backends without rewriting application code. Datadog, New Relic, and Dynatrace support OpenTelemetry but with proprietary extensions that reintroduce lock-in.
Team expertise and operational burden
Self-hosted platforms, Grafana, Elastic APM, and SigNoz OSS, give complete control but require deep operational expertise. Managing Prometheus at scale means understanding federation, remote write, and query optimization. Running Elasticsearch means tuning shard allocation, managing cluster health, and handling reindexing during upgrades. These platforms work well for teams with dedicated SRE or platform engineering resources.
Managed platforms like Datadog, New Relic, and Honeycomb eliminate infrastructure burden but introduce vendor dependency. If Datadog has an outage, your monitoring goes dark during incidents. How observability platforms fail and what high availability actually means documents real SaaS outages and their impact on incident response.
CubeAPM bridges this gap – self-hosted for data control, vendor-managed for Day 2 operations. Your infrastructure runs the platform, but CubeAPM’s team handles upgrades, scaling, and support.
Decision framework summary
| If you need… | Choose… |
|---|---|
| Data sovereignty + predictable cost | CubeAPM or SigNoz |
| Managed SaaS + broadest integrations | Datadog |
| High cardinality debugging | Honeycomb |
| Full control + OSS flexibility | Grafana or Elastic APM |
| Enterprise AI-assisted analysis | Dynatrace |
| Fast setup + incident management | Better Stack |
| Log-heavy SIEM workflows | Splunk |
| Unified platform + strong APM | New Relic |
Disclaimer: The information in this article reflects the latest details available at the time of publication and may change as technologies and products evolve. Features, pricing, and plan limits can change over time. Always verify the latest information directly with the vendor before making purchasing or deployment decisions.
Frequently Asked Questions
What is the difference between observability and monitoring?
Monitoring tracks known failures like uptime and error rates. Observability enables debugging unknown failures by correlating metrics, logs, and traces to understand why systems behave the way they do.
Which observability tool is best for small teams?
Better Stack and SigNoz Cloud offer the fastest onboarding and lowest starting cost for small teams. Grafana OSS works well if you already have DevOps expertise.
What is OpenTelemetry and why does it matter?
OpenTelemetry is an open standard for instrumenting applications that eliminates vendor lock-in. Tools with native OpenTelemetry support let you switch backends without rewriting code.
How much does observability cost at scale?
For a team ingesting 30TB/month, costs range from $6,000/month (CubeAPM) to $25,000/month (Datadog) depending on pricing model and feature usage. Ingestion-based pricing is most predictable.
Can I run observability tools on-prem?
CubeAPM, SigNoz, Grafana, Elastic APM, and Dynatrace support on-prem or BYOC deployment. Datadog, New Relic, Honeycomb, and Better Stack are SaaS-only.
What is the best observability tool for Kubernetes?
CubeAPM, Datadog, and Dynatrace offer the deepest Kubernetes-native monitoring with pod-level metrics, cluster topology, and control plane visibility. Grafana works well if you already run Prometheus Operator.
How do I migrate from New Relic or Datadog?
Migrate incrementally using OpenTelemetry to dual-write telemetry to both platforms during transition. CubeAPM and SigNoz support incremental migration with agent compatibility for Datadog and New Relic.