










Rails applications generate unique monitoring challenges that generic APM tools often miss. ActiveRecord N+1 queries can quietly degrade response times across entire endpoints. Memory bloat compounds across long-running processes. Background jobs fail silently in Sidekiq or Solid Queue. Without Rails-specific instrumentation, these issues surface as vague latency spikes rather than actionable root causes.
According to the 2025 Stack Overflow Developer Survey, Ruby ranks among the top 15 most used programming languages, with Rails remaining the dominant framework for rapid web application development. Yet most engineering teams rely on monitoring tools built for polyglot environments that treat Rails as just another web framework rather than understanding its ActiveRecord patterns, view rendering pipeline, and job queue architecture.
This guide compares 10 monitoring tools used in production Rails environments. Each is evaluated on ActiveRecord query visibility, pricing transparency, OpenTelemetry compatibility, and deployment model. Tools range from Rails native APMs to full stack platforms that support Rails alongside other languages.
Quick Comparison: 10 Rails Monitoring Tools at a Glance
| Tool | Best For | Pricing | ActiveRecord Insights | OTel Native? |
|---|---|---|---|---|
| CubeAPM | On-prem teams, data sovereignty, cost control | $0.20/GB, unlimited users | ✓ Full visibility | ✓ Native |
| Scout APM | Rails-only shops, minimal config | From $19/month, transaction-based | ✓ N+1 detection, DevTrace | ✗ Proprietary agent |
| AppSignal | Request-based pricing, GDPR compliance | From $23/month for 10M requests | ✓ Magic Dashboard | ✗ Proprietary agent |
| Skylight | Rails performance optimization | Free tier, $20/month for higher volume | ✓ Allocation tracking | ✗ Rails specific |
| New Relic | Full-stack observability, large teams | $99/user/month (Standard), $349/user (Pro) | ✓ Transaction traces | Partial |
| Datadog | Infrastructure-heavy teams | $46/host/month minimum (Infrastructure + APM) | ✓ ActiveRecord instrumentation | Partial |
| Honeybadger | Error tracking + basic APM | From $39/month | ✓ Performance metrics | ✗ Proprietary agent |
| Uptrace | OpenTelemetry native, self-hosted option | Free self-hosted, $99/month cloud | ✓ N+1 detection | ✓ Native |
| Elastic APM | Teams already on ELK stack | Free OSS, hosted from $95/month | ✓ Query analysis | Partial |
| Rails Pulse | Open source, database stored | MIT licensed, free | ✓ Query breakdown | ✗ Rails engine |
Pricing reflects publicly available information as of early 2026. Enterprise discounts and custom contracts are not included.
1. CubeAPM

Best for: DevOps teams wanting full stack observability inside their own cloud without SaaS data egress or pricing sprawl
CubeAPM is an OpenTelemetry native observability platform that runs inside your VPC or on-premises. It covers APM, logs, infrastructure, Kubernetes, RUM, and error tracking in one unified interface. For Rails applications, it auto-instruments ActiveRecord, Action Controller, and background job frameworks through the OpenTelemetry Ruby SDK.
Key Features:
- ActiveRecord query analysis with N+1 detection built into trace views
- Request waterfall showing controller to model to database timing
- Background job monitoring for Sidekiq, Resque, Solid Queue, Good Job, Delayed Job
- Error correlation with full stack traces and deployment markers
- Self-hosted deployment keeps all telemetry data in your infrastructure
- Unlimited retention at flat $0.15/GB pricing
Pricing:
Pro plan: $0.20/GB ingestion-based pricing, billed quarterly. Enterprise: Custom pricing with dedicated support and unlimited retention. No per-user fees, no per-host charges. Self-hosting requires your own infrastructure (ClickHouse database, Kubernetes cluster recommended)
Pros:
- Zero vendor lock-in through OpenTelemetry compatibility
- ActiveRecord instrumentation captures slow queries automatically
- SQL query parameter binding visible in traces for debugging
- Full data sovereignty, no telemetry leaves your environment
- Works with infrastructure monitoring tools already in your stack
Cons:
- Self-hosting requires infrastructure setup and ongoing maintenance
- UI learning curve for teams new to high cardinality trace exploration
Best for: Teams with data residency requirements, cost-sensitive organizations scaling past 50TB/month, or engineering teams wanting to own their observability data without DIY backend burden.
2. Scout APM
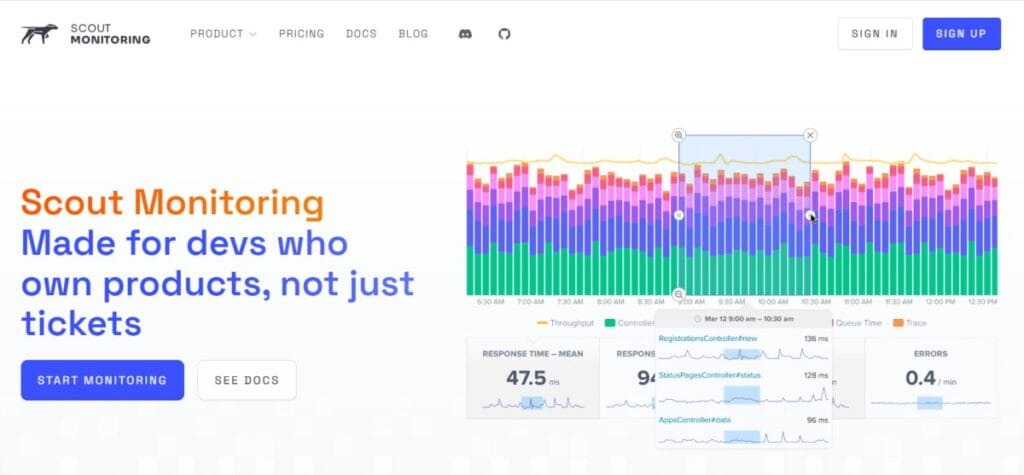
Scout APM focuses exclusively on Rails performance monitoring. It detects N+1 queries, memory bloat, and slow endpoints without requiring code changes beyond gem installation.
Key Features:
- Automatic N+1 query detection at the controller action level
- Memory bloat analysis per endpoint showing allocation hotspots
- Git integration displays which commit introduced performance regression
- Anomaly detection flags latency spikes against historical baseline
- DevTrace local profiler works without sending data to Scout servers
Pricing:
Transaction-based pricing rather than per server. Starts at $19/month for lower volume applications. Scales with transaction count, not infrastructure size. 14-day free trial available. Verify current rates at Scout APM pricing
Pros:
- Rails-specific optimizations; understands ActiveRecord patterns
- DevTrace enables local development profiling without SaaS dependency
- Auto-instruments Sidekiq, Resque, and Delayed Job
- Low overhead reported at approximately 1ms per request
Cons:
- Ruby and Rails only, no support for polyglot stacks
- Closed source prevents self-hosting or code audits
- Pricing scales with transaction volume, which can spike unpredictably
Best for: Rails only development shops wanting minimal configuration and Rails native APM without managing infrastructure.
3. AppSignal
AppSignal combines APM, error tracking, and host metrics in a single interface. It includes anomaly detection and custom dashboards for tracking business metrics alongside performance data.
Key Features:
- Magic Dashboard auto-generates metrics from ActiveRecord models
- Anomaly detection uses ML to alert on unusual patterns
- Host metrics (CPU, memory, disk) displayed alongside APM traces
- Incident management groups related errors automatically
- StroopWafel distributed tracing for microservices architectures
Pricing:
Starts at $23/month for 10M requests plus unlimited hosts; $59/month tier for higher volume applications; $139/month for 100M+ requests. 30-day free trial, no credit card required. Check live pricing at AppSignal plans
Pros:
- Request-based pricing avoids per-host billing surprises
- Magic Dashboard generates graphs without manual configuration
- EU-based infrastructure provides GDPR compliance by default
- Integrates host metrics, APM, and errors in a unified view
Cons:
- Limited trace retention with a 30-day maximum
- No OpenTelemetry support limits migration flexibility
- Extra cost for distributed tracing across services
Best for: European teams needing GDPR compliance or organizations preferring request-based pricing over per-host fees.
4. Skylight
Skylight focuses on Rails performance optimization. It breaks down time spent in views versus database queries and highlights allocation hotspots that cause memory issues.
Key Features:
- Endpoint breakdown showing view rendering versus database time
- Allocation tracking identifies memory-hungry code paths
- Problem detection surfaces N+1 queries and repeated queries
- Response time histogram shows distribution across percentiles
- GitHub commit links connect performance changes to deployments
Pricing:
Free tier includes 100K traces per month. Paid plans start at $20/month for additional volume. Custom pricing for high-volume applications. Free for open-source projects. Verify current plans at Skylight pricing
Pros:
- Rails-specific instrumentation understands ERB rendering
- Allocation tracking helps diagnose memory leaks
- Simple pricing based on request volume
- Low performance overhead on application
Cons:
- No error tracking; requires a separate tool
- No distributed tracing for microservices
- Rails only; does not support other languages
Best for: Rails developers optimizing single application performance who need allocation visibility for memory debugging.
5. New Relic

New Relic provides full-stack observability, including browser monitoring, mobile app tracking, and infrastructure metrics. The Ruby agent auto-instruments Rails applications.
Key Features:
- Real User Monitoring (RUM) tracks frontend performance
- Distributed tracing connects requests across services
- Custom dashboards built with NRQL query language
- Deployment markers correlate releases with performance changes
- Alert policies with anomaly detection
Pricing:
Standard: First user free, additional users $99/month (max 5 users). Pro: $349/user/month (annual) or $419/month (monthly), 100GB free data ingest, $0.40/GB beyond the free tier. One full platform user free forever. Verify current pricing at the New Relic pricing page.
Pros:
- Full stack coverage (backend, frontend, mobile)
- Powerful NRQL query language for custom analysis
- Integrates with 600+ technologies
- Strong APM features including transaction traces and SQL analysis
Cons:
- Complex pricing combines per-user and data-based billing
- UI complexity overwhelming for small teams
- Per-user pricing is expensive for large engineering organizations
- NRQL creates vendor lock-in for dashboards and alerts
Best for: Large organizations needing full-stack observability across web, mobile, and infrastructure who can absorb per-user costs.
6. Datadog
Datadog combines infrastructure monitoring, APM, and log management. The Ruby tracer instruments Rails automatically through the ddtrace gem.
Key Features:
- Unified metrics, traces, and logs in a single platform
- Live tail streams logs in real time
- Watchdog AI-powered anomaly detection
- Security monitoring tracks application vulnerabilities
- Network performance monitoring for distributed systems
Pricing:
Infrastructure Pro: $15/host/month (required for APM). APM: $31/host/month additional (includes 150GB trace ingestion). Minimum monthly cost: $46/host (Infrastructure + APM combined). Logs: $0.10/GB ingested separately. Verify pricing at Datadog APM plans.
A 50-node Rails cluster costs $2,300/month before logs or custom metrics.
Pros:
- Single platform for infrastructure, APM, logs, and security
- Strong Kubernetes integration
- Watchdog AI detects anomalies without manual configuration
- 500+ integrations with cloud services and tools
Cons:
- Expensive at scale with per-host pricing model
- Trace retention limited to 15 days by default
- Complex billing across multiple product lines
- Per-host pricing means costs triple when auto-scaling during traffic spikes
Best for: Infrastructure-heavy teams already using Datadog for server monitoring who need unified observability.
7. Honeybadger
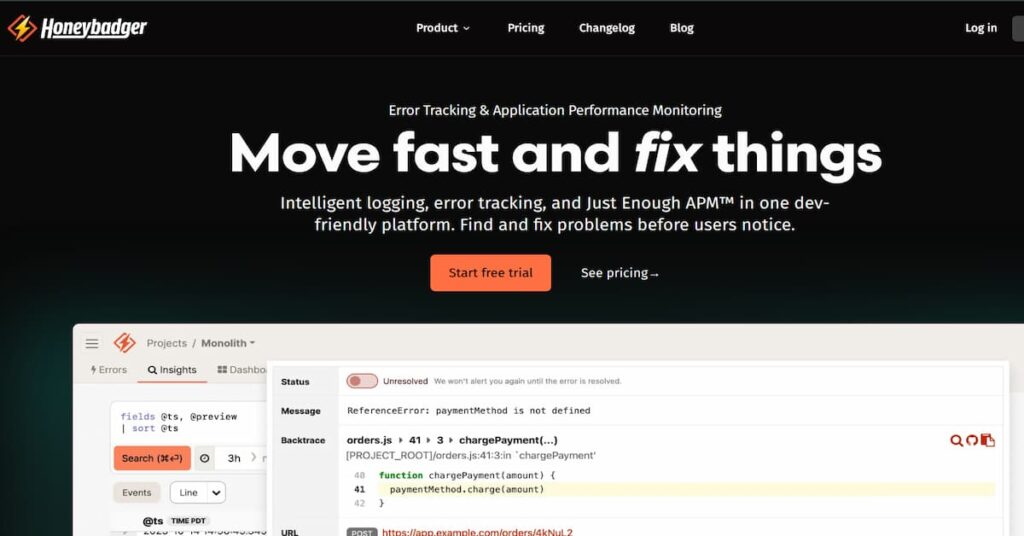
Honeybadger combines error tracking with application performance monitoring. Once installed, it automatically reports errors in controllers, background jobs, and rake tasks while collecting performance metrics.
Key Features:
- Automatic error reporting from controllers and background jobs
- Application logs collection
- Performance metrics tracking
- Check-ins for cron job monitoring
- Uptime monitoring for critical endpoints
Pricing:
Plans start at $39/month. Pricing scales with error volume and features needed. Check current plans at Honeybadger pricing
Pros:
- Unified error tracking and performance monitoring
- Automatic instrumentation requires minimal configuration
- Check-ins feature monitors scheduled job execution
- Uptime monitoring included
Cons:
- APM features less comprehensive than specialized tools
- Limited deep performance profiling
- No distributed tracing for microservices
Best for: Small to midsize Rails teams wanting combined error tracking and basic performance monitoring in one tool.
8. Uptrace
Uptrace is an OpenTelemetry native APM that collects traces, metrics, and logs from Rails applications. It uses the standard OpenTelemetry Ruby SDK, keeping data portable across backends.
Key Features:
- ActiveRecord query analysis with N+1 detection
- Request waterfall showing controller to model to database timing
- Background job monitoring for Sidekiq, Resque, Good Job
- Error correlation links exceptions to traces
- Self-hosted or cloud deployment options
Pricing:
Self-hosted: Free with unlimited data, no restrictions. Cloud: $99/month for 5GB traces. Verify pricing details at Uptrace’s official website.
Pros:
- Zero vendor lock-in through OpenTelemetry standard
- ActiveRecord instrumentation captures slow queries automatically
- SQL query parameter binding visible in traces
- Open source allows code audits and contributions
Cons:
- Self-hosting requires ClickHouse database setup
- UI learning curve for complex query exploration
- Smaller community compared to commercial tools
Best for: Teams wanting data ownership through self-hosting or avoiding per-server pricing with OpenTelemetry compatibility.
9. Elastic APM
Elastic APM integrates with the Elastic Stack (Elasticsearch, Logstash, Kibana). The Ruby agent instruments Rails applications and sends data to Elasticsearch.
Key Features:
- Distributed tracing across services
- Service maps visualize dependencies
- SQL query analysis with statement breakdowns
- Error tracking with stack traces
- Integrates with existing ELK stack deployments
Pricing:
Open source: Free for self-hosted deployments. Elastic Cloud: Starts at $95/month for standard deployment. Enterprise features require higher tiers. Verify the current pricing at Elastic’s official website.
Pros:
- Free for self-hosted open source deployments
- Deep integration with Elasticsearch ecosystem
- Powerful if team already uses ELK stack
- Distributed tracing included
Cons:
- Requires Elasticsearch knowledge for effective use
- Self-hosting carries operational complexity
- UI less intuitive than specialized APM tools
- Performance overhead from Elasticsearch indexing
Best for: Teams already operating Elasticsearch clusters who want APM integrated with existing log and metrics infrastructure.
10. Rails Pulse
Rails Pulse is an open-source Rails engine that monitors response times, SQL queries, and background jobs. All data is stored in your own database without external dependencies.
Key Features:
- Response time tracking per route
- SQL query performance with P95/P99 percentiles
- Background job monitoring across ActiveJob adapters
- Zero configuration after installation
- Data stored in application database
Pricing:
MIT-licensed, completely free. No accounts, API keys, or external services required. Source code is available on GitHub
Pros:
- Zero cost, open source
- Data stays in your database, no external transmission
- Works with all ActiveJob adapters (Sidekiq, Solid Queue, Good Job)
- Direct SQL access to monitoring data
Cons:
- Basic UI compared to commercial tools
- Limited alerting capabilities
- No distributed tracing
- Database storage can grow large without cleanup
Best for: Solo developers and small teams wanting zero-cost Rails monitoring with complete data control.
How to Choose the Right Rails Monitoring Tool
Selecting a Rails monitoring tool depends on five factors: deployment model, pricing predictability, Rails-specific instrumentation depth, observability scope, and migration path.
Deployment model considerations:
If data residency, compliance, or egress costs matter, prioritize tools offering self hosted or on premises deployment. CubeAPM, Uptrace, Elastic APM, and Rails Pulse all support running inside your infrastructure. SaaS only tools like Scout APM, AppSignal, Skylight, New Relic, Datadog, and Honeybadger require sending telemetry to their cloud.
Cloud egress fees add approximately $0.10/GB when sending telemetry to external SaaS platforms, a cost rarely mentioned in vendor pricing pages.
Pricing model evaluation:
Request-based pricing (AppSignal, Scout APM, Skylight) works well for teams with predictable traffic patterns. Per-host pricing (Datadog, New Relic) becomes expensive when auto-scaling, as a cluster scaling from 20 to 80 nodes during peak traffic quadruples monitoring costs in the same window. Ingestion-based pricing (CubeAPM) offers the most predictable cost model as it scales linearly with data volume rather than infrastructure count.
For a 50-host Rails cluster processing 10TB telemetry monthly:
- CubeAPM: $2,000/month ($0.20/GB)
- Datadog: $2,300/month (Infrastructure + APM, before logs)
- New Relic: $5,700/month (3 full platform users + data overage)
- AppSignal: Approximately $1,000/month for 50M requests
These estimates model a production-ready setup. Your costs will vary based on traffic volume, retention requirements, and feature usage.
Rails instrumentation depth:
Tools built specifically for Rails (Scout APM, Skylight, Rails Pulse) provide deeper ActiveRecord insights out of the box. They understand Rails-specific patterns like view rendering time, eager loading, and query caching. Generic APM tools (New Relic, Datadog, Elastic) require more configuration to achieve similar visibility.
N+1 query detection is critical for Rails applications. Scout APM, CubeAPM, AppSignal, and Uptrace all surface N+1 queries automatically in trace views.
Observability scope:
If you need only Rails APM, specialized tools like Scout or Skylight suffice. If you need unified logs, metrics, traces, and infrastructure monitoring, full stack platforms (CubeAPM, New Relic, Datadog) provide better value than stitching together separate tools. Teams running Docker monitoring tools or MongoDB monitoring tools alongside Rails benefit from platforms covering all layers.
Migration and vendor lock-in:
OpenTelemetry native tools (CubeAPM, Uptrace) provide the cleanest migration path. You can switch backends without changing instrumentation code. Proprietary agents (Scout APM, AppSignal, Skylight) require replacing instrumentation entirely when changing vendors. New Relic’s NRQL query language locks in dashboards and alerts.
Monitoring Rails in Production: What to Track
Effective Rails monitoring requires tracking four signal types: request performance, database query behavior, background job health, and error patterns.
Request performance metrics:
Track P95 and P99 response times by controller action, not just averages. A controller averaging 200ms but hitting 3 seconds at P99 indicates a problem affecting real users. Monitor time spent in view rendering separately from database queries to identify whether slowness comes from ERB templates or ActiveRecord.
ActiveRecord query patterns:
N+1 queries are the most common Rails performance problem. A controller action fetching 100 records then making 100 individual queries for associations can degrade response time from 50ms to 5 seconds. Monitor query counts per request and flag endpoints making more than 20 queries. Track slow queries with duration over 100ms and identify which controller actions trigger them.
Background job monitoring:
Failed background jobs often go unnoticed until users report missing functionality. Track job execution time, failure rate, and retry count for Sidekiq, Solid Queue, Good Job, or Delayed Job. Alert on queues growing beyond normal size, indicating jobs are not processing fast enough.
Error tracking:
Log errors with full stack traces including request parameters, user context, and deployment version. Group errors by root cause rather than creating separate incidents for each occurrence. Link errors to the specific code commit that introduced them through Git integration.
Rails applications also benefit from monitoring memory growth over time to detect leaks, tracking Action Cable connection counts for WebSocket applications, and measuring cache hit rates for fragment and query caching.
Migrating from New Relic or Datadog to a New Rails Monitoring Tool
Migration from an existing APM typically follows a four-week timeline: evaluation (week 1), parallel instrumentation (week 2), validation (week 3), and cutover (week 4).
Week 1: Evaluation and access setup
Install the new tool in development or staging first. Verify it captures the same signals your current tool provides. Most Rails monitoring tools require only adding a gem to your Gemfile and setting an API key or configuration file. CubeAPM and Uptrace require OpenTelemetry SDK installation.
Week 2: Parallel instrumentation in production
Run both tools simultaneously for at least one week to compare data accuracy. This catches instrumentation gaps before removing your existing tool. Most monitoring gems add minimal overhead (1-3ms per request), making parallel operation safe.
Week 3: Dashboard and alert migration
Recreate critical dashboards in the new tool. For teams leaving New Relic, this means translating NRQL queries to the new platform’s query language or UI. Migrate alerts by identifying your most important thresholds (response time over 1 second, error rate above 1%, queue depth over 1000 jobs) and configuring equivalent alerts in the new system.
Week 4: Cutover and old tool removal
After validating dashboard parity and alert reliability, remove the old monitoring gem from your Gemfile. For SaaS tools, downgrade to a free tier for 30 days rather than immediate cancellation to retain access to historical data during the transition.
OpenTelemetry-based migrations (to CubeAPM or Uptrace) allow keeping the same instrumentation code while changing only the backend destination, reducing cutover risk.
Disclaimer: The information in this article reflects the latest details available at the time of publication and may change as technologies and products evolve. Features, pricing, and plan limits can change over time. Always verify the latest information directly with the vendor before making purchasing or deployment decisions.
Frequently Asked Questions
What is the best Rails monitoring tool for small teams?
Rails Pulse offers zero-cost monitoring for teams wanting basic visibility without vendor commitment. For paid options, Skylight provides Rails-specific APM starting at $20/month with a generous free tier. Scout APM starts at $19/month with strong N+1 detection.
Which Rails monitoring tools support OpenTelemetry?
CubeAPM and Uptrace are built natively on OpenTelemetry. New Relic, Datadog, and Elastic APM support OpenTelemetry through backend compatibility but use proprietary agents for richer instrumentation. Scout APM, AppSignal, Skylight, and Honeybadger use proprietary agents only.
How much does Rails monitoring cost for a 50-server cluster?
Cost varies significantly by pricing model. CubeAPM charges approximately $2,000/month for 10TB telemetry. Datadog costs around $2,300/month minimum for 50 hosts. New Relic charges per user, reaching $5,700/month for three users plus data overage. AppSignal costs roughly $1,000/month for 50M requests.
Do Rails monitoring tools detect N+1 queries automatically?
Scout APM, CubeAPM, AppSignal, and Uptrace all detect N+1 queries automatically. Skylight surfaces repeated queries in its problem detection. New Relic, Datadog, and Elastic APM show query counts in transaction traces but require manual analysis to identify N+1 patterns.
Can I self-host Rails monitoring to keep data in my infrastructure?
Yes. CubeAPM, Uptrace, Elastic APM, and Rails Pulse all support self-hosted deployment. CubeAPM provides vendor-managed self-hosting where the platform runs in your VPC, but the CubeAPM team handles updates and maintenance. Scout APM, AppSignal, Skylight, New Relic, Datadog, and Honeybadger are SaaS only.
Which tool is best for Rails applications with strict data compliance requirements?
CubeAPM and Uptrace self-hosted deployments keep all telemetry data in your infrastructure with no external transmission. Rails Pulse stores data in your application database. AppSignal is EU-based and GDPR compliant by default but still sends data to their servers. These options work for teams with data residency or regulatory constraints.
How do I monitor Sidekiq background jobs in Rails?
Most Rails monitoring tools auto-instrument Sidekiq. Scout APM, AppSignal, CubeAPM, New Relic, Datadog, Honeybadger, and Uptrace all track Sidekiq job execution time, failure rate, and queue depth. Rails Pulse monitors all ActiveJob adapters, including Sidekiq, Solid Queue, Good Job, and Delayed Job.