










Canary deployments fail silently when monitoring is missing or too slow. A 2% traffic canary that degrades response times by 300ms can burn user trust before your alert even fires. According to the CNCF Annual Survey 2024, 68% of organizations use Kubernetes in production, and most rely on gradual rollout strategies like canary deployments to reduce risk during releases. The gap between deploying a canary and knowing if it is safe to proceed is where monitoring becomes mission-critical.
This guide compares 9 canary deployment monitoring tools across platform compatibility, metric collection speed, alert latency, rollback automation, and total cost at scale. Each tool is evaluated on whether it can answer the core question every canary deployment demands: is this version safe to promote, or should it roll back now?
Quick Comparison: 9 Canary Deployment Monitoring Tools at a Glance
| Tool | Best For | Pricing Model | Native K8s? | Rollback Automation? |
|---|---|---|---|---|
| CubeAPM | Self-hosted unified metrics, traces, logs | $0.20/GB ingested | ✓ Yes | ✓ Via alerts + webhooks |
| Flagger | Kubernetes native progressive delivery | Free (open source) | ✓ Yes | ✓ Built-in |
| Argo Rollouts | GitOps-based canary rollouts | Free (open source) | ✓ Yes | ✓ Yes |
| Datadog | Managed multi-cloud monitoring | $15/host/mo + $31/host for APM | ✓ Yes | Via integrations |
| Prometheus + Grafana | Self-hosted metrics and dashboards | Free (open source) + infra cost | ✓ Yes | Manual or via Alertmanager webhooks |
| New Relic | Managed full stack observability | $0.40/GB beyond 100 GB free | Partial | Via integrations |
| Dynatrace | Enterprise AI-assisted analysis | Host-based, starts ~$74/host/mo | ✓ Yes | ✓ Davis AI-driven |
| Honeycomb | High cardinality event debugging | Free tier, Pro from $130/mo | ✓ Yes | Via custom integrations |
| Harness | CI/CD platform with native canary support | Free tier, Team from $100/mo | ✓ Yes | ✓ Built-in |
Pricing figures are from public rate cards as of early 2026. Actual cost depends on infrastructure scale, retention, user seats, and contract terms.
1. CubeAPM

CubeAPM is a self-hosted observability platform that runs inside your VPC or data center and provides unified metrics, distributed traces, logs, and real user monitoring. It collects telemetry via OpenTelemetry or vendor agents like Datadog, Prometheus, or New Relic, making it compatible with existing instrumentation during migration.
Key Features:
- Native Kubernetes metrics collection at pod, node, and service level
- Distributed tracing with automatic trace-to-log correlation
- Sub-second metric query latency even at TB scale
- Alert routing to Slack, PagerDuty, and webhooks for automated rollback triggers
- Unlimited retention
Pricing: $0.20/GB ingested. No per-host fees, no user seat charges, no separate costs for metrics vs traces vs logs. Runs on your infrastructure, so add compute and storage costs.
Pros:
- All canary signals (metrics, traces, errors, logs) in one unified platform
- Self-hosted deployment keeps telemetry data inside your cloud
- Predictable pricing with no surprise overages
- Fast migration from Datadog or New Relic using their existing agents
Cons:
- Requires BYOC or on-prem infrastructure
- Smaller integration ecosystem than SaaS incumbents
- Rollback automation requires custom webhook or CI/CD integration
Best for: Teams running Kubernetes canary deployments who need unified observability with full data control and predictable cost as ingestion scales.
2. Flagger
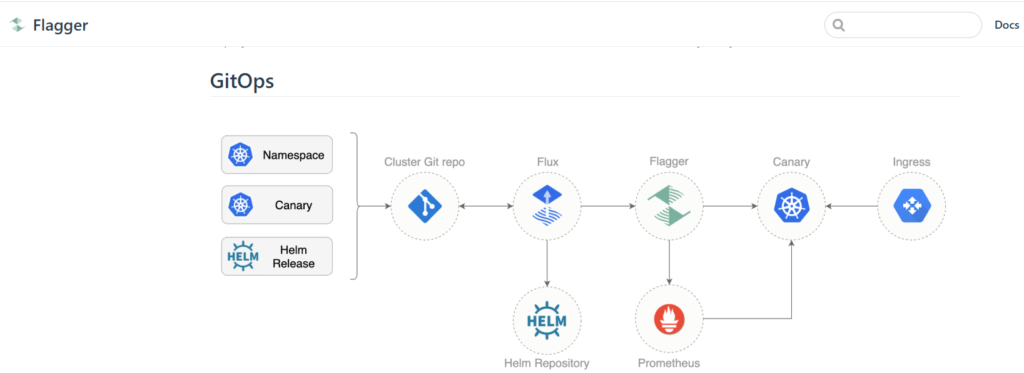
Flagger is a Kubernetes native progressive delivery tool built by Weaveworks. It automates canary analysis by running a series of conformance tests, metric checks, and webhooks, then promotes or rolls back based on success criteria. Flagger works with Istio, Linkerd, App Mesh, Contour, Gloo, Nginx, Traefik, and Open Service Mesh.
Key Features:
- Automated traffic shifting with configurable intervals
- Built-in metric checks via Prometheus queries
- Webhook support for external validation (load tests, smoke tests)
- Automatic rollback on failed checks
- Native integration with service mesh traffic management
Pricing: Free and open source. Infrastructure cost only.
Pros:
- Purpose-built for Kubernetes canary deployments
- Works with most service meshes and ingress controllers
- Declarative canary resource makes rollout strategy visible in Git
- Automatic rollback without manual intervention
Cons:
- Requires Prometheus or compatible metrics backend
- No built-in observability UI (relies on Grafana or external dashboards)
- Service mesh dependency adds complexity for teams not already using one
Best for: Kubernetes teams already using Prometheus and a service mesh who want automated progressive delivery with built-in rollback logic.
3. Argo Rollouts
Argo Rollouts is a Kubernetes controller that provides advanced deployment strategies including blue-green and canary with built-in analysis and progressive promotion. It is part of the Argo project family, which includes Argo CD for GitOps continuous delivery.
Key Features:
- Native Kubernetes CRDs for rollout strategy definition
- Canary with traffic splitting, metric analysis, and manual gates
- Integration with Prometheus, Datadog, New Relic, and Wavefront for metric queries
- Rollback on analysis failure or manual approval rejection
- Live dashboard UI for rollout status and analysis results
Pricing: Free and open source. Infrastructure cost only.
Pros:
- GitOps-friendly declarative rollout definitions
- Works with multiple metrics providers
- Strong community support and CNCF project maturity
- Dashboard provides real-time rollout visibility
Cons:
- Requires external metrics backend (Prometheus, Datadog, etc.)
- Analysis configuration can be verbose for complex metric queries
- No built-in distributed tracing or log correlation
Best for: Teams using GitOps workflows who want Kubernetes native canary automation with support for multiple observability backends.
4. Datadog
Datadog is a SaaS observability platform with infrastructure monitoring, APM, logs, RUM, and synthetic monitoring. It provides deep visibility into Kubernetes workloads and application performance, making it a common choice for canary deployment monitoring when combined with Flagger or Argo Rollouts.
Key Features:
- Real-time Kubernetes metrics at cluster, node, pod, and container level
- Distributed tracing with trace-to-metric correlation
- Custom metric queries for canary analysis
- Alert webhooks for rollback automation
- Native integration with Argo Rollouts and Flagger
Pricing: Infrastructure monitoring starts at $18/host/month for 15-month retention. APM is $42/host/month. Log ingestion is $0.10/GB plus $1.70/million events indexed. Prices from the Datadog pricing page.
For a 50-host Kubernetes cluster ingesting 5 TB/month of logs and traces:
- Infrastructure: 50 hosts × $18 = $900/month
- APM: 50 hosts × $42 = $2,100/month
- Logs: (5,000 GB × $0.10) + indexing = $500 + indexing costs
- Total: ~$3,500/month minimum before indexing, custom metrics, or RUM.
Pros:
- Comprehensive Kubernetes visibility with pod-level metrics
- Native integration with canary tools like Flagger and Argo
- 700+ integrations across cloud, container, and application stacks
- Fast query performance on high cardinality data
Cons:
- Per-host pricing compounds fast as clusters scale
- Log indexing charges are separate from ingestion
- SaaS only deployment model rules out on-prem or air-gapped environments
- Cost can spike during traffic surges if auto-scaling increases host count
Best for: Large engineering teams that need managed multi-cloud observability and can absorb per-host pricing at scale.
5. Prometheus + Grafana
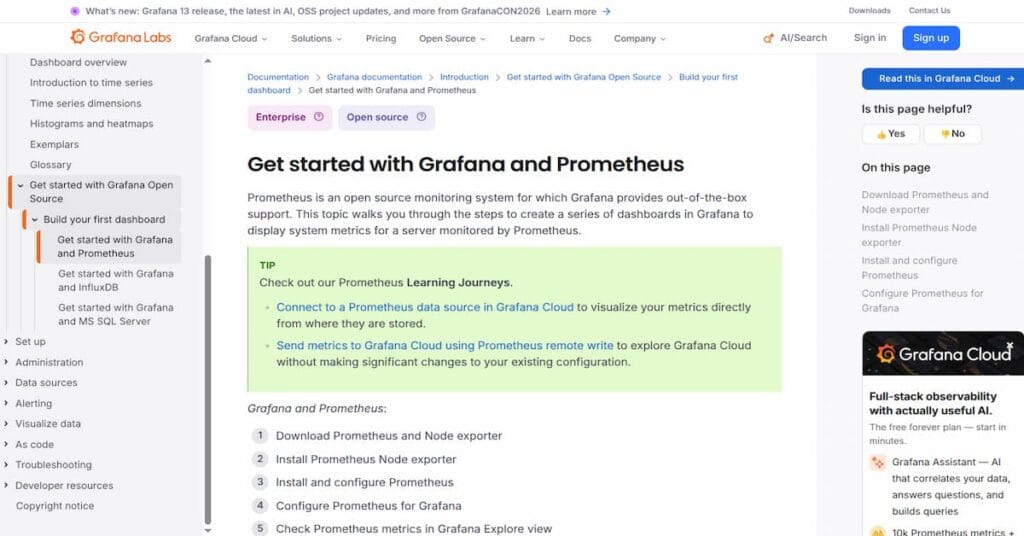
Prometheus is an open-source metrics collection and alerting system originally built at SoundCloud. Grafana is an open-source dashboarding and visualization platform. Together they form the most widely deployed self-hosted monitoring stack, especially in Kubernetes environments where Prometheus scrapes metrics from kubelet, kube state metrics, and application exporters.
Key Features:
- Pull-based metric collection with service discovery for Kubernetes
- PromQL query language for flexible metric aggregation
- Alertmanager for threshold-based alerting and webhook routing
- Grafana dashboards with templating and drill-down capability
- Native support in Flagger and Argo Rollouts for canary analysis
Pricing: Free and open source. Infrastructure cost depends on cluster size, metric cardinality, and retention period. For a 50-node cluster with 30-day retention, expect 200–400 GB storage and 4–8 vCPU + 16–32 GB RAM for Prometheus alone.
Pros:
- Industry-standard metrics stack with deep Kubernetes integration
- Full control over data retention and query performance
- No vendor lock-in or external dependency
- Large ecosystem of exporters and pre-built dashboards
Cons:
- Requires operational overhead for deployment, scaling, and upgrades
- High cardinality metrics can degrade query performance
- No built-in distributed tracing or log correlation
- Alert routing and rollback automation require custom scripting
Best for: Teams with Kubernetes expertise who want full control over metrics infrastructure and are comfortable managing the operational burden.
6. New Relic

New Relic is a SaaS observability platform offering APM, infrastructure monitoring, logs, distributed tracing, RUM, and synthetic monitoring. It uses an ingest-based pricing model where all telemetry (metrics, events, logs, traces) is billed by data volume rather than per host or per user.
Key Features:
- Kubernetes cluster explorer with pod, node, and workload views
- Distributed tracing with automatic service maps
- NRQL query language for custom metric analysis
- Alert webhooks for CI/CD rollback triggers
- Integration with Argo Rollouts for canary metric validation
Pricing: Free tier includes 100 GB/month ingestion. Beyond that, $0.40/GB for additional data. Prices from New Relic pricing page.
For a 50-host cluster ingesting 5 TB/month:
- Data ingestion: (5,000 GB – 100 GB free) × $0.40 = $1,960/month
- Users: Full platform user seats are $99/user/month if required for dashboard access
Pros:
- Unified ingest model simplifies cost forecasting vs. per-host pricing
- Strong Kubernetes observability with automatic instrumentation
- NRQL enables flexible custom queries for canary metric validation
- Generous free tier for small workloads
Cons:
- NRQL creates query language lock-in
- SaaS only deployment model
- Cost rises sharply as ingestion volume scales
- User seat fees can add high cost if multiple team members need access
Best for: Teams that prefer managed observability and want unified metrics, traces, and logs under one ingest-based pricing model.
7. Dynatrace
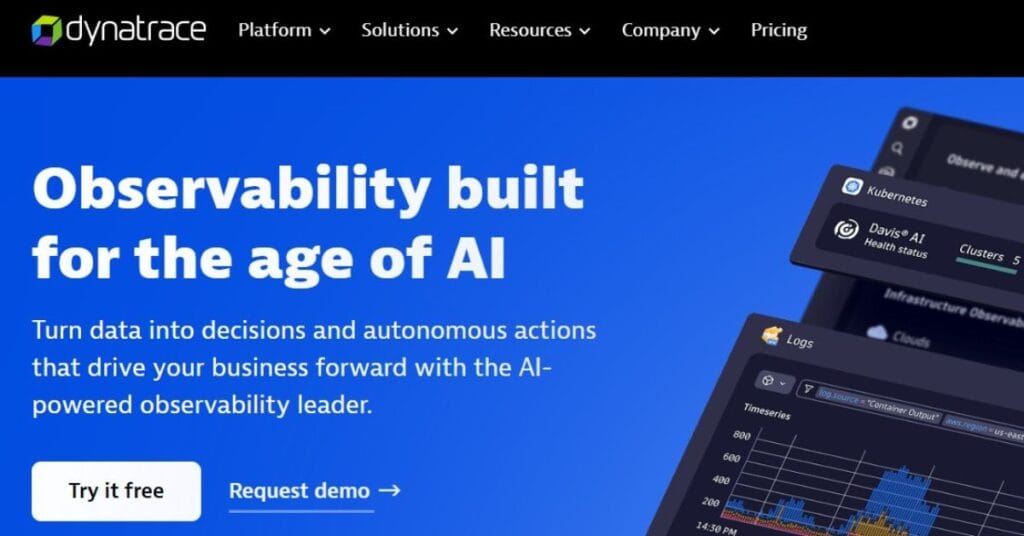
Dynatrace is an enterprise observability platform with AI-driven root cause analysis, full stack monitoring, and automatic baseline learning. Its Davis AI engine detects anomalies in real time and correlates them across infrastructure, application, and user experience layers.
Key Features:
- Automatic Kubernetes discovery and dependency mapping
- AI-based anomaly detection with automatic baselines
- Distributed tracing with PurePath technology
- Real-time metric ingestion with sub-minute granularity
- Native integration with deployment tools for canary validation
Pricing: Host-based pricing. Full stack monitoring starts at approximately $74/host/month. Prices vary by contract and feature set. Verify current rates at the Dynatrace pricing page.
Pros:
- Davis AI reduces alert noise and accelerates root cause detection
- Automatic instrumentation for most languages and frameworks
- Strong support for hybrid and multi-cloud environments
- Self-hosted deployment option available
Cons:
- Per-host pricing is among the highest in this comparison
- Complex licensing model with multiple SKU tiers
- Davis AI requires time to learn baselines and may generate false positives early
- Overkill for small teams or single cluster deployments
Best for: Enterprise teams with complex multi-cloud Kubernetes environments who need AI-assisted anomaly detection and can justify premium pricing.
8. Honeycomb
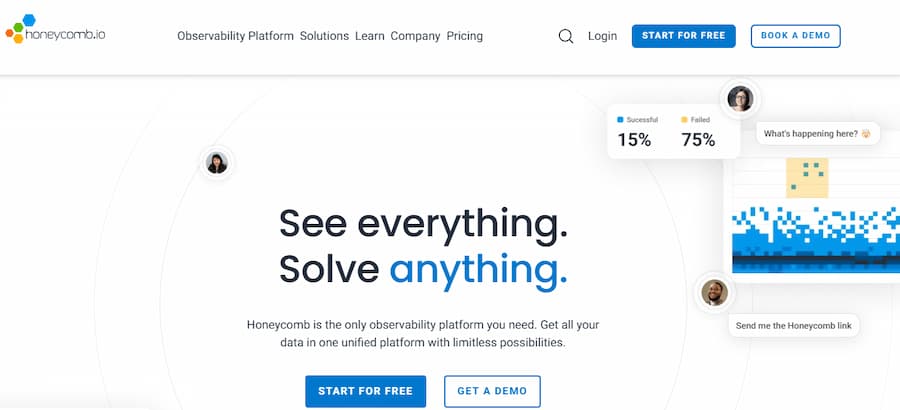
Honeycomb is an observability platform designed for high cardinality event data and distributed tracing. It allows engineers to query arbitrary fields in traces and events without predefined dashboards, making it well-suited for debugging production issues during canary rollouts.
Key Features:
- High cardinality event storage with fast arbitrary field queries
- Distributed tracing with BubbleUp for automatic anomaly highlighting
- Query language designed for ad hoc exploration
- Real-time streaming ingestion with low latency
- Integration with CI/CD for canary metric validation via API
Pricing: Free tier includes 20 million events/month. Pro plan starts at $130/month. Enterprise pricing is custom. Pricing details at the Honeycomb pricing page.
Pros:
- Purpose-built for high cardinality debugging
- Fast query performance even on billions of events
- BubbleUp automatically surfaces outlier fields in traces
- Strong developer experience for ad hoc investigation
Cons:
- Not designed as a general-purpose metrics platform
- No built-in infrastructure monitoring (needs Prometheus or similar)
- Pricing scales with event volume, which can grow fast in high-traffic systems
- Smaller ecosystem vs Datadog or New Relic
Best for: Engineering teams that prioritize deep trace debugging and high cardinality event analysis during canary validation.
9. Harness
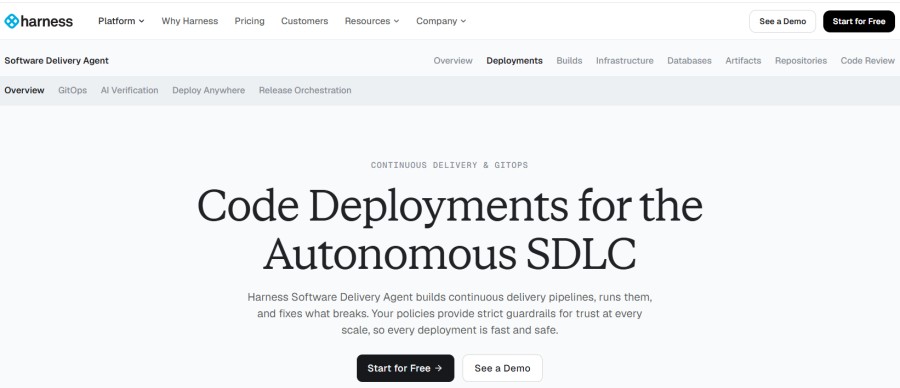
Harness is a CI/CD platform with native support for canary deployments, blue-green, and rolling updates. It includes built-in deployment verification that queries metrics from Prometheus, Datadog, New Relic, AppDynamics, or custom providers to validate canary health before promotion.
Key Features:
- Declarative canary pipelines with traffic splitting and metric gates
- Integration with Kubernetes, ECS, Lambda, and VM deployments
- Automated rollback on metric threshold violations
- Machine learning-driven anomaly detection for metric validation
- GitOps support via Harness GitOps (based on Argo CD)
Pricing: Free tier for up to 5 services. Team plan starts at $100/month per developer. Enterprise pricing is custom. Pricing details at Harness pricing page.
Pros:
- Unified CI/CD and deployment verification in one platform
- Native canary support without requiring separate tools like Flagger
- Works with multiple metrics backends
- ML-driven deployment verification reduces manual analysis
Cons:
- Requires adopting Harness as primary CI/CD platform
- Pricing scales per developer seat, which can be expensive for large teams
- Limited observability depth vs dedicated APM platforms
- Deployment verification relies on external metrics providers
Best for: Teams consolidating CI/CD and canary deployment automation who want built-in rollback logic without adding Flagger or Argo Rollouts.
How to Choose the Right Canary Deployment Monitoring Tool
Choosing a canary deployment monitoring tool depends on five primary factors: deployment platform, metric backend compatibility, rollback automation requirements, observability depth, and cost at scale.
Deployment Platform Compatibility
If you run Kubernetes, prioritize tools with native Kubernetes support and service mesh compatibility. Flagger and Argo Rollouts are purpose-built for Kubernetes canary deployments and integrate directly with Istio, Linkerd, and other service meshes. CubeAPM, Datadog, Prometheus, and Dynatrace all provide deep Kubernetes observability but require integration with a separate canary controller.
For non-Kubernetes deployments (VM-based, serverless, or PaaS), Harness and Datadog offer broader platform support. New Relic and Honeycomb work across platforms but require custom CI/CD integration for rollback automation.
Metric Backend and Query Flexibility
Canary analysis requires querying real-time metrics to validate success criteria. Prometheus + Grafana gives full control over metric collection and PromQL queries but requires self-hosting. Datadog and New Relic provide managed metric backends with their own query languages (Datadog Query Language and NRQL). CubeAPM supports OpenTelemetry and Prometheus metric formats with fast query performance on high cardinality data.
If you already run Prometheus, Flagger and Argo Rollouts integrate natively. If you need vendor flexibility, Argo Rollouts supports Prometheus, Datadog, New Relic, and Wavefront as metric providers.
Rollback Automation Requirements
Automatic rollback on metric threshold violations is critical for reducing blast radius during failed canaries. Flagger, Argo Rollouts, and Harness provide built-in rollback automation. Datadog, New Relic, CubeAPM, and Honeycomb require webhook or API integration with your CI/CD pipeline to trigger rollbacks based on alert conditions.
Prometheus + Grafana can trigger rollbacks via Alertmanager webhooks, but the integration requires custom scripting. Dynatrace provides AI-driven anomaly detection that can trigger rollbacks via integrations, but setup complexity is higher.
Observability Depth: Metrics, Traces, Logs
Canary deployments benefit from unified observability across metrics, distributed traces, and logs. CubeAPM, Datadog, New Relic, and Dynatrace provide full-stack observability in one platform. Prometheus + Grafana covers metrics and requires separate tools for tracing (Jaeger, Tempo) and logs (Loki, Elasticsearch). Honeycomb focuses on traces and high-cardinality events but is not a general-purpose metrics platform.
If you need to correlate canary metrics with trace latency and error logs in real time, CubeAPM, Datadog, or New Relic simplify this workflow. If you prefer modular open source tools, combine Prometheus, Tempo, and Loki with Grafana for unified dashboards.
Cost at Scale
Cost structure varies widely. CubeAPM charges $0.20/GB ingested with no host or user fees. Datadog and Dynatrace use per-host pricing that compounds as clusters scale. New Relic uses ingest-based pricing at $0.40/GB beyond the free tier. Prometheus + Grafana, Flagger, and Argo Rollouts are free but incur infrastructure cost.
For a 50 host Kubernetes cluster ingesting 5 TB/month, estimated monthly cost:
- CubeAPM: (5,000 GB × $0.20) + infrastructure = ~$1,050 + infra
- Datadog: (50 hosts × $60) + logs = ~$3,500+
- New Relic: (4,900 GB × $0.40) = ~$1,960
- Prometheus + Grafana: Free software + $300–$600 infrastructure
- Flagger + Argo Rollouts: Free software + existing metric backend cost
This estimate models canary metric collection, APM traces, and log ingestion. Actual costs vary based on retention, indexing, user seats, and contract terms. Always verify current pricing with each vendor.
Canary deployments require real-time metrics, fast alert latency, and reliable rollback automation. The best tool depends on whether you prioritize managed SaaS convenience, self-hosted data control, or purpose-built canary automation. Teams already running Kubernetes with Prometheus should start with Flagger or Argo Rollouts. Teams consolidating observability should evaluate CubeAPM, Datadog, or New Relic. Teams with enterprise scale and budget should assess Dynatrace for AI-driven validation.
Disclaimer: The information in this article reflects the latest details available at the time of publication and may change as technologies and products evolve. Features, pricing, and plan limits can change over time. Always verify the latest information directly with the vendor before making purchasing or deployment decisions.
Frequently Asked Questions
Does canary deployment require monitoring?
Yes. Canary deployments depend on real time monitoring to validate that the new version performs at least as well as the current stable version before promoting it to full production traffic.
Which DevOps tool is best for canary deployment?
For Kubernetes, Flagger and Argo Rollouts are purpose built for canary automation. For unified CI/CD and deployment verification, Harness provides native canary support. For observability, CubeAPM, Datadog, and Prometheus provide the metrics needed to validate canary health.
How do you test a canary deployment?
Canary testing involves routing a small percentage of traffic to the new version, collecting metrics on latency, error rate, and resource usage, comparing those metrics to the stable version, and either promoting the canary to full traffic or rolling back based on success criteria.
What are the disadvantages of canary deployment?
Canary deployments add complexity to CI/CD pipelines, require real time monitoring and metric validation, and can slow down release velocity if analysis takes too long. They also require traffic splitting capability, which may need a service mesh or load balancer configuration.
Can you automate canary rollback?
Yes. Tools like Flagger, Argo Rollouts, and Harness provide built in automatic rollback on metric threshold violations. Platforms like CubeAPM, Datadog, and New Relic can trigger rollback via webhooks or API calls when alerts fire.
What metrics should you monitor during a canary deployment?
Critical canary metrics include HTTP error rate (4xx and 5xx), request latency (p50, p95, p99), throughput (requests per second), CPU and memory usage, and database query latency. Custom business metrics like checkout success rate or login failure rate are also important.
Do you need a service mesh for canary deployments?
Not always. Service meshes like Istio and Linkerd simplify traffic splitting and provide fine grained control, but you can also implement canary deployments using Kubernetes native traffic management, Nginx, or cloud load balancers with weighted routing rules.