Flask monitoring tools have become essential as Python powers modern APIs and microservices. The global observability market is expected to reach $28.17 billion by 2035, up from $19.8 billion. Yet, teams still struggle with unpredictable APM bills, limited data retention, and complex agent setups, so teams seek simpler, more transparent Flask monitoring solutions.
CubeAPM is the best Flask monitoring tool provider, purpose-built for developers who need visibility without vendor lock-in. With smart sampling, OpenTelemetry-native ingestion, and flat $0.15/GB pricing, CubeAPM helps Flask teams monitor performance, errors, and database latency at scale while saving up to 70% in monitoring costs.
In this article, we’ll explore the best Flask monitoring tools, comparing features, pricing, and best use cases for modern Python applications.
8 Best Flask Monitoring Tools
- CubeAPM
- Datadog
- New Relic
- Dynatrace
- Uptrace
- ScoutAPM
- SigNoz
- AppSignal
What is a Flask Monitoring Tool?
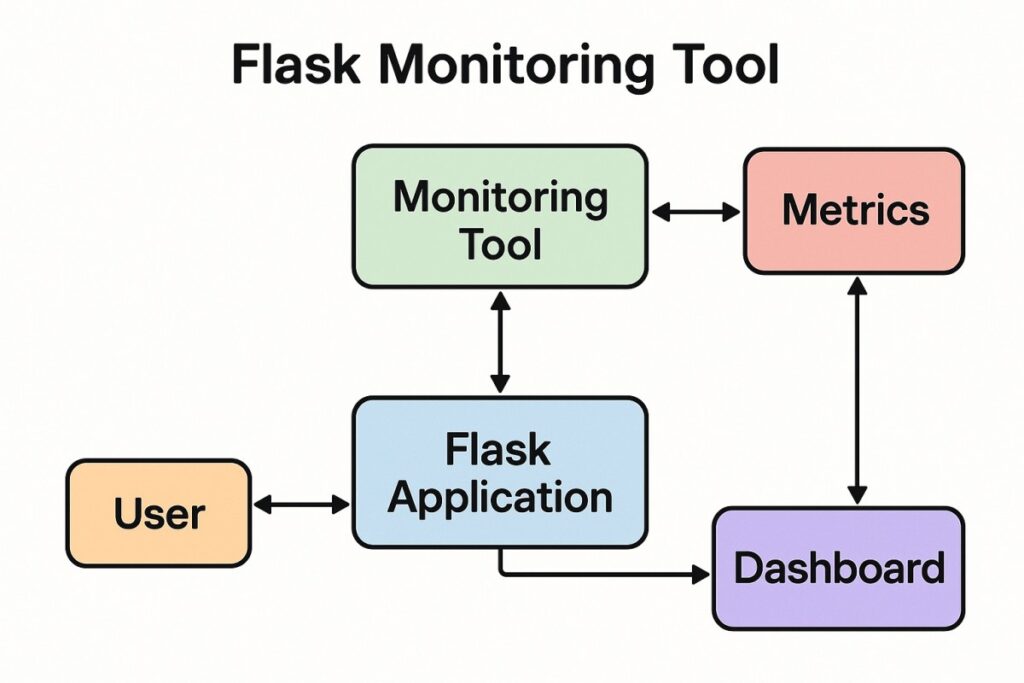
Flask is a lightweight and flexible Python web framework used to build APIs, microservices, and backend applications. Its simplicity makes it ideal for startups and enterprises that prioritize speed, modularity, and scalability. However, as Flask apps scale, it becomes difficult to manually track performance bottlenecks, latency spikes, and dependency errors across distributed environments. This is where Flask monitoring tools come in.
A Flask monitoring tool continuously collects, analyzes, and visualizes key performance metrics, logs, and traces from Flask-based applications. It enables developers to observe request latency, database query time, memory and CPU usage, and error rates in real time — helping teams identify slow endpoints, failed transactions, or degraded user experiences before they impact customers.
Flask monitoring is crucial for modern businesses because it helps:
- Detect and resolve bottlenecks early: Identify slow routes, misconfigured middleware, or blocking I/O operations before they escalate.
- Correlate across the stack: Link application traces to database queries, logs, and infrastructure metrics for full MELT (Metrics, Events, Logs, Traces) visibility.
- Optimize user experience: Monitor real-user sessions and frontend metrics to ensure consistent response times.
- Reduce operational costs: Use smart sampling and automated alerts to manage resource usage efficiently.
- Enhance reliability and compliance: Maintain uptime SLAs and adhere to data localization or privacy regulations through secure telemetry handling.
Example: Monitoring a Flask API with CubeAPM
Let’s consider a company running an e-commerce Flask API with multiple endpoints — /checkout, /payment, and /inventory. Using CubeAPM, the team instruments their Flask app with the OpenTelemetry Python SDK, enabling automatic trace and metric collection. When a user initiates a checkout, CubeAPM captures:
- Request trace: End-to-end latency across Flask routes, payment services, and database calls.
- Logs: Contextual log entries linked to each trace span, showing API errors or failed external calls.
- Metrics: CPU, memory, and I/O utilization for the Flask container via the Infrastructure Monitoring module.
- User session data: Captured via Real User Monitoring (RUM) to visualize front-end latency.
- Error tracking: Automatically grouped by exception type with stack traces in the Error Tracking dashboard.
All of this data flows into CubeAPM’s unified observability layer, where smart sampling ensures only high-value traces (those with high latency or errors) are stored — drastically reducing cost while preserving diagnostic accuracy. The result is real-time visibility into every request, faster troubleshooting, and predictable ingestion pricing at $0.15/GB — making CubeAPM the most efficient way to monitor Flask applications at scale.
Why Teams Choose Different Flask Monitoring Tools
Cost Predictability & Scaling Spikes
Flask applications often scale dynamically with Kubernetes or serverless platforms, making per-host or per-GB billing unpredictable. Many engineers on Reddit and G2 note that legacy APM tools inflate costs by charging for logs, traces, and user licenses separately, leading to monthly surprises. Teams now prefer flat-rate or usage-based models that remain stable even as request volume spikes.
OpenTelemetry-First & Vendor Neutrality
Flask integrates cleanly with opentelemetry-instrumentation-flask, allowing developers to trace requests without proprietary agents. As OTel becomes a standard, teams choose monitoring tools that support native OpenTelemetry ingestion, ensuring they can switch vendors or self-host collectors without re-instrumenting their apps.
Unified Correlation of Routes, Logs & Metrics
A typical Flask endpoint spans databases, Redis caches, and async jobs. Tools that correlate traces, logs, and metrics provide a single timeline from request to dependency. This 360° visibility helps pinpoint slow routes or broken queries faster, reducing MTTR and simplifying root-cause analysis.
Async & Background Job Visibility
Flask often relies on Celery or RQ for background tasks. Engineers now prefer tools that automatically trace these jobs, link them back to originating requests, and visualize task latency. Platforms with Celery instrumentation or distributed tracing integrations eliminate blind spots in async pipelines.
Multi-Cloud & Data Residency Flexibility
With Flask apps running across AWS, GCP, or private clouds, observability tools must adapt to multi-cloud or on-prem deployments. Enterprises prioritize Bring-Your-Own-Cloud (BYOC) options to meet GDPR or HIPAA compliance while avoiding data egress fees. CubeAPM and similar OTEL-native tools provide self-host or hybrid options for secure telemetry handling.
8 Best Flask Monitoring Tools
1. CubeAPM
Overview
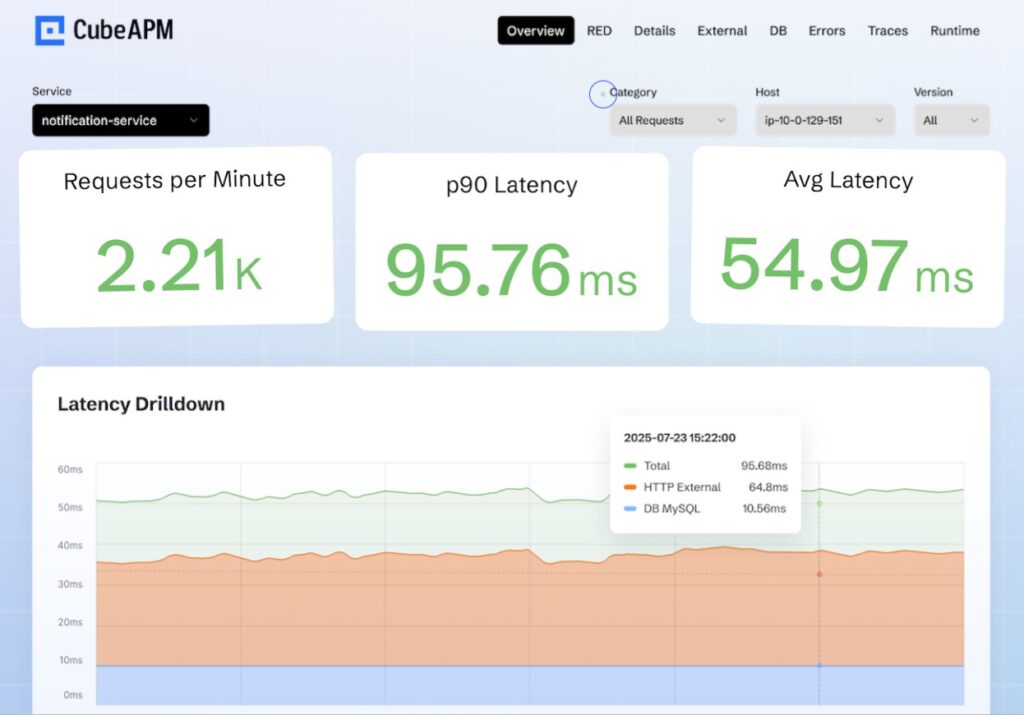
CubeAPM is known for delivering full-stack observability that fits perfectly into modern Flask-based architectures. Built around OpenTelemetry and MELT (Metrics, Events, Logs, Traces), it provides developers with real-time visibility into every Flask endpoint, database call, and request span without complex agent setups. With 800+ integrations, CubeAPM is rapidly becoming a go-to solution for Flask developers seeking scalable, transparent monitoring that works across on-prem, hybrid, and cloud environments.
Key Advantage
Context-aware Smart Sampling: captures only meaningful Flask traces (errors, latency spikes, or anomalies) to optimize cost and ensure critical data is never lost.
Key Features
- Automatic Flask Instrumentation: Seamlessly collects traces, metrics, and logs from Flask routes and WSGI servers using OpenTelemetry.
- Full MELT Visibility: Correlates Flask app traces with infrastructure, logs, and database spans for unified troubleshooting.
- Error & Exception Tracking: Detects Python stack traces, logs context-rich errors, and auto-groups recurring issues.
- Real User Monitoring (RUM): Tracks real user interactions and latency in front-end applications consuming Flask APIs.
- Synthetic Monitoring: Simulates API requests to Flask endpoints to ensure uptime and consistent response times.
Pros
- Predictable and transparent pricing model
- Instant integration with OpenTelemetry collectors
- Strong Slack/WhatsApp support for faster incident response
- Unified view for metrics, traces, and logs
Cons
- Less ideal for teams seeking tightly managed off-prem observability tools
- Focused purely on observability, not on broader cloud security or compliance monitoring
CubeAPM Pricing at Scale
CubeAPM uses a transparent pricing model of $0.15 per GB ingested. For a mid-sized business generating 45 TB (~45,000 GB) of data per month, the monthly cost would be ~$7,200/month*.
*All pricing comparisons are calculated using standardized Small/Medium/Large team profiles defined in our internal benchmarking sheet, based on fixed log, metrics, trace, and retention assumptions. Actual pricing may vary by usage, region, and plan structure. Please confirm current pricing with each vendor.
Tech Fit
CubeAPM is optimized for Flask, Django, and FastAPI applications, but also supports Node.js, Java, Go, and .NET through OpenTelemetry SDKs. It integrates seamlessly with Kubernetes, Docker, and AWS/GCP/Azure for unified application and infrastructure observability.
2. Datadog
Overview
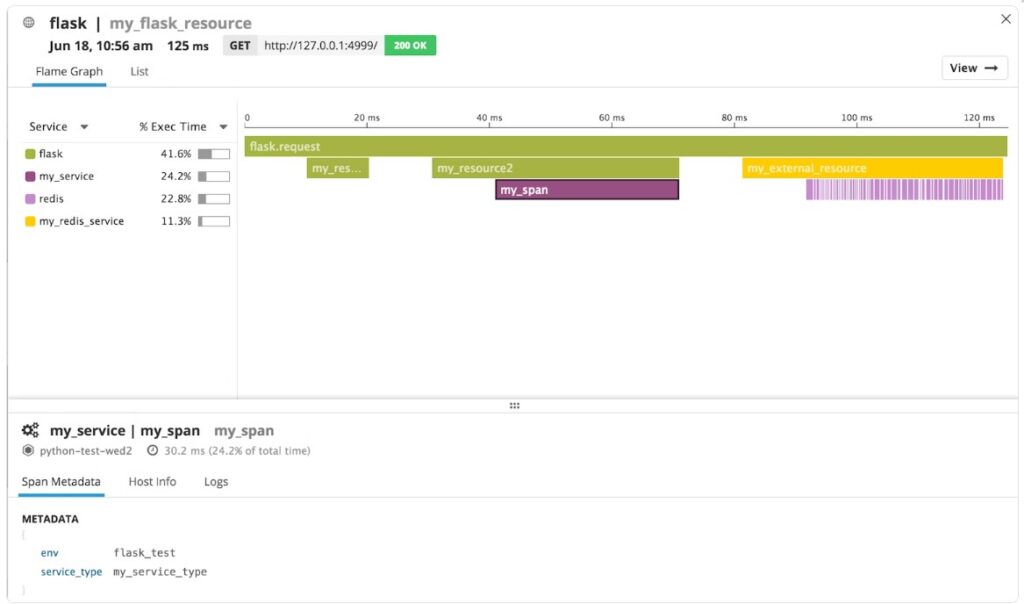
Datadog is a widely adopted observability suite across enterprises, known for its deep integrations, infrastructure + APM cohesion, and mature SaaS telemetry ecosystem. In the Flask world, Datadog helps developers instrument Flask routes, parse SQL and external calls, and correlate Flask request latency with infrastructure. Its dominant market presence positions it as a go-to for teams needing full-stack observability backed by a large vendor ecosystem.
Key Advantage
Full-stack correlation at scale — connects Flask traces, logs, metrics, infrastructure, and user performance across hybrid clouds.
Key Features
- Automatic Flask tracing: instrument Flask apps with
ddtraceto capture request spans, dependencies, and route-level metrics. - Code-level profiling: a continuous profiler for Python lets you inspect method-level CPU, memory hotspots, and I/O breakdowns.
- Service map & dependency graph: visualize how your Flask app interacts with databases, caches, and external APIs.
- Synthetic & API tests: define synthetic checks for Flask endpoints to detect latency regressions.
- Log-trace correlation: link logs and errors to trace spans in a unified view for Flask error debugging.
Pros
- Comprehensive observability across layers
- Strong support and ecosystem of plugins
- Rich visualizations and dashboards out of the box
- Mature alerting, anomaly detection, and integrations
Cons
- Can be costly for smaller teams at scale
Datadog Pricing at Scale
Datadog charges differently for different capabilities. APM starts at $31/month; infra starts at $15/month; logs start at $0.10/GB, and so on. For a mid-sized business ingesting around 45 TB (~45,000 GB) of data per month, the cost would come around $27,475/month*.
Tech Fit
Datadog works well with Flask and other Python frameworks (Django, FastAPI), and supports many other languages (Java, Node.js, Go). It excels in environments combining infrastructure, network, and security layers, especially in hybrid or cloud-native deployments.
3. New Relic
Overview
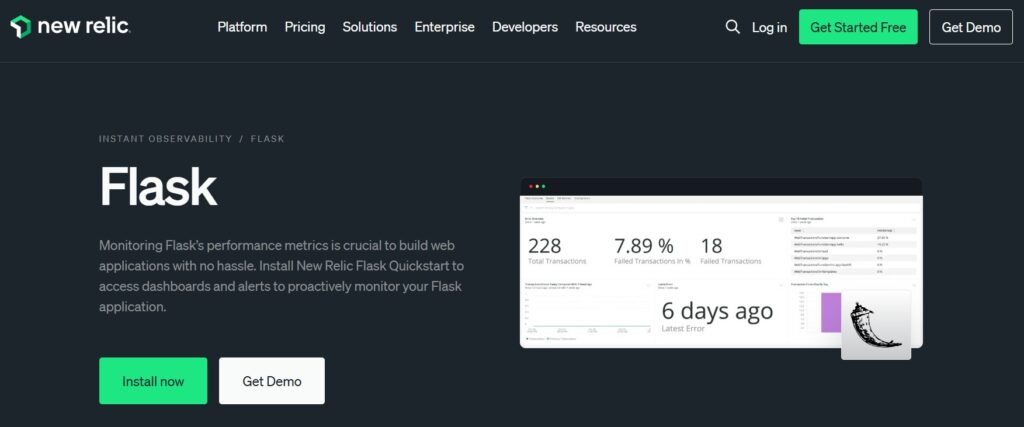
New Relic is a long-standing full-stack observability platform that integrates cleanly with Flask via the Python agent and a ready-made Flask quickstart (dashboards + alerts). It instruments WSGI/ASGI entry points, surfaces route latency, database calls, and external services, and layers these into curated dashboards for faster troubleshooting in production.
Key Advantage
Mature Python/Flask Instrumentation — proven agent with WSGI/ASGI hooks and prebuilt quickstart content tailored for Flask teams.
Key Features
- Automatic Flask Capture: Collects request and route transactions, database queries, external calls, and error traces using the Python agent.
- WSGI/ASGI Entry-Point Decorators: Provides control through
wsgi_applicationandasgi_applicationAPIs for manual wrapping when needed. - Instant Observability (Flask Quickstart): Comes with ready-to-use dashboards, alerts, and event-loop diagnostics for Flask applications.
- Service Maps & Dependency Views: Visualizes how a Flask service communicates with databases, caches, and downstream APIs.
- Alerting & SLO Workflows: Connects route errors or latency spikes to notifications and reliability targets across teams.
Pros
- Established ecosystem and enterprise-grade stability
- Excellent developer experience for Python and Flask
- Prebuilt dashboards and curated observability templates
- Unified coverage for APM, infrastructure, logs, and RUM
Cons
- Data ingestion and user licensing costs scale quickly for large Flask apps
- No self-hosting or Bring-Your-Own-Cloud options for data control; only SaaS-based
New Relic Pricing at Scale
New Relic’s billing is based on data ingested, user licenses, and optional add-ons. The free tier offers 100 GB of ingest per month, then it costs $0.40 per GB after that. For a business ingesting 45 TB of logs per month, the cost would come around $25,990/month*.
Tech Fit
New Relic is ideal for Flask and broader Python stacks (like Django and FastAPI) running on Gunicorn or uWSGI, and it performs well in mixed-language, enterprise environments requiring unified observability across AWS, Azure, and GCP.
4. Dynatrace

Overview
Dynatrace is an enterprise observability platform known for its OneAgent auto-instrumentation, deep topology mapping, and Davis® AI for automatic root-cause analysis. For Flask teams, it traces requests end-to-end (route → DB → external calls → infrastructure), visualizes service flows, and layers SLOs and anomaly detection on top—making it a strong fit for complex, microservice-heavy Python environments.
Key Advantage
Causation-driven Davis® AI pinpoints the most likely root cause across Flask services, databases, and infrastructure without manual correlation.
Key Features
- OneAgent Auto-Instrumentation for Flask: Captures request spans, database calls, and external HTTP interactions from Flask apps with minimal setup.
- Python Support Matrix (Flask 1.1.2+): Comprehensive coverage for popular Python libraries like SQLAlchemy, Celery, and async frameworks.
- Service Flow & PurePaths: Visualizes end-to-end transactions from Flask routes through dependent services for rapid root-cause analysis.
- Kubernetes & Cloud Runtime Visibility: Supports operator-based deployment across clusters with automated tagging and contextual correlation.
- SLOs & Anomaly Detection: Defines route-level objectives and proactively flags regressions using Dynatrace’s AI engine.
Pros
- Strong end-to-end tracing powered by AI-assisted insights
- Rich topology mapping and dependency visualization
- Excellent Kubernetes and hybrid-cloud integration
- Robust Python/Flask framework support
Cons
- Pricing grows quickly due to host-hour and data-based billing
- Steep learning curve, especially for new users
Dynatrace Pricing at Scale
Dynatrace charges:
- Full stack: $0.01/8 GiB hour/month or $58/month/8GiB host
- Log Ingest & process: $0.20 per GiB
For a similar 45 TB (~45,000 GB/month) volume, the cost would be $21,850/month*.
Tech Fit
Best for Flask applications running in Kubernetes, multi-cloud, or enterprise ecosystems that demand automated root-cause analysis and continuous optimization. It also excels in mixed technology environments (Java, Node.js, .NET, Go) where unified monitoring and AI-powered insights are essential.
5. Uptrace
Overview
Uptrace is an OpenTelemetry-native observability platform that fits naturally into Flask stacks: you instrument your app with the OTel Flask libraries, export via OTLP/HTTP, and analyze unified traces, logs, and metrics in one UI. Teams choose it for its developer-friendly guides, service graphs, and usage-based billing that includes budget caps and volume discounts, available in cloud or self-managed deployments.
Key Advantage
OTel-first Flask instrumentation: fast setup with opentelemetry-instrumentation-flask and a native OTLP pipeline to Uptrace’s unified backend.
Key Features
- OTel Flask Integration: Auto-captures route spans, attributes, DB/HTTP dependencies, and context propagation using OTel and the Uptrace exporter.
- Trace–Log–Metric Unification: Troubleshoot a slow Flask endpoint in a single timeline that links spans, logs, and PromQL-style metrics.
- Service Graph & Dependency Maps: Visualize how your Flask service talks to databases, caches, and external APIs.
- Alerting & Monitors: Create metric and error monitors with notifications via Slack, Telegram, or email to catch regressions early.
- Step-by-Step Flask Guides: Practical walkthroughs for instrumenting, exporting, and validating telemetry for production Flask apps.
Pros
- OpenTelemetry-native and vendor-neutral
- Unified spans, logs, and metrics with clear Flask guides
- Budget caps and automatic volume discounts
- Cloud or self-managed deployment options
Cons
- Metrics are billed by active time series, so the total cost depends on cardinality
- Self-hosting introduces operational overhead for storage/backing services
Uptrace Pricing at Scale
Uptrace’s official pricing lists Traces & Logs at $0.08 per GB and Metrics at $0.01 per active time series per hour, with data retention of around 15 days on the base plan. For a mid-sized Flask environment, the cost will come down to $5,600/month*.
Tech Fit
Well-suited for Flask and broader Python stacks that want OpenTelemetry from day one, plus teams comfortable with usage-based ingest and (optionally) operating their own collectors/backing stores. Works across Kubernetes and major clouds when you prefer open standards and flexible deployment choices.
6. ScoutAPM
Overview
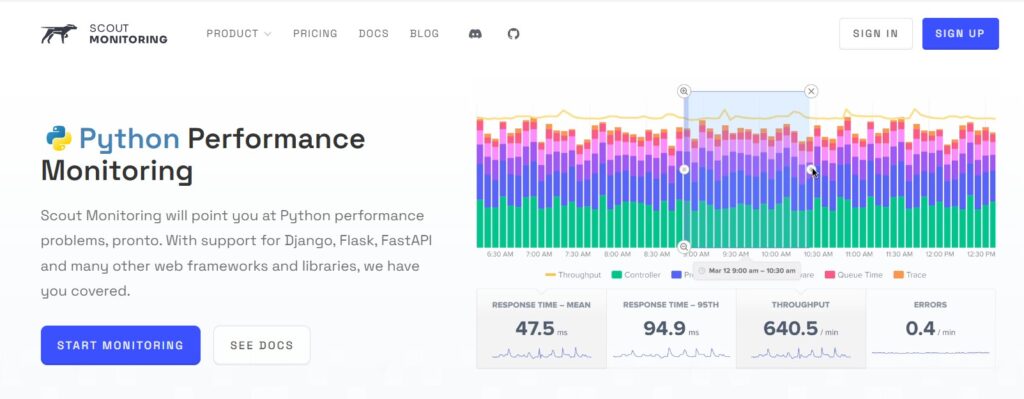
ScoutAPM focuses on developer-centric APM for Python and Flask, giving code-level visibility with minimal setup. Its Python agent hooks into Flask and common libraries to surface slow endpoints, N+1 queries, and memory bloat, making it popular with lean teams that want fast feedback without running a full observability stack.
Key Advantage
Code-level bottleneck detection — pinpoints slow views, N+1 queries, and memory hotspots in Flask so engineers can fix the exact line of code.
Key Features
- Flask agent integration:
scout-apmattaches to Flask to capture routes, timing, and transaction traces. - SQLAlchemy tracing: Instruments ORM calls to expose slow queries and N+1 patterns.
- Async/background jobs: Supports Celery/RQ to trace work happening off the request path.
- Error & log context: Optional logging agent links Python logs and exceptions to traces.
- Deploy & endpoint insights: Highlights regressions by deploy and flags endpoints with rising latency.
Pros
- Lightweight installation and fast time to value
- Strong Python/Flask focus with practical docs and examples
- Useful memory, SQL, and N+1 diagnostics
- Works well for small to mid-sized Flask apps
Cons
- Documentation needs improvement
- No self-hosting
ScoutAPM Pricing at Scale
Scout APM uses tiered, transaction-based pricing, not per-GB or per-host billing. The Mid-size plan is $99/month and the Large plan is $299/month, each including higher transaction volumes as you scale. Costs grow by upgrading plans rather than with raw telemetry size, making pricing predictable for application-heavy workloads. At scale, teams typically move to the Large tier once transaction volume exceeds the mid-size limits.
Tech Fit
Best for Flask (and other Python frameworks like Django) where teams want code-first APM, SQL visibility, and simple setup. A strong fit for Heroku and containerized apps that don’t need heavyweight, enterprise observability features.
7. SigNoz
Overview
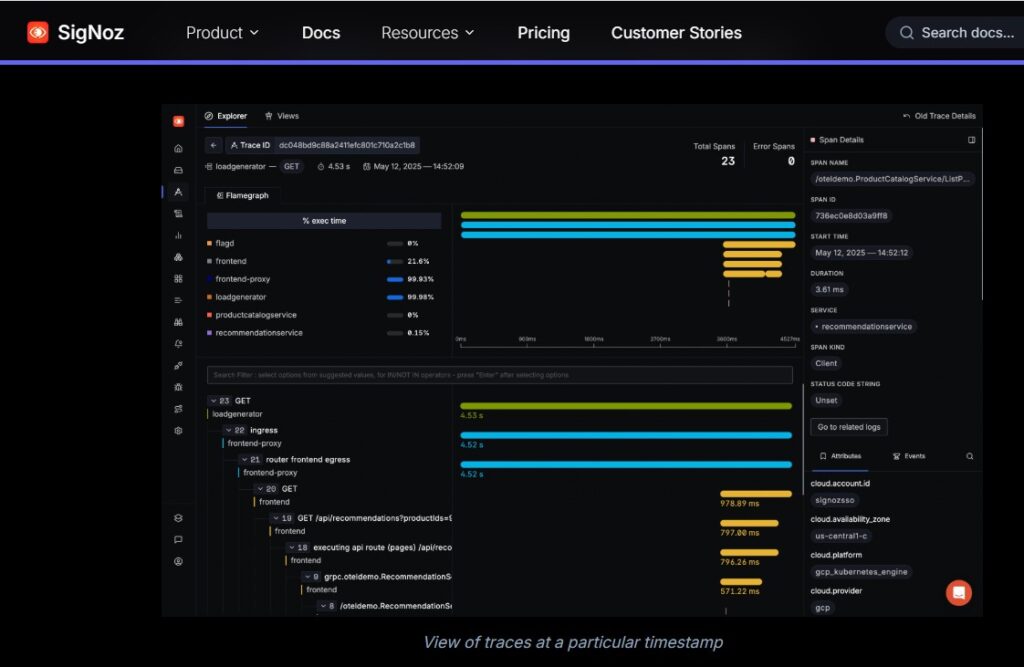
SigNoz is an OpenTelemetry-native observability platform that fits naturally into Flask stacks. You instrument Flask with OTel, ship data via OTLP, and analyze traces, logs, and metrics in one UI. With cloud and self-host options, SigNoz appeals to teams that want standards-based Flask monitoring, clear RED metrics, flame graphs, and service dependency views without proprietary agents.
Key Advantage
OTel-first Flask instrumentation — quick setup with OpenTelemetry for route-level spans, DB/HTTP dependencies, and context propagation across services.
Key Features
- Flask OTel auto-instrumentation: Capture route transactions, errors, DB calls, and external HTTP spans with context propagation.
- Trace–log–metric correlation: Jump from a slow Flask endpoint to its related spans, logs, and resource metrics in one timeline.
- RED metrics & flame graphs: Visualize request rate, errors, duration, and drill into stack frames to pinpoint code paths.
- Service graph & dependency map: Understand how your Flask service talks to databases, caches, and downstream APIs.
- Alerting & notifications: Create monitors on latency/error thresholds with Slack, email, and webhook integrations.
Pros
- OpenTelemetry-native and vendor-neutral
- Clean Flask guides and quickstarts
- Works in cloud or self-hosted modes
- Good end-to-end correlation for Python stacks
Cons
- Set up and operations overhead when self-hosting
- Fewer integrations
SigNoz Pricing at Scale
SigNoz Cloud bills logs/traces as per usage; around $0.30 per GB for ingested traces/logs, and $0.10/GB for metrics, plus you may wish to pay extra for add-ons. Using our 45 TB scenario, the cost could be $16,000/month*.
Tech Fit
Well-suited for Flask and broader Python ecosystems that want OpenTelemetry from day one. Works across Kubernetes, VMs, and major clouds, and is a strong option when you want standards, portability, and the choice between managed cloud and self-hosted deployment.
8. AppSignal
Overview
AppSignal focuses on developer-friendly APM for Python and Flask—quick to set up, with automatic route instrumentation, error tracking, performance dashboards, and lightweight host insights. Their documentation and recent tutorials walk through adding the Python/Flask integration, best practices for import order, and real-world deploys (e.g., AWS Fargate, Docker) so Flask teams can start capturing actionable telemetry fast.
Key Advantage
Fast, low-friction Flask setup — add the AppSignal client before importing Flask to auto-instrument requests, errors, and dependencies with minimal code.
Key Features
- Automatic Flask instrumentation: Captures route transactions, timing, and dependencies with the Python agent.
- Error tracking with context: Surfaces exceptions and links them to requests; tutorials show end-to-end Flask error workflows.
- Request & performance dashboards: Prebuilt views for slow endpoints and regressions; dev-centric UX.
- WSGI/ASGI & env compatibility: Works cleanly in common Flask deployment patterns and containers (e.g., Fargate).
- Python logging integration: An Optional package to connect logs with traces for deeper context.
Pros
- Very quick time-to-value for Flask teams
- Clean, developer-first UI and docs
- Error + performance in one lightweight agent
- Works well in containerized deployments
Cons
- Pricing is request-based, not GB-based, so cost modeling by data volume is less direct
- Fewer integrations
- UI issues
AppSignal Pricing at Scale
AppSignal lists APM in USD at approximately $23.25/month (monthly) for 250K requests/month. Logging is a paid add-on with 1 GB included and larger storage buckets available on higher-priced tiers; enterprise add-ons (e.g., HIPAA, SAML SSO, long-term log storage) are billed separately.
For a mid-sized company emitting 45 TB/month of telemetry, the total cost depends on how that 45 TB splits across requests vs. logs and which logging buckets you choose.
Tech Fit
Great for Flask and broader Python teams that want a simple, developer-centric APM with fast setup and clear insights; fits well on Docker/Kubernetes and serverless containers like AWS Fargate, and complements existing infra monitoring when you don’t need a heavyweight enterprise suite.
How to Choose the Right Flask Monitoring Tools
Instrumentation that Fits Flask (OTel-First)
Prefer platforms that ingest OpenTelemetry so your opentelemetry-instrumentation-flask spans use route patterns as span names and propagate http.route across services. Add SQLAlchemy and Celery instrumentation to capture DB queries and background jobs without vendor lock-in. This keeps your Flask code portable across backends and self-hosted options.
Proven in Production Topologies (Gunicorn/uWSGI, Async Views)
Your tool should trace accurately under WSGI servers (e.g., Gunicorn) and mixed sync/async routes, preserving worker metadata and request context. Check documentation that acknowledges Flask’s production deployment patterns and async worker models.
Deep Correlation: Route ↔ DB ↔ Jobs ↔ Infra
Flask endpoints often fan out to SQLAlchemy, caches, outbound HTTP, and Celery. Choose solutions that correlate traces, logs, and metrics into a single timeline so a slow /checkout jumps directly to the offending query, worker task, container CPU, or error log.
Cost Controls for Spikes and Cardinality
Autoscaling and bursty traffic can explode span/log volume and tag cardinality. Favor tools with clear pricing and controls to cap ingestion, filter noisy logs, and guard against surprise bills highlighted in community discussions and 2025 reviews.
Background Task Tracing that Links Back to Requests
If you rely on Celery/RQ, ensure the vendor supports initializing tracing after worker_process_init and preserves parent context so jobs link to the originating Flask request. This removes blind spots across HTTP → queue → worker.
Deployment Flexibility, Data Residency, and BYOC
Regulated or hybrid-cloud teams need BYOC/self-host and region control to meet GDPR/HIPAA and reduce egress. Pick platforms that document on-prem or private-cloud paths and OpenTelemetry collectors you operate.
Frontend Impact for API-Backed Apps
If your Flask API serves web or mobile UIs, include RUM/synthetics so backend traces correlate with real user latency and scripted checks for critical flows. This closes the loop from user experience to Flask route performance.
Alerts, SLOs, and Developer Workflow
Look for alerting on route latency and error rate with context-rich notifications (trace links, logs) and SLO tracking. Integrate with CI/CD and issue trackers so regressions on Flask endpoints surface early, reducing MTTR through actionable alerts.
Bottom line: the “right” Flask monitoring tool is OTel-native, production-proven on WSGI/async, correlates MELT across routes, includes real cost controls, traces background work, and fits your deployment and compliance model.
Conclusion
Choosing Flask monitoring tools is tricky—teams juggle opaque pricing, agent lock-in, and fragmented views across routes, databases, background jobs, and infrastructure. That complexity slows down debugging and balloons costs.
CubeAPM solves this with OpenTelemetry-native ingestion, full MELT correlation, and simple $0.15/GB pricing that scales cleanly from dev to multi-service production. Flask routes, SQLAlchemy queries, Celery tasks, and container metrics land in one timeline.
If you want predictable costs and faster root-cause analysis for Flask, try CubeAPM. Schedule a free demo to explore the platform.
Disclaimer: The information in this article reflects the latest details available at the time of publication and may change as technologies and products evolve.
FAQs
1. What should I monitor in a Flask app?
Track route latency, error rate, throughput, DB query time, external calls, background job latency, and container/host metrics.
2. How do I instrument Flask without vendor lock-in?
Use OpenTelemetry (opentelemetry-instrumentation-flask) and export OTLP to a backend like CubeAPM for portable telemetry.
3. Can I correlate Flask traces with logs and metrics?
Yes—choose a platform that unifies MELT, so slow /checkout links to SQL logs and CPU spikes. CubeAPM does this out of the box.
4. Do I need separate tools for Celery or RQ workers?
No—instrument workers and propagate context so jobs link back to the originating Flask request; your APM should visualize this end-to-end.
5. How do I forecast monitoring costs at scale?
Prefer ingestion-based pricing; you can model from GB/month. CubeAPM charges $0.15/GB.


