










Azure Virtual Desktop (AVD) performance issues often surface as user complaints before your monitoring catches them. A session hangs, a host pool saturates, or RemoteFX latency climbs above 150ms, and the first signal is a support ticket, not an alert. According to the 2025 Microsoft Azure Market Review, AVD usage grew 43% year over year as hybrid work models became permanent, which means more organizations now rely on virtual desktop infrastructure where performance visibility gaps carry real productivity costs.
Most teams start with Azure Monitor because it is free and native to Azure. It works for basic VM health checks, but it stops at infrastructure metrics. It does not show you why a user session froze, which application caused the spike, or how network latency between the user’s location and the AVD host is affecting experience. The monitoring tools in this guide go deeper, covering session quality, application performance inside the desktop, logon duration, and the connection path between the end user and the backend resource.
This guide compares 10 AVD monitoring tools on deployment model, session telemetry depth, alert capabilities, real 2026 pricing, and what each tool misses. Every review includes honest cons. A decision framework at the end maps each tool to the team size and AVD complexity it actually fits.
| Tool | Best For | Deployment | Session Metrics | Starting Price (2026) |
|---|---|---|---|---|
| CubeAPM | Hybrid AVD + on-prem infrastructure | Self-hosted, managed | Full AVD + app traces | $0.20/GB |
| Azure Monitor | Azure native, budget constrained | SaaS, Azure native | Basic VM metrics | 5 GB/mo free, then $2.30/GB |
| ControlUp | Large AVD estates, real-time triage | SaaS or on-prem | Deep session + logon | Quote-based, ~$10/user/mo |
| Nerdio Manager | MSPs and cost + performance together | SaaS | Cost + basic perf | From $4/user/mo |
| Datadog | Multi-cloud with AVD as one piece | SaaS agent | Infra + APM | $15/host/mo + add-ons |
| Dynatrace | Enterprise AI root cause | SaaS, OneAgent | Full stack + AI | From $7/host/mo |
| Liquidware Stratusphere UX | End user experience focus | On-prem or cloud | Session quality scoring | Quote based |
| Sepago Azure Monitor for AVD | AVD-specific workbooks | SaaS, Azure native | AVD diagnostics + dashboards | Free workbooks + Log Analytics cost |
| LoginVSI | Load testing + user simulation | SaaS or on-prem | Synthetic session testing | Quote based |
| Nexthink | Digital employee experience | SaaS agent | Endpoint + desktop experience | Quote-based, enterprise pricing |
1. CubeAPM
Best for: Teams running AVD alongside on-prem infrastructure or hybrid cloud setups who want unified monitoring without sending telemetry outside their network.
Rating: 4.6/5 on G2, 4.6/5 on Gartner Peer Insights.
CubeAPM is our own platform, so read the cons with that context. It is a unified observability platform covering infrastructure, application performance, logs, and distributed traces. For AVD monitoring, that means you can track Azure VM health, AVD host pool status, session host performance, and the application behavior inside those sessions, all from one backend. The platform runs inside your own cloud or data center, so AVD telemetry and application traces stay on your infrastructure.
The infrastructure monitoring module tracks CPU, memory, disk, and network for AVD session hosts and connects those metrics to user session performance. The application performance monitoring module traces application requests inside the virtual desktop, so when a user reports slowness, you can see if the delay is in the app layer, the database, or the network path. The log management module ingests AVD diagnostic logs and Windows Event Logs from session hosts for full context during triage.
CubeAPM integrates with OpenTelemetry, Prometheus, Datadog agents, and Elastic, so migration from an existing stack is incremental. The alert engine supports anomaly detection and contextual alerts tied to related metrics, which helps reduce noise when host pool saturation triggers cascading alerts across session hosts.
Key Features:
- Unified view of AVD host pools, session hosts, VMs, databases, and application traces
- Self-hosted deployment keeps AVD telemetry inside your network
- OpenTelemetry native with compatibility for existing Prometheus, Datadog, or Elastic agents
- Unlimited retention at $0.20/GB pricing with no per-host or per-user fees
- Correlation engine links infrastructure events to application traces and logs
Pricing:
$0.20/GB ingested. No per-host, per-user, or retention surcharges. For a 50-session host AVD environment ingesting 5TB/month of metrics, logs, and traces, that comes to $1,000/month. Compare that to Datadog at $15/host/mo for 50 hosts = $750 for infrastructure alone, before APM, logs, or custom metrics.
This estimate models a production AVD setup with infrastructure metrics, application traces, and diagnostic logs. Smaller deployments with fewer session hosts or lighter instrumentation will cost less.
Pros:
- Single platform for AVD infrastructure, application performance, and logs
- Self-hosted option meets data residency requirements for regulated industries
- Unlimited retention means you can analyze historical session performance trends
- Direct engineering support via WhatsApp and Slack channels
Cons:
- Requires BYOC or on-prem deployment, so your team manages the infrastructure
- Not AVD-specific, so you configure AVD dashboards using the platform’s general monitoring capabilities
- SSO and RBAC are less mature than enterprise-focused tools like ControlUp
Best for: Platform teams running AVD alongside other infrastructure who want one monitoring backend for everything, or regulated teams that cannot send AVD telemetry to external SaaS.
2. Azure Monitor
Best for: Teams whose entire stack lives in Azure and who want native integration with zero setup cost.
Rating: 4.3/5 on G2, 4.3/5 on Gartner Peer Insights.
Azure Monitor is Microsoft’s native observability service and the default starting point for AVD monitoring. It collects platform metrics from AVD host pools, session hosts, and VMs automatically with no agent required for basic metrics. Application Insights adds application performance monitoring, and Log Analytics lets you query diagnostic logs using Kusto Query Language (KQL). The AVD Insights workbook provides pre-built dashboards for connection reliability, session performance, and host pool utilization.
The catch is depth. Azure Monitor sees AVD resources clearly but gives you infrastructure metrics and diagnostic logs, not the session quality metrics that matter to end users. You get CPU and memory per session host, but not logon duration, session latency, or RemoteFX performance. For that, you need to parse logs manually or add a third-party tool.
Key Features:
- Native to Azure with zero setup for platform metrics
- AVD Insights workbook provides out-of-the-box AVD dashboards
- Log Analytics with KQL for querying diagnostic logs
- Ties directly into Azure Policy and security tooling
Pricing:
Pay as you go. Platform metrics and the first 5 GB of log ingestion each month are free. After that, Analytics Logs run $2.30 per GB ingested, with a cheaper Basic Logs tier at $0.50 per GB for high-volume, low-touch data. For an AVD environment with 50 session hosts generating 2TB/month of diagnostic logs, that is $4,600/month for log ingestion alone.
Pricing is based on publicly available Azure Monitor pricing as of April 2026. Verify current rates at the Azure Monitor pricing page.
Pros:
- Native to Azure, with no setup for platform metrics
- Free tier covers small AVD deployments
- Powerful log querying through KQL
- Integrates with Azure security and compliance tools
Cons:
- Weak session quality metrics, no logon duration or RemoteFX visibility
- Cross-resource queries get complex fast
- Log ingestion costs climb quickly at scale
- Monitor, Log Analytics, and Application Insights feel fragmented
Best for: Small AVD deployments where basic VM health monitoring is enough, or teams already heavily invested in Azure who want to keep everything inside Microsoft’s ecosystem.
3. ControlUp
Best for: Large AVD estates where real-time triage and deep session visibility justify premium pricing.
Rating: 4.7/5 on G2, 4.6/5 on Gartner Peer Insights.
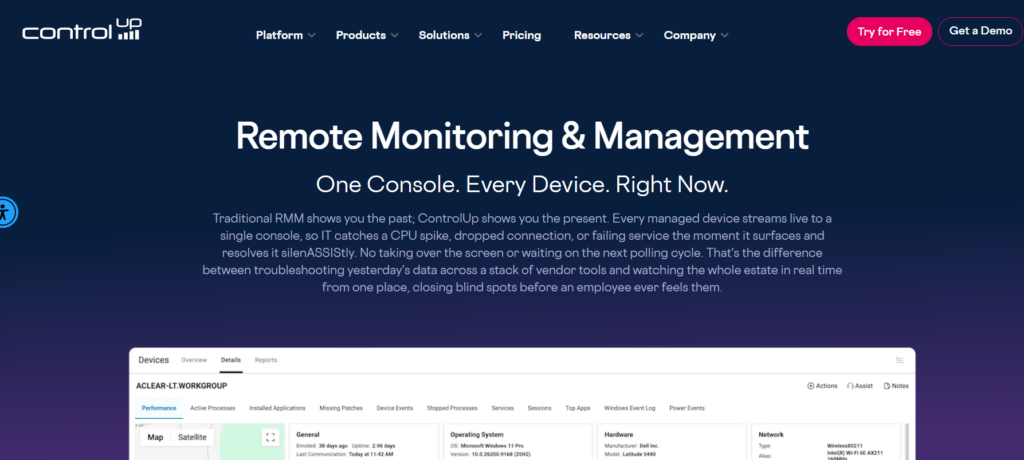
ControlUp is the platform most enterprises mention first when they talk about serious AVD monitoring. It tracks every layer: infrastructure health, host pool performance, session quality, application performance inside the desktop, and end-user experience. The real-time console shows exactly what each user session is doing right now, down to the process level. Logon duration, session latency, frame rate, and RemoteFX metrics are native. The Scoped Actions feature lets you restart a service, kill a process, or adjust a setting directly from the console without RDP.
The depth comes at a cost. ControlUp pricing is per user or per device, and at enterprise scale that adds up. The platform also has a learning curve. Teams report that initial setup and tuning take weeks, not days.
Key Features:
- Real-time session visibility down to process and thread level
- Logon duration tracking with breakdown by phase
- RemoteFX and session latency metrics for user experience
- Scoped Actions for remote remediation without RDP
- Proactive alerts based on session quality thresholds
Pricing:
Quote-based, typically around $10 per user per month for the full platform. For 500 AVD users, that is $5,000/month or $60,000/year. Verify current pricing on the ControlUp pricing page.
Pricing estimate based on community-reported figures and vendor discussions as of April 2026. Enterprise discounts and multi-year contracts may reduce per-user cost.
Pros:
- Deepest session visibility in the AVD monitoring space
- Real-time console for instant triage
- Scoped Actions reduce mean time to resolution
- Strong support and active user community
Cons:
- High cost at scale due to per-user pricing
- Steep learning curve; initial setup takes weeks
- Overkill for small AVD deployments under 100 users
Best for: Enterprises with 500 plus AVD users where session quality and rapid incident resolution justify premium pricing.
4. Nerdio Manager
Best for: MSPs and organizations that want to optimize AVD costs and performance together.
Rating: 4.8/5 on G2, 4.7/5 on Gartner Peer Insights.
Nerdio Manager is designed for MSPs and IT teams managing multiple AVD environments. It combines cost management, auto scaling, and basic performance monitoring in one platform. The cost analysis feature shows spending by host pool, session host, and user, and the auto-scaling engine adjusts capacity based on demand to reduce waste. Performance monitoring covers host pool health, session host utilization, and basic user session metrics.
The performance monitoring is not as deep as ControlUp. You get infrastructure health and session counts, but not detailed logon duration breakdowns or RemoteFX metrics. The trade-off is simplicity and cost. Nerdio is easier to set up and cheaper per user.
Key Features:
- Cost analysis and optimization for AVD environments
- Auto-scaling based on user demand
- Host pool and session host health monitoring
- Multi-tenant management for MSPs
- Integration with Azure cost management
Pricing:
From $4 per user per month. For 500 AVD users, that is $2,000/month or $24,000/year. Verify current pricing on the Nerdio pricing page.
Pricing based on publicly available Nerdio rate card as of April 2026. Discounts available for annual commitments and large deployments.
Pros:
- Combines cost and performance management
- Easier setup than ControlUp
- Auto-scaling reduces waste
- Strong MSP support and multi-tenant features
Cons:
- Performance monitoring is less deep than ControlUp
- No detailed logon duration or RemoteFX metrics
- Best suited for cost optimization, not deep performance troubleshooting
Best for: MSPs managing multiple AVD tenants, or organizations where cost optimization is as important as performance monitoring.
5. Datadog
Best for: Multi-cloud teams that want AVD monitoring as part of a broader observability platform.
Rating: 4.4/5 on G2, 4.5/5 on Gartner Peer Insights.
Datadog is the SaaS observability platform most teams benchmark against. It covers infrastructure, APM, logs, and real user monitoring across Azure and every other major cloud. The Azure integration pulls metrics from AVD host pools, session hosts, and VMs automatically. The dashboards are quick to build, and the tracing is strong if you instrument the applications running inside AVD sessions.
The catch is cost. Datadog pricing is per host plus add-ons for APM, logs, and custom metrics. For AVD, you pay per session host, then again for APM if you want application traces, then again for log ingestion. A 50-session host AVD environment with APM and logs can easily hit $3,000/month before egress fees.
Key Features:
- Full stack observability across Azure, AWS, GCP, and on-prem
- 700 plus integrations, including AVD, Azure Monitor, and Windows Event Logs
- Unified dashboards for infrastructure, application traces, and logs
- Anomaly detection with Watchdog AI
Pricing:
$15/host/mo for infrastructure monitoring. APM adds $31/host/mo. Logs run $0.10/GB ingested plus $1.70 per million events indexed. For 50 AVD session hosts with APM and 2TB/month of logs, that is $750 infrastructure + $1,550 APM + $200 log ingest + $340 log indexing = $2,840/month before custom metrics or egress.
Pricing estimate based on Datadog’s public rate card as of April 2026. Verify current rates at the [Datadog pricing page](https://www.datadoghq.com/pricing/).
Pros:
- Unified platform for AVD, other clouds, and on-prem
- Strong integration ecosystem
- Fast dashboard building
- Anomaly detection with Watchdog AI
Cons:
- High cost at scale due to per-host and per-feature pricing
- No AVD-specific session metrics without custom instrumentation
- Log indexing adds hidden costs
- SaaS only, no on-prem option
Best for: Multi-cloud teams that already use Datadog and want to add AVD monitoring to an existing observability platform.
6. Dynatrace
Best for: Enterprises that want AI-driven root cause analysis for AVD performance issues.
Rating: 4.5/5 on G2, 4.5/5 on Gartner Peer Insights.
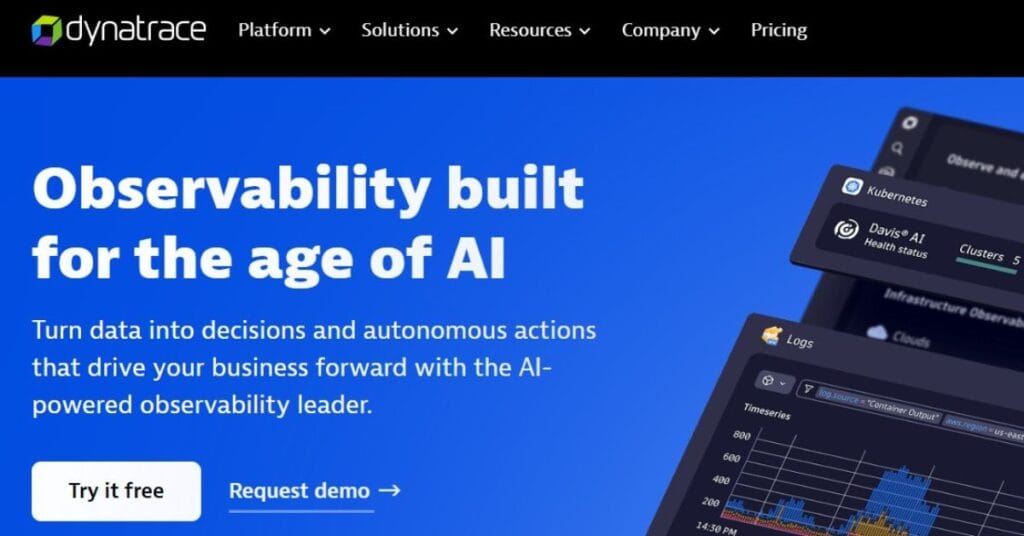
Dynatrace is an AI-driven observability platform built for complex enterprise environments. The proprietary Davis AI engine automatically discovers dependencies, baselines performance, and surfaces root cause analysis rather than just symptoms. Deployment uses a single agent (OneAgent) per session host. For AVD, that means you get infrastructure monitoring, application performance inside the virtual desktop, and end-user experience monitoring from one agent.
The AI-driven root cause analysis is genuinely useful when you have hundreds of session hosts and complex application dependencies. The platform is opinionated about how you instrument and monitor, which reduces flexibility but simplifies deployment.
Key Features:
- AI-driven root cause analysis with Davis engine
- OneAgent simplifies deployment across session hosts
- Full stack observability from infrastructure to user session
- Automatic dependency mapping
Pricing:
Host-based pricing starting from $7/host/mo for basic infrastructure monitoring. Full stack monitoring with APM and logs runs higher, typically $50 to $100/host/mo depending on modules. For 50 AVD session hosts with full stack monitoring, estimate $2,500 to $5,000/month.
Pricing estimate based on community-reported figures as of April 2026. Enterprise contracts and volume discounts may reduce per-host cost. Verify with Dynatrace directly.
Pros:
- AI-driven root cause analysis reduces triage time
- OneAgent simplifies deployment
- Strong for complex AVD environments with many dependencies
- Full stack visibility from session host to backend database
Cons:
- High cost at scale
- Opinionated instrumentation reduces flexibility
- AI suggestions require a baseline learning period
- Less AVD-specific features compared to ControlUp
Best for: Large enterprises with complex AVD environments where AI-driven root cause analysis justifies premium pricing.
7. Liquidware Stratusphere UX
Best for: Teams focused on end-user experience scoring and session quality metrics.
Rating: 4.5/5 on Gartner Peer Insights (limited G2 reviews).
Liquidware Stratusphere UX specializes in end-user experience monitoring for virtual desktop environments including AVD, Citrix, and VMware Horizon. It scores user sessions based on logon time, application responsiveness, and resource contention, then surfaces the sessions with the worst experience. The platform tracks every phase of logon duration, application launch time, and session disconnects.
The focus is narrow: session quality and user experience. It does not monitor the full infrastructure stack or provide application tracing. For teams where AVD user experience is the primary concern and infrastructure monitoring is handled elsewhere, that narrow focus is an advantage.
Key Features:
- User experience scoring per session
- Detailed logon duration breakdown by phase
- Application launch time and responsiveness metrics
- Session disconnect tracking
- Historical trending for capacity planning
Pricing:
Quote-based. Pricing typically structured per concurrent user or per device. Community reports suggest $5 to $15 per user per year depending on scale and modules.
Pricing based on community discussions as of April 2026. Contact Liquidware for a current quote.
Pros:
- Deep session quality metrics
- User experience scoring simplifies triage
- Detailed logon duration breakdown
- Useful for capacity planning
Cons:
- Does not monitor full infrastructure stack
- No application tracing or distributed trace support
- Requires separate tools for infrastructure monitoring
- Limited integrations outside virtual desktop space
Best for: Teams where AVD user experience is the primary monitoring concern and infrastructure monitoring is already covered by another tool.
8. Sepago Azure Monitor for AVD
Best for: Teams that want AVD-specific dashboards and diagnostics within Azure Monitor.
Rating: Limited public ratings (niche solution).
Sepago Azure Monitor for AVD is a set of Azure Workbooks and diagnostic queries built specifically for AVD monitoring. It sits on top of Azure Monitor and Log Analytics, adding AVD-specific visualizations for connection reliability, session performance, host pool health, and user session counts. The workbooks are free and open source, available from the Sepago GitHub repository.
Because it runs on Azure Monitor, you pay only for Log Analytics ingestion and retention. The workbooks themselves cost nothing. The trade-off is limited depth. You get better AVD visibility than raw Azure Monitor, but not the session quality metrics or real-time triage capabilities of ControlUp or Liquidware.
Key Features:
- Free AVD-specific workbooks for Azure Monitor
- Connection reliability and session performance dashboards
- Host pool health and capacity views
- Built on native Azure Monitor, no additional agents
Pricing:
Free workbooks. You pay only for Azure Monitor Log Analytics ingestion and retention, which runs at $2.30/GB for standard logs after the 5 GB free tier. For an AVD environment generating 2TB/month of diagnostic logs, that is $4,600/month for log ingestion.
Pricing is based on Azure Monitor Log Analytics rates as of April 2026. Verify current rates on the Azure Monitor pricing page.
Pros:
- Free workbooks reduce cost
- Native Azure integration, no additional agents
- Good AVD visibility for teams already using Azure Monitor
- Open source, community supported
Cons:
- Limited session quality metrics
- No real-time triage or remote actions
- Depends on Log Analytics, which gets expensive at scale
- Less feature-rich than commercial tools
Best for: Small AVD deployments where Azure Monitor is already in use and you want better AVD visibility without adding cost for a commercial tool.
9. LoginVSI
Best for: Load testing and user simulation for AVD capacity planning and performance validation.
Rating: 4.5/5 on Gartner Peer Insights (limited G2 reviews).
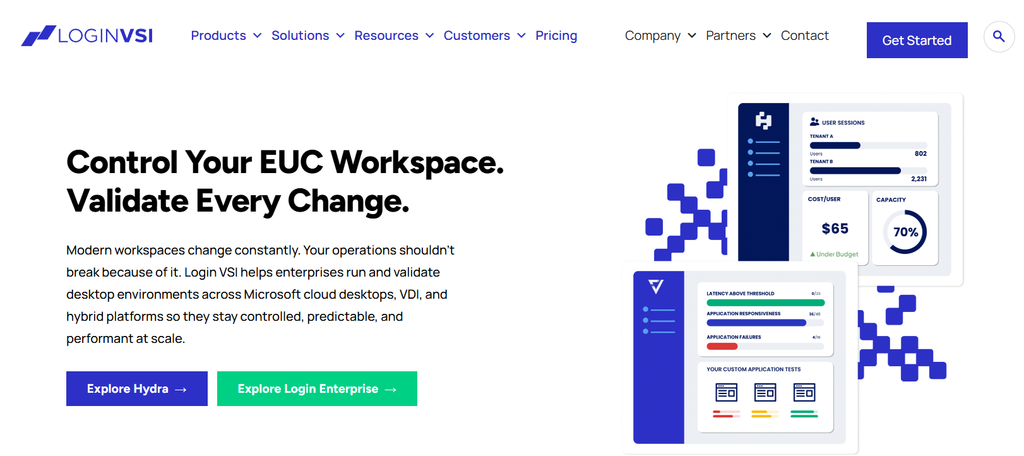
LoginVSI is a load testing and user simulation platform for virtual desktop environments. It simulates real user sessions, launches applications, performs tasks, and measures session responsiveness under load. For AVD, that means you can validate capacity before deploying, test performance after configuration changes, and establish baselines for user experience.
LoginVSI is not a production monitoring tool. It runs synthetic tests, not live session monitoring. You use it for capacity planning, load testing before major changes, and proactive performance validation, not for real-time alerting or incident response.
Key Features:
- Synthetic user session simulation
- Application launch and responsiveness testing
- Load testing for capacity validation
- Performance benchmarking under controlled load
- Pre-deployment testing for configuration changes
Pricing:
Quote-based. Pricing is typically structured per concurrent virtual user or per deployment. Community reports suggest $10,000 to $50,000/year depending on scale and modules.
Pricing is based on community discussions as of April 2026. Contact LoginVSI for a current quote.
Pros:
- Validates AVD capacity before deployment
- Useful for load testing after configuration changes
- Establishes performance baselines
- Industry standard for virtual desktop load testing
Cons:
- Not a production monitoring tool
- No live session monitoring or alerting
- High cost for what is essentially a testing tool
- Requires separate production monitoring solution
Best for: Teams planning large AVD deployments who need to validate capacity and performance before going live, or organizations that make frequent AVD configuration changes and want to test impact before users see it.
10. Nexthink

Best for: Enterprises focused on digital employee experience across AVD and endpoint devices.
Rating: 4.6/5 on G2, 4.5/5 on Gartner Peer Insights.
Nexthink is a digital employee experience platform that monitors endpoints, applications, and virtual desktops, including AVD. It tracks device performance, application responsiveness, user sentiment, and IT service impact on productivity. For AVD, that means you can see how virtual desktop performance compares to physical devices, which applications cause the most issues, and how AVD performance correlates with employee satisfaction.
The platform is built for enterprises with large device fleets and a focus on employee experience, not just infrastructure health. Pricing reflects that enterprise focus.
Key Features:
- Digital employee experience scoring
- Endpoint and virtual desktop performance monitoring
- Application responsiveness and crash tracking
- User sentiment surveys tied to performance data
- IT service impact on productivity
Pricing:
Quote-based, enterprise pricing. Community reports suggest $10 to $20 per device per year depending on modules and scale. For 1,000 AVD users, estimate $10,000 to $20,000/year.
Pricing based on community discussions as of April 2026. Contact Nexthink for a current quote.
Pros:
- Unified view of AVD and endpoint device experience
- User sentiment tied to performance data
- Useful for large enterprises with diverse device fleets
- Strong analytics and reporting
Cons:
- High cost, enterprise pricing only
- Overkill for teams focused only on AVD
- Requires deployment across endpoints, not just session hosts
- Limited AVD-specific features compared to ControlUp
Best for: Enterprises with large AVD deployments who want to track digital employee experience across virtual desktops, physical devices, and applications in one platform.
How to Choose the Right AVD Monitoring Tool
Choosing an AVD monitoring tool depends on three primary factors: your deployment size, your existing monitoring stack, and whether you need session quality metrics or just infrastructure health.
For small AVD deployments under 50 session hosts:
Start with Azure Monitor and the Sepago AVD workbooks. This gives you infrastructure health and basic AVD visibility at minimal cost. If you hit a ceiling where you need deeper session metrics, consider Better Stack for simplicity or CubeAPM if you want unified observability without SaaS egress.
For mid-sized deployments (50 to 500 session hosts):
If session quality and user experience are critical, ControlUp delivers the deepest visibility. If cost is a constraint, CubeAPM gives you full stack observability at $0.20/GB pricing with unlimited retention. If you are already on Datadog or Dynatrace for other infrastructure, adding AVD monitoring to your existing platform makes sense despite the higher cost.
For large enterprises (500 plus session hosts):
ControlUp is the default choice for deep session visibility and real-time triage. Dynatrace is the alternative if you want AI-driven root cause analysis across AVD and the rest of your stack. Nexthink fits if digital employee experience across AVD and physical devices is the primary focus.
For hybrid environments (AVD plus on-prem or multi-cloud):
CubeAPM and Datadog both handle hybrid monitoring well. CubeAPM runs self-hosted and keeps telemetry inside your network, which matters for regulated industries. Datadog is SaaS only but has the broadest integration ecosystem if data residency is not a constraint.
For MSPs managing multiple AVD tenants:
Nerdio Manager combines cost optimization and performance monitoring in a multi-tenant platform built for MSPs. ControlUp also supports multi-tenant deployments but at a higher cost.
Conclusion
AVD monitoring tools fall into three categories: native Azure tools that give you basic visibility at low cost, specialized AVD platforms that deliver deep session quality metrics at premium pricing, and full stack observability platforms that add AVD to a broader monitoring strategy.
Azure Monitor is the starting point for most teams because it is free and native, but it stops at infrastructure health. ControlUp is the enterprise standard for deep session visibility, but it costs $10 per user per month. CubeAPM fits teams that want unified observability across AVD, on-prem, and application layers without SaaS data egress, at flat $0.20/GB pricing.
The right choice depends on your deployment size, budget, and whether session quality metrics justify premium pricing or infrastructure health monitoring is enough. For teams under 100 session hosts where cost matters, start with Azure Monitor or CubeAPM. For enterprises with 500 plus users where session experience is mission-critical, ControlUp or Dynatrace deliver the depth you need.
Disclaimer: The information in this article reflects the latest details available at the time of publication and may change as technologies and products evolve. Features, pricing, and plan limits can change over time. Always verify the latest information directly with the vendor before making purchasing or deployment decisions.
Frequently Asked Questions
What is the difference between AVD monitoring and Azure VM monitoring?
Azure VM monitoring tracks infrastructure metrics like CPU, memory, disk, and network for virtual machines. AVD monitoring adds session quality metrics like logon duration, RemoteFX performance, session latency, and user experience scoring. AVD monitoring tools track both the infrastructure layer and the user session layer.
Can Azure Monitor handle AVD monitoring alone?
Azure Monitor provides infrastructure health and diagnostic logs for AVD host pools and session hosts. For small deployments where basic VM health monitoring is enough, Azure Monitor works. For deeper session quality metrics, you need a specialized AVD monitoring tool like ControlUp or a full stack platform like CubeAPM.
What AVD metrics should I monitor?
Key metrics include host pool health, session host CPU and memory utilization, active session count, logon duration, session latency, RemoteFX frame rate, application responsiveness inside sessions, and connection reliability. Tools like ControlUp and Liquidware track these natively. General infrastructure tools like Azure Monitor require custom queries.
How much does AVD monitoring cost?
Azure Monitor starts free with a 5 GB log ingestion limit. Specialized tools like ControlUp run around $10 per user per month. Full stack platforms like CubeAPM charge $0.20/GB for unified infrastructure, application, and log monitoring. Datadog runs $15 to $46/host/mo depending on modules.
What is the best free AVD monitoring tool?
Azure Monitor with the Sepago AVD workbooks is the best free option. It gives you infrastructure health and basic AVD dashboards at no additional cost beyond Log Analytics ingestion fees. For teams on a budget, this combination provides useful visibility without commercial tool costs.
Do I need a separate tool for AVD user experience monitoring?
If your primary concern is session quality and user experience, yes. General infrastructure tools like Azure Monitor and Datadog track VM health but not logon duration or RemoteFX performance. Specialized tools like ControlUp, Liquidware Stratusphere UX, and Nexthink focus specifically on user experience metrics.
Can I monitor AVD with OpenTelemetry?
Yes. CubeAPM, Datadog, and Dynatrace all support OpenTelemetry for AVD monitoring. You can instrument applications running inside AVD sessions with OpenTelemetry SDKs and send traces to your monitoring platform. For infrastructure metrics, you still need an agent or Azure Monitor integration.