Application Performance Monitoring Tools for SaaS are essential in today’s competitive environment, where even a few minutes of downtime or latency causes massive inconvenience to customers. Over 54% of major incidents cost more than $100,000. For SaaS businesses, monitoring challenges such as breakdowns in multi-tenant environments, unpredictable spikes are major concerns.
CubeAPM is the best cost-effective APM tool for SaaS companies, correlating customer journeys across microservices with end-to-end traces. It handles spiky traffic patterns with smart sampling that cuts telemetry volume by up to 80%. For SaaS teams, this means faster MTTR, lower infra costs, and better customer retention through consistent performance.
In this guide, we’ll highlight top APM tools for SaaS companies, giving you a clear view of the best options to scale reliably and cost-effectively.
8 Best APM Tools For SaaS Companies
- CubeAPM
- Datadog
- Dynatrace
- New Relic
- Coralogix
- Grafana Cloud
- SigNoz
- Better Stack
What is APM for SaaS?
Application Performance Monitoring (APM) for SaaS is the practice of tracking, analyzing, and optimizing the performance of cloud-delivered software applications. Unlike traditional apps, SaaS platforms run on multi-tenant, cloud-native architectures with thousands of concurrent users, microservices, and dynamic infrastructure like Kubernetes and serverless. This makes observability more complex and more business-critical.
Core capabilities (the essentials):
- Distributed tracing & service maps: follow a request across microservices to find the slow hop or failing dependency fast.
- Metrics, logs, and traces correlation (MELT): link spikes in metrics to the exact trace and log lines that explain “why.”
- Real User Monitoring (RUM): capture performance as real users experience it (TTFB, LCP/INP, JS errors, sessions).
- Synthetic monitoring: proactively script journeys (login → search → checkout) to catch issues before users do.
- Anomaly detection & alerting: surface regressions and errors in near-real time, tied to deployments and SLOs.
Key Features to Look for in SaaS APM Tool and Why
1. OpenTelemetry-native ingestion
Support for OTLP and Collector pipelines ensures standardized instrumentation across microservices, easy vendor migration, and per-tenant data routing.
2. Tenant-aware observability
Multi-tenant tagging, per-tenant SLOs, and noisy-neighbor isolation are essential for SaaS. These features protect customer SLAs and prevent one workload from degrading another.
3. Deep Kubernetes and serverless context
Native enrichment with pod, node, namespace, autoscaling events, and cold-start detection is critical, since most SaaS workloads now run on ephemeral infrastructure.
4. Correlated MELT with RUM and synthetics
Logs, metrics, traces, RUM, and synthetic tests should connect seamlessly. This lets you move from a user’s slow experience to the exact backend trace and log line causing it.
5. SLO and error-budget monitoring
Burn-rate alerts, deploy markers, and DORA-aligned change metrics let SaaS teams release quickly without sacrificing uptime.
6. AI-assisted detection and RCA
Cross-signal anomaly detection links user symptoms to backend causes, but should remain explainable with evidence trails—not black-box alerts.
7. First-party incident response integrations
PagerDuty, Slack, MS Teams, and Jira alerts should include tenant context, SLO impact, and the relevant trace or log to cut MTTR.
Example: How CubeAPM Enables SaaS Monitoring
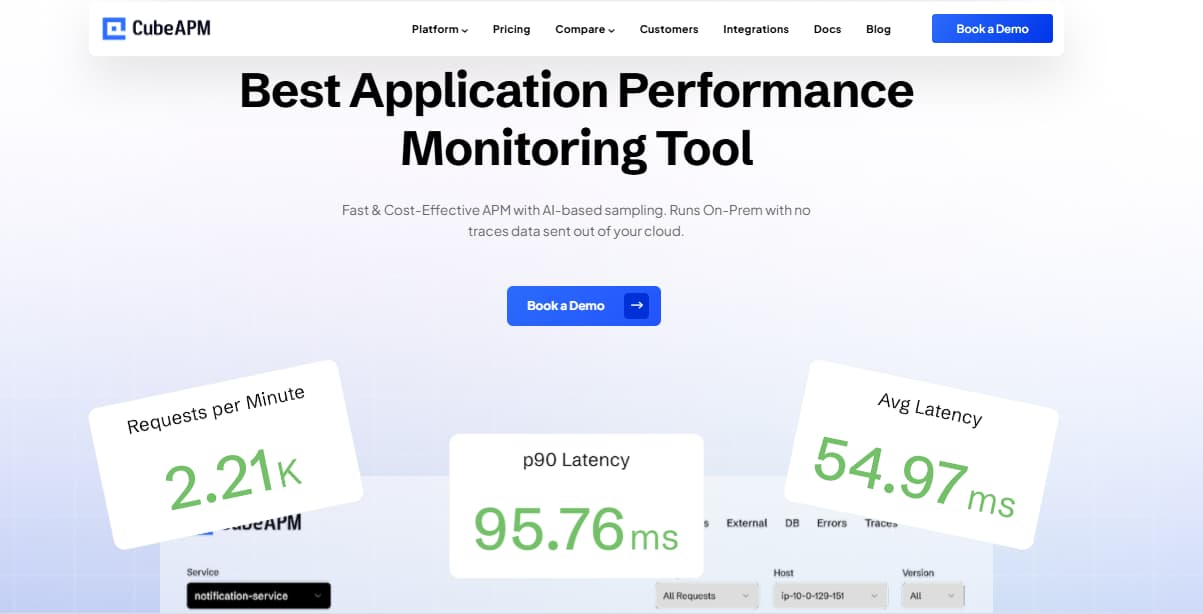
CubeAPM achieves SaaS-grade observability by combining OTEL-native ingestion, tenant-aware architecture, and full-stack monitoring built for cloud-native scale. Here’s how it meets the unique needs of SaaS companies:
- Smart Sampling Engine for SaaS Workloads: CubeAPM uses context-aware sampling that prioritizes tenant errors, latency spikes, and premium-plan customers, while filtering out low-value noise. This ensures SaaS teams capture the traces that matter for churn prevention and SLA protection without exploding costs.
- Cloud-Native Infrastructure Visibility: SaaS companies run on Kubernetes, autoscaling groups, and serverless. CubeAPM tracks pods, cold starts, HPA events, and node utilization, giving engineers real-time correlation between tenant-level performance and underlying infra health.
- End-to-End Tracing Across Customer Journeys: From sign-up to checkout, CubeAPM links every microservice call in a tenant-specific trace view. This enables SaaS teams to pinpoint which step in the customer journey is slowing down adoption or driving churn.
- Full MELT + RUM + Synthetic Coverage: CubeAPM unifies metrics, logs, errors, traces, RUM, and synthetic checks in one view. Teams can connect a frontend slowdown to backend traces and infra metrics, and run synthetic checks to keep global SaaS SLAs intact.
Why SaaS Companies Look for an APM Tool
1. Unpredictable outages break trust
Even a few minutes of downtime can result in thousands of failed requests. For SaaS businesses, this means SLA violations, customer churn, and reputational damage that’s hard to recover from.
2. Hidden bottlenecks in microservices
In modern SaaS architectures, a slow API call or database query can ripple through the system. Without distributed tracing, teams often spend hours guessing the root cause instead of fixing it.
3. Runaway monitoring costs
Legacy APM vendors often charge per-user, per-host, or per-feature. For a mid-size SaaS ingesting 10 TB of telemetry a month, costs can quickly hit $8K–$10K monthly, making scaling financially painful.
4. Kubernetes and serverless complexity
SaaS teams running on Kubernetes or serverless face constant churn from autoscaling, cold starts, and ephemeral workloads. APM tools provide the visibility needed to manage p95/p99 latency and keep SLOs intact.
Top 7 APM Tools for SaaS Companies
1. CubeAPM

Known for
An OpenTelemetry-native, cost-predictable APM platform purpose-built for SaaS and cloud-native companies. Recognized as a cost-effective alternative to Datadog and New Relic, with strong adoption among developer-first teams that want compliance, scalability, and transparent pricing.
SaaS-Specific Capabilities
- OTEL-native ingestion & vendor-neutral agents for easy standardization across services.
- Kubernetes-aware APM that correlates traces with pod, node, and cluster health.
- Full-stack coverage with RUM & synthetics to validate tenant flows and global SLAs.
- Context-rich alerting that links anomalies directly to traces, logs, and infra metrics.
Key Features
- Full-stack observability covering metrics, logs, traces, and errors (MELT) in a single platform.
- Smart sampling engine that reduces telemetry volumes by up to 80% while preserving critical traces.
- Native OpenTelemetry ingestion with compatibility for Prometheus and New Relic agents, avoiding vendor lock-in.
- Built-in RUM and synthetic monitoring for end-to-end user experience visibility.
- Self-hosted and SaaS deployment options to meet data-residency and compliance needs (HIPAA, GDPR, DPDP).
Pros
- Flat, usage-based pricing: $0.15/GB ingestion, no per-user or per-host fees.
- Predictable cost model that scales cleanly as data volumes grow.
- Fast migration from legacy vendors via OTEL and agent compatibility.
- Strong support model with real-time Slack/WhatsApp channels.
Cons
- Not suited for teams looking for off-prem solutions
- Strictly an observability platform and does not support cloud security management
Pricing
- Flat pricing of $0.15/GB ingestion
CubeAPM Pricing for SaaS Companies At Scale
*All pricing comparisons are calculated using standardized Small/Medium/Large team profiles defined in our internal benchmarking sheet, based on fixed log, metrics, trace, and retention assumptions. Actual pricing may vary by usage, region, and plan structure. Please confirm current pricing with each vendor.
For a mid-sized SaaS company ingesting 45TB(~45,000) total monthly data ingestion and 45,000GB of observability data outcharged by the cloud provider, the total cost will be about ~$7200/month.
Tech Fit
CubeAPM is ideal for SaaS companies running on Kubernetes and microservices that need end-to-end observability without unpredictable costs. It fits teams that want OTEL-native workflows, strong compliance controls, and cost savings at scale, making it one of the most practical APM choices for fast-growing SaaS platforms.
2. Datadog
Known for
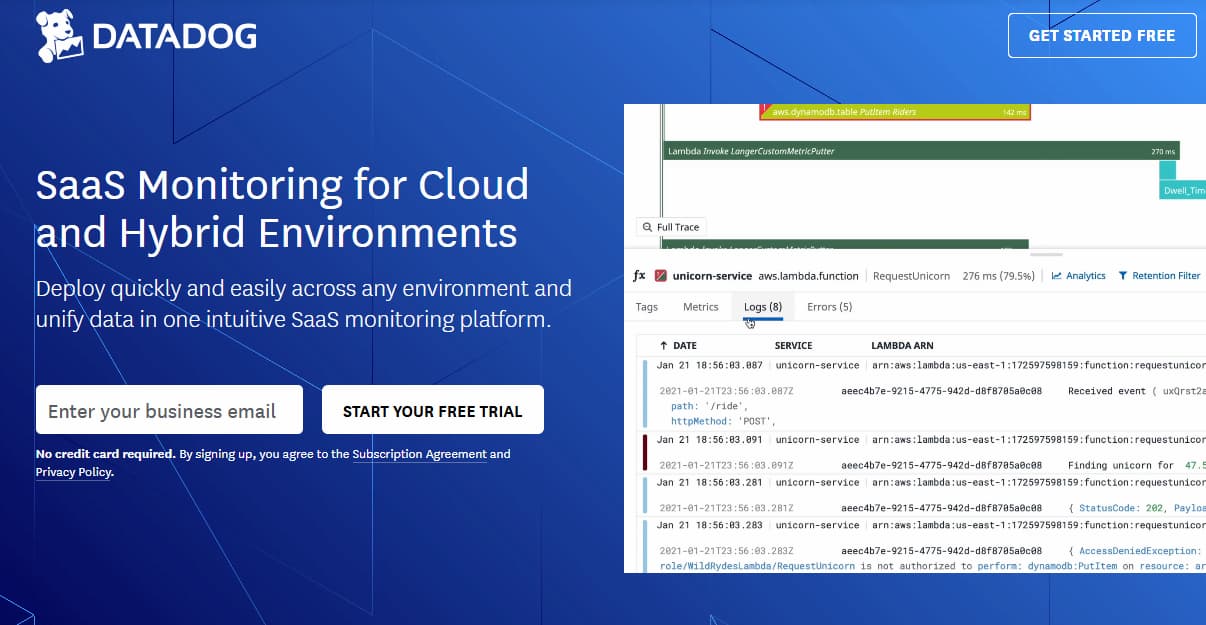
Datadog is a leading observability platform with one of the largest integration ecosystems in the market. Datadog is widely adopted by SaaS companies for its breadth of monitoring features, ranging from APM and infrastructure to logs, RUM, and security monitoring.
SaaS-Specific Capabilities
- Data residency choices with US, EU, and APAC sites.
- Change and deploy awareness to correlate incidents with releases.
- Feature-flag correlation in RUM to track customer cohorts.
- SLOs and error-budgeting tied to customer-visible SLIs.
- Serverless monitoring with deep AWS Lambda integration.
Key Features
- Extensive integrations (900+ services and frameworks).
- Distributed tracing with service maps and dependency analysis.
- Infrastructure monitoring across cloud, containers, and VMs.
- Logs, metrics, traces, and RUM correlated in unified dashboards.
- AI-driven anomaly detection and alerting.
- Built-in synthetic monitoring for proactive checks.
Pros
- Extremely broad coverage across technologies and ecosystems.
- Strong Kubernetes and serverless visibility, with out-of-the-box dashboards.
- Scales well for large engineering teams.
- Mature ecosystem with market-leading documentation and community adoption.
Cons
- High and unpredictable costs due to per-host, per-user, and per-feature pricing.
- Overlapping modules create complexity.
- Steep learning curve for teams needing only core APM.
Pricing
- APM (Pro Plan): $35/host/month
- Infra (Pro Plan): $15/host/month
- Ingested Logs: $0.10 per ingested or scanned GB per month
Datadog Pricing for SaaS Companies At Scale
For a mid-sized SaaS company operating 125 APM hosts, 40 profiled hosts, 100 profiled container hosts, 200 infrastructure hosts, 1.5 million container hours, 300,000 custom metrics, 500 million indexed spans, and 3,500 indexed logs, while ingesting approximately 10 TB (≈10,000 GB) of logs per month, the estimated monthly cost would be around $27,475.
Tech Fit
Datadog is best suited for large SaaS organizations that want a single vendor to cover the full observability spectrum and can absorb the higher costs. It’s ideal for teams that value a feature-rich ecosystem and integration depth over pricing predictability.
3. Dynatrace
Known for
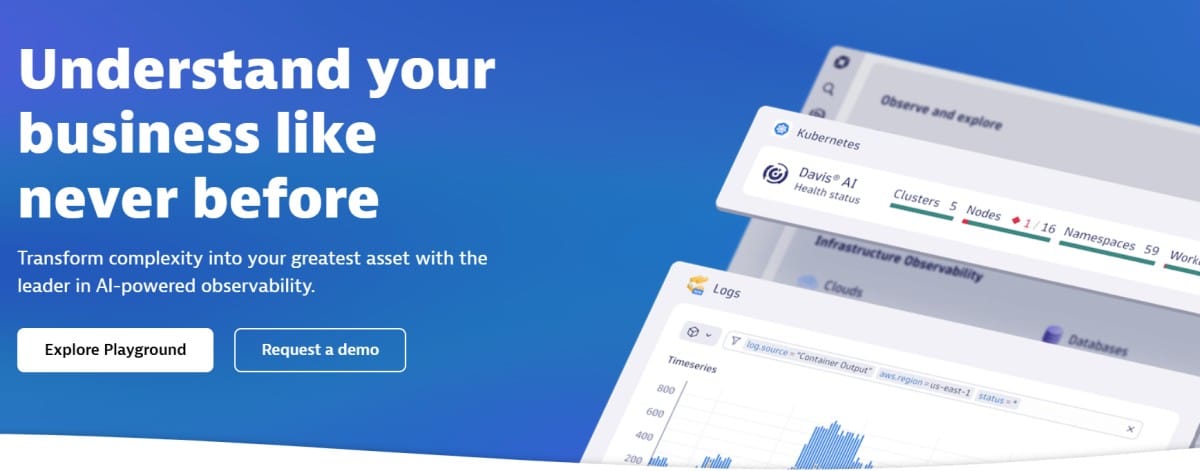
An enterprise-grade observability and automation platform powered by its AI engine, Davis. Dynatrace is widely adopted by large enterprises and SaaS providers that need deep automation, application dependency mapping, and proactive incident detection at scale.
SaaS-Specific Capabilities
- AI-driven root cause analysis across microservices and infra.
- SLOs with burn-rate and error budgets for premium tenant SLAs.
- OpenTelemetry ingest for vendor-neutral instrumentation.
- Data residency options across multiple SaaS regions.
Key Features
- AI-powered root cause analysis (Davis AI) for automated anomaly detection.
- Distributed tracing and service flow mapping across hybrid and multi-cloud environments.
- Infrastructure & Kubernetes monitoring with pod, node, and cluster-level visibility.
- Application security monitoring integrated into the same platform.
- Business transaction monitoring to tie technical performance to customer impact.
- Support for OpenTelemetry ingestion alongside its own agents.
Pros
- Strong enterprise automation with AI-driven insights.
- Deep Kubernetes and multi-cloud visibility with minimal manual setup.
- End-to-end observability from frontend (RUM) to backend and infra.
- Security + performance monitoring in one platform.
Cons
- Premium pricing—costs quickly escalate at SaaS scale.
- Steep learning curve, requiring training for full value.
Pricing
- Infrastructure Monitoring: $29/mo/host
- Full-Stack Monitoring: $58/mo/8 GiB host
Dynatrace Pricing for SaaS Companies At Scale
A mid-sized SaaS company operating 125 APM hosts, 200 infrastructure hosts, ingesting approximately 10 TB (≈10,000 GB) of logs, generating 300,000 custom metrics, consuming 1.5 million container hours, and producing around 45,000 GB of observability data egress (charged by the cloud provider) would incur an estimated monthly cost of approximately $21,850.
Tech Fit
Dynatrace is best for large SaaS enterprises that prioritize AI-driven automation, end-to-end observability, and enterprise governance. It’s a strong fit for organizations that need deep automation and security integration but less ideal for cost-sensitive SaaS teams due to premium pricing and proprietary lock-in.
4. New Relic
Known for
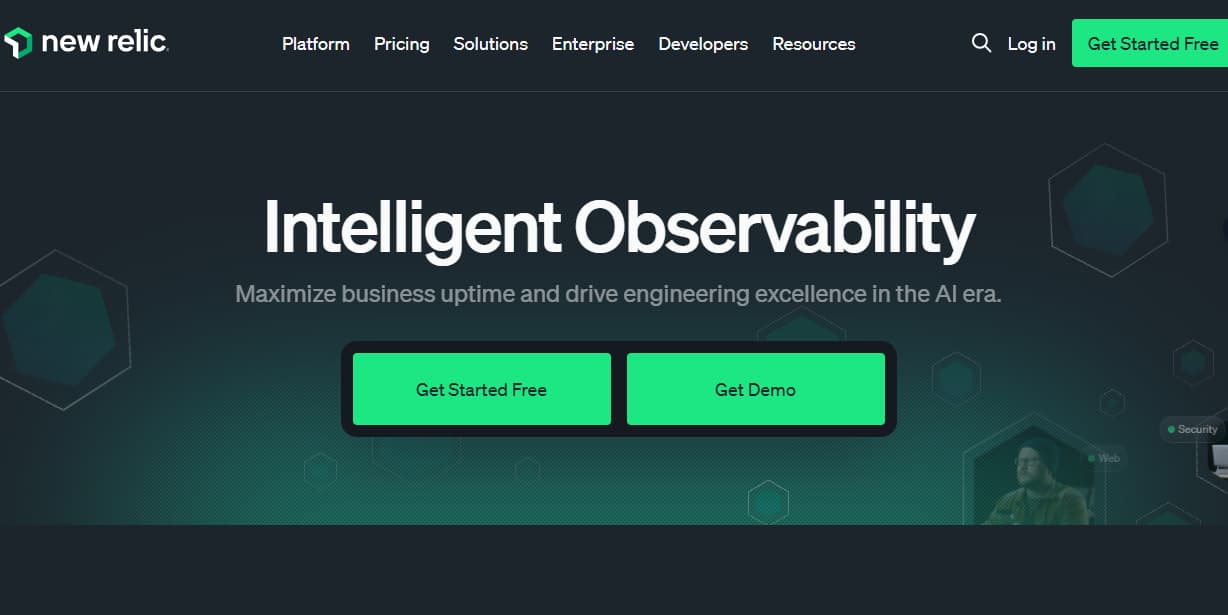
New Relic is a well-established APM and observability platform that pioneered full-stack monitoring. New Relic is known for its user-friendly dashboards and all-in-one approach that bundles logs, metrics, traces, and user monitoring into a single interface.
SaaS-Specific Capabilities
- Change tracking and deploy markers across APM, browser, and mobile.
- Kubernetes Cluster Explorer for tenant-aware visibility in noisy clusters.
- Multi-account org model for separating environments or customer segments.
Key Features
- Unified telemetry: metrics, logs, traces, and RUM within one platform.
- Distributed tracing with service maps and transaction breakdowns.
- Infrastructure monitoring for cloud, containers, and hybrid setups.
- Error tracking and anomaly detection with deployment markers.
- Custom dashboards and query builder (NRQL) for advanced analysis.
- AI-assisted alerts to reduce noise and improve incident response.
Pros
- All-in-one platform with strong usability for developers and ops.
- Good OTEL ingestion support, easing migrations from other tools.
- Clear visualizations for service maps and transaction breakdowns.
- Freemium tier makes it accessible for startups and smaller SaaS teams.
Cons
- Per-user pricing model can get expensive for large engineering orgs.
- High costs at scale, especially for data ingestion and longer retention.
- Some advanced features have a steep learning curve.
Pricing
- Free Tier: 100GB/month ingested
- Pro plan: $0.40/GB ingested beyond the free 100GB limit
- Pro Plan: $349/user for full platform user
New Relic Pricing for SaaS Companies At Scale
A mid-sized SaaS company ingesting 45TB (~45,000 GB) of telemetry data per month and with 10 full users, the cost would come around ~$25,990/month.
Tech Fit
New Relic works best for SaaS startups and mid-size teams that value an all-in-one, developer-friendly platform with easy onboarding. It’s a strong fit for teams that want simplicity and unified views, but less ideal for enterprises needing cost predictability or self-hosted compliance.
5. Coralogix
Known for
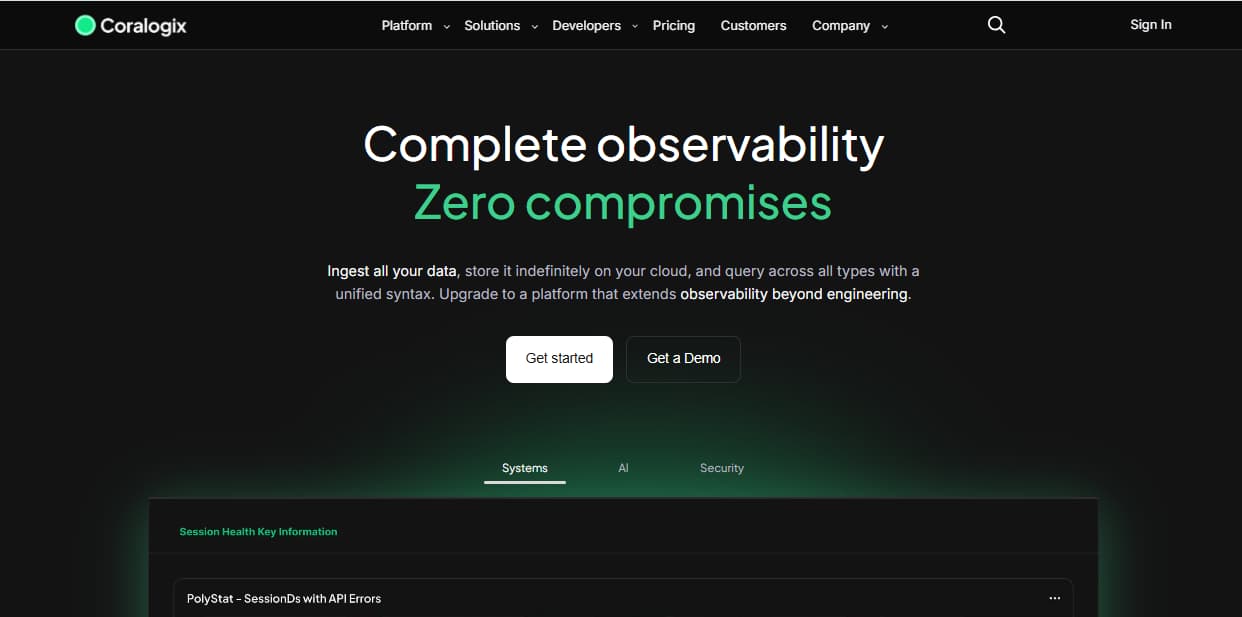
A log-analytics and observability platform with strong adoption among SaaS teams that need cost-efficient log management and flexible data lifecycle policies. Coralogix emphasizes real-time insights and long-term storage control to reduce monitoring spend.
Saas-Specific Capabilities
- TCO Optimizer to tier logs and traces by tenant or severity.
- Flow Alerts to detect sequence-based incidents across signals.
- In-stream ML (Streama) for pre-index anomaly detection.
- Serverless and Kubernetes dashboards tuned for SaaS workloads.
Key Features
- Log analytics with data lifecycle controls: hot, warm, archive, and remote tiers to optimize storage.
- Native OpenTelemetry support for traces and metrics ingestion.
- Real-time streaming analytics for faster detection of anomalies and issues.
- Dashboards and visualizations to correlate logs, metrics, and traces.
- AI/ML-powered alerting for anomaly and pattern detection.
- Integrations with cloud providers, CI/CD pipelines, and security tools.
Pros
- Cost savings through lifecycle management—choose what to keep hot vs. archive.
- Strong analytics layer, enabling deeper insights into SaaS application logs.
- Solid OpenTelemetry support, making migration from legacy tools easier.
- Flexible deployment options across regions and clouds.
Cons
- Expensive as usage grows.
- Steep learning curve for new users.
- Overwhelming UI for beginners.
- Complex initial setup.
Pricing
- Logs: $0.42 / GB
- Traces: $0.16 / GB
- Metrics: $0.05 / GB
Coralogix Pricing for SaaS Companies At Scale
For a mid-sized SaaS company ingesting 25,000 GB of data from APM hosts, 10,000 GB from infrastructure hosts, and 10,000 GB from log hosts, while generating approximately 45,000 GB of observability data egress (charged by the cloud provider), the estimated cost would be around $13,200 per month.
Tech Fit
Coralogix is a strong fit for SaaS teams that are log-heavy and want to cut costs via tiered storage while still keeping access to historical data. It works well for companies that prioritize log analytics and cost efficiency, but less ideal for teams that need full-stack APM with RUM and synthetics baked in.
6. Grafana Cloud
Known for
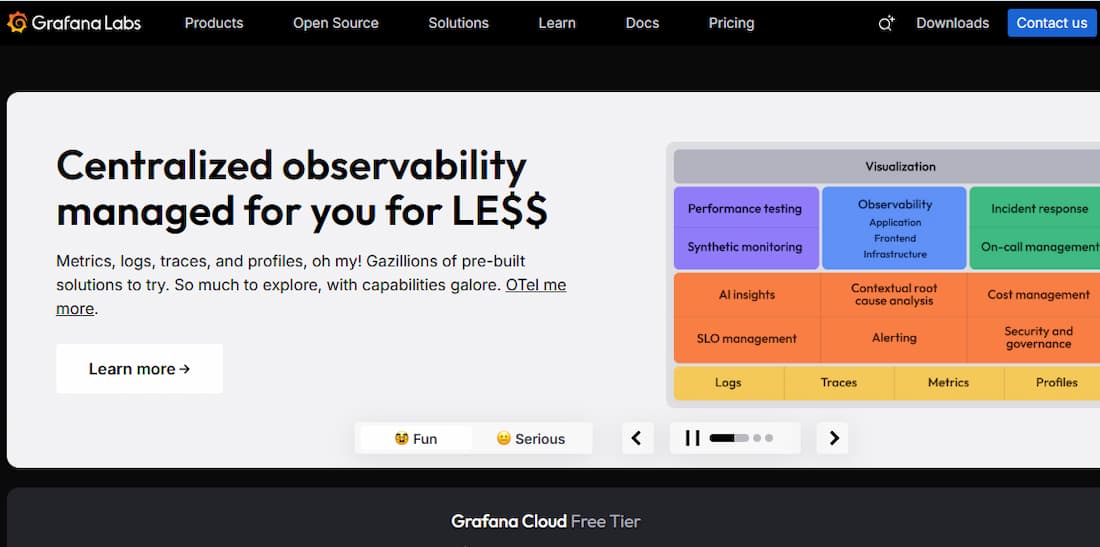
Grafana is best known as the open-source visualization leader, expanded into a full observability platform with Grafana Cloud. It combines dashboards with Prometheus, Loki, Tempo, and Pyroscope for metrics, logs, traces, and profiling, making it popular among SaaS teams that prefer OSS-first tooling.
SaaS-Specific Capabilities
- Frontend RUM with Grafana Faro for Web Vitals and tenant cohorts.
- Synthetic monitoring with k6 Cloud to test SaaS signup and checkout flows.
- Continuous profiling with Pyroscope for performance hotspots.
- Trace-to-profile correlation to tie slow spans to specific code paths.
- Vendor-neutral pipelines with Grafana Alloy to unify OTEL data flows.
Key Features
- Dashboards and visualization: highly customizable panels with alerting.
- Metrics with Prometheus integration for containerized and Kubernetes apps.
- Logs with Loki for scalable, cost-efficient log ingestion.
- Distributed tracing with Tempo for request flows across services.
- Continuous profiling with Pyroscope, recently integrated.
- Synthetic monitoring with probes to simulate user journeys.
Pros
- Open-source foundations reduce vendor lock-in.
- Affordable compared to legacy APM vendors.
- Flexible integrations across cloud, infra, and SaaS ecosystems.
- Strong community adoption with thousands of plugins and dashboards.
Cons
- Requires scripting knowledge (not no-code friendly).
- Costs grow quickly with high-frequency tests.
- Limited standalone features outside Grafana ecosystem.
Pricing
- Grafana OSS: Free
- Pro plan: $19/month
- Metrics: $6.50/ 1k series
- Logs: $0.50/GB ingested
- Traces: $0.50/GB ingested
Grafana Cloud Pricing for SaaS Companies At Scale
For a mid-sized company operating 125 APM hosts and 200 infrastructure hosts, ingesting approximately 10 TB (≈10,000 GB) of logs, and generating around 45,000 GB of observability data egress (charged by the cloud provider), the estimated monthly cost would be approximately $11,875.
Tech Fit
Grafana Cloud fits SaaS teams that value OSS-first observability, want cost efficiency, and are comfortable with managing integrations. It’s best for developer-driven organizations that want custom dashboards and flexibility, but less suited for enterprises that need turnkey compliance or hands-off governance.
7. SigNoz

Known for
An open-source, OpenTelemetry-native APM built as a cost-effective alternative to Datadog and New Relic. Popular among developer-first SaaS teams that prefer OSS control and transparent pricing, with growing adoption in startups and mid-market companies.
SaaS-Specific Capabilities
- OTEL-native design for tenant-isolated stacks.
- Kubernetes infra pack with DaemonSet collectors and presets.
- Enterprise SSO support for Google Workspace and SAML.
- Kafka visibility to monitor producer-consumer latency in event-driven SaaS.
Key Features
- Full-stack observability: metrics, logs, and traces in one platform.
- Native OTEL support to avoid vendor lock-in and simplify instrumentation.
- Distributed tracing with span-level visibility across services.
- Custom dashboards for JVM, Node.js, Python, and other runtimes.
- RUM and synthetic monitoring in managed versions.
- Self-hosted and managed SaaS options for flexibility.
Pros
- Free open-source version, making it very accessible for SaaS startups.
- Strong OTEL-native support—instrument once, reuse across tools.
- Transparent pricing on managed SaaS, competitive compared to incumbents.
- Good community backing and developer-friendly focus.
Cons
- Requires operational effort to manage at scale.
- Steep learning curve for new users
- Requires expertise to manage high-volume workloads
Pricing
- Logs: $0.30/GB ingested (15 days retention)
- Traces: $0.30/GB ingested (15 days retention)
- Metrics: $0.10 per 1M samples (1 month retention)
- Base Plan: Starts at $49/month
SigNoz Pricing for SaaS Companies At Scale
For a mid-sized SaaS company ingesting 25,000 GB of data from APM hosts, 10,000 GB from infrastructure hosts, and 10,000 GB from log hosts, while generating approximately 45,000 GB of observability data egress (charged by the cloud provider), the estimated cost would be around $16,000 per month.
Tech Fit
SigNoz is best for SaaS startups and developer-led teams that want open-source flexibility, strong OTEL alignment, and lower entry costs. It’s a great fit if you want to control hosting and data pipelines, but less suited for large enterprises needing advanced governance and compliance-ready features.
8. Better Stack

Known for
A modern observability platform focused on uptime monitoring, logging, and incident management. Better Stack is popular with SaaS teams that need simple, reliable monitoring with a strong emphasis on collaboration, dashboards, and affordability.
SaaS-Specific Capabilities
- Branded status pages with SSO, IP allowlists, or private views for enterprise tenants.
- Integrated incident and on-call management to reduce customer-facing downtime.
- Role-scoped checks and workspace rules for safe shared operations.
- Logs-to-metrics extraction for lightweight tenant SLIs.
Key Features
- Uptime monitoring with 30-second checks from 30+ global locations.
- Incident management with on-call schedules, status pages, and team alerts.
- Logs ingestion and search powered by a SQL-like query engine.
- Dashboards for real-time monitoring and visualization.
- Integrations with Slack, PagerDuty, Jira, and other SaaS tools.
- Collaboration-first approach, making it easy for dev and ops teams to work together.
Pros
- Clean, modern UI that’s easy to adopt for SaaS teams.
- Affordable pricing, especially compared to legacy uptime and APM tools.
- Strong focus on status pages and incident response, ideal for customer-facing SaaS.
- Good third-party integrations for alerting and workflows.
Cons
- Expensive when scaling operations.
- Users report missing features like outgoing webhooks that limit usability.
- Steep learning curve.
- Complex initial setup and configuration.
Pricing
- Free for Personal Projects: 10 monitors & heartbeats, Slack & E-mail alerts, 1 status
- Logs & Traces: $0.675 per extra GB (~$0.68/GB ingested). Retention billed at $0.0375/GB per week.
- Metrics: 2B data points included, then $7.50 per extra billion data points.
- Responder (Incident Management): $29 per license/month.
Better Stack Pricing for SaaS Companies At Scale
For a mid-sized SaaS company operating 125 APM hosts, ingesting 25TB(~25, OOOGB) of data by APM hosts, 10TB (~10,000GB) of logs, 10TB (~10,000GB) of infra hosts, and 45,000GB of observability data (charged by the cloud provider), the cost would come around $20,550/month.
Tech Fit
Better Stack is best for SaaS teams that prioritize uptime, incident response, and log visibility over full-stack APM. It’s a great fit for startups and growth-stage companies that want status pages, affordable monitoring, and clean collaboration features, but less suitable for engineering-heavy SaaS platforms that need deep distributed tracing and advanced OTEL pipelines.
Conclusion
SaaS companies face unique challenges: unpredictable outages that cost millions, noisy neighbor issues in multi-tenant environments, and fast-paced deployments that demand instant feedback. Legacy monitoring tools often add to the pain with opaque pricing and vendor lock-in, making observability both expensive and hard to scale.
That’s why choosing the right APM platform is critical. Tools like Datadog, New Relic, Dynatrace, Grafana, Elastic, SigNoz, Coralogix, and Better Stack each bring their strengths—but they also come with trade-offs in cost, complexity, or compliance.
CubeAPM stands out as the best fit for SaaS teams by combining OpenTelemetry-native ingestion, smart sampling that cuts costs by up to 80%, and flat $0.15/GB pricing with no per-user fees. With self-hosted options and data residency controls, CubeAPM helps SaaS businesses scale observability without runaway costs or compliance risks.
Disclaimer: The information in this article reflects the latest details available at the time of publication and may change as technologies and products evolve.
FAQs
1. What is the best APM tool for SaaS companies ?
The best APM tool depends on your priorities. CubeAPM is ideal for SaaS teams needing cost predictability, OpenTelemetry-native ingestion, and compliance controls. Other strong tools include Datadog, New Relic, Dynatrace, Grafana Cloud, Elastic APM, SigNoz, Coralogix, and Better Stack.
2. Why do SaaS companies need APM tools?
SaaS platforms run on microservices, Kubernetes, and multi-tenant architectures where outages and latency directly impact customers. APM tools provide end-to-end visibility into logs, metrics, traces, and user sessions—helping teams cut downtime, debug faster, and protect recurring revenue.
3. Which APM tool is the most cost-effective for SaaS?
CubeAPM offers the most predictable pricing at $0.15/GB ingestion with no per-user fees. For a SaaS ingesting 10 TB/month, CubeAPM often costs under $2K/month, compared to $8K–$10K/month for Datadog or New Relic at the same scale.
4. Do APM tools support SaaS compliance requirements?
Yes, but support varies. Some vendors (like CubeAPM and Elastic) offer self-hosted or region-specific deployment for HIPAA, GDPR, or DPDP compliance. Others, such as Datadog or Better Stack, are SaaS-only, which may not meet strict regulatory requirements.
5. How do I choose the right APM tool for my SaaS company?
Focus on key criteria:
- Pricing transparency (avoid per-user/per-host surprises).
- OpenTelemetry support (to avoid vendor lock-in).
- Sampling efficiency (keep costs down at scale).
- Multi-tenant visibility (noisy neighbor isolation).
- Compliance & deployment options (SaaS vs self-host).


