










Log retention drives the majority of observability spend. Over 50% of observability budgets go to logs alone, and retention policies directly determine how fast that bill compounds. A 90-day retention policy costs three times more than 30 days for the same log volume, but cutting retention to save money often means losing the data needed to investigate incidents, meet compliance requirements, or analyze long-term trends.
This guide walks through five proven strategies to reduce log retention costs without sacrificing observability. Each section includes implementation steps, real configuration examples, and cost impact estimates based on common team sizes and data volumes.
Prerequisites
Before implementing log retention cost reduction strategies, ensure you have:
- Access to your current log ingestion and storage metrics (total GB/month, current retention period, indexing percentage)
- Admin access to your logging infrastructure (log shippers, storage buckets, observability platform)
- A list of log types by criticality (production errors vs health checks vs debug logs)
- Current monthly observability spend broken down by log ingestion, indexing, and storage
- Defined compliance or audit requirements that mandate minimum retention periods for specific log types
Step 1: Audit Current Log Volume and Identify High-Volume Low-Value Sources
The first step is understanding what logs you are ingesting, how much storage each log type consumes, and which sources generate volume without providing proportional observability value.
Most teams discover that 70-80% of log volume comes from sources that provide minimal troubleshooting value: Kubernetes health checks that repeat every 10 seconds, debug logs left enabled in production, verbose third-party library output, and successful API responses logged at INFO level.
How to audit log sources:
Start by querying your log storage or observability platform to identify the top 10 sources by daily volume. In most platforms, this query surfaces the services, namespaces, or applications generating the most log lines.
Example query in a log management tool:
SELECT source, COUNT(*) as log_count, SUM(size_bytes) as total_bytes
FROM logs
WHERE timestamp > NOW() - INTERVAL 7 DAYS
GROUP BY source
ORDER BY total_bytes DESC
LIMIT 10;For each high-volume source, ask:
- Does this log appear during normal operation or only when something breaks?
- If we lost this log type for 24 hours, would incident response be delayed?
- Does this log repeat identical information at high frequency?
Common high-volume low-value log types to target for reduction:
- Kubernetes liveness and readiness probe successes
- Load balancer health checks (200 OK responses every few seconds)
- Successful authentication events in high-traffic applications
- Verbose third-party SDK output (AWS SDK debug logs, database driver trace logs)
- Repeated “starting task” or “task completed successfully” messages
Practo reduced log ingestion by 40% in one week by filtering out Kubernetes health check logs and AWS SDK debug output that accounted for 12 TB/month but was never queried during incident response.
Tag and categorize logs by value tier:
Once you have identified high-volume sources, assign each log type to a value tier:
- Tier 1 (critical): Production errors, security events, transaction failures, user-impacting issues
- Tier 2 (operational): Service start/stop events, configuration changes, non-critical warnings
- Tier 3 (diagnostic): Debug logs, health checks, verbose third-party output, repeated success messages
This categorization becomes the foundation for applying different retention policies and sampling strategies in the next steps.
Step 2: Implement Log-Level Routing with Differentiated Retention Policies
Not all logs need the same retention period. Routing logs to different storage tiers based on their value tier allows you to keep critical logs searchable for 90+ days while storing low-value logs for only 7-14 days or sending them to cold storage immediately.
How log-level routing reduces costs:
Instead of applying a single 30-day or 90-day retention policy to all logs, you route Tier 1 logs to hot indexed storage with long retention, Tier 2 logs to warm storage with shorter retention, and Tier 3 logs to cold object storage or discard them entirely after a few days.
This approach cuts storage costs by 60-70% because the bulk of your log volume (Tier 3) is either sampled heavily or stored in low-cost cold storage that costs $0.01-0.02/GB/month instead of $0.10-0.30/GB/month for indexed hot storage.
Implementation steps:
Most modern log shippers (Fluentd, Fluent Bit, Vector, Logstash) support routing based on log attributes like severity, source, namespace, or custom tags.
Example Fluent Bit configuration routing logs by severity:
[INPUT]
    Name tail
    Path /var/log/containers/*.log
    Parser docker
    Tag kube.*
[FILTER]
    Name modify
    Match kube.*
    Add tier critical
    Condition Key log Regex (ERROR|CRITICAL|FATAL|security_event)
[FILTER]
    Name modify
    Match kube.*
    Add tier operational
    Condition Key log Regex (WARN|INFO)
[FILTER]
    Name modify
    Match kube.*
    Add tier diagnostic
    Condition Key log Regex (DEBUG|TRACE|health_check)
[OUTPUT]
    Name s3
    Match kube.*
    Condition Key tier critical
    bucket observability-logs-hot
    region us-east-1
    store_dir /var/log/fluent-bit-s3
    total_file_size 100M
    upload_timeout 2m
[OUTPUT]
    Name s3
    Match kube.*
    Condition Key tier diagnostic
    bucket observability-logs-cold
    region us-east-1
    store_dir /var/log/fluent-bit-s3-cold
    total_file_size 250M
    upload_timeout 5m
storage_class GLACIER_IRThis configuration sends critical logs to a hot S3 bucket for immediate indexing and long retention, while diagnostic logs go directly to S3 Glacier Instant Retrieval at 68% lower storage cost.
Apply retention policies per storage tier:
In your observability platform or log management tool, configure retention by bucket or index:
- Tier 1 (critical): 90-180 days in hot indexed storage
- Tier 2 (operational): 30-60 days in warm storage
- Tier 3 (diagnostic): 7-14 days in cold storage, or no indexing at all
If using cloud object storage directly, apply S3 lifecycle policies to transition older logs to cheaper storage classes:
{
  "Rules": [
    {
      "Id": "TransitionCriticalLogsToIA",
      "Status": "Enabled",
      "Prefix": "critical/",
      "Transitions": [
        {
          "Days": 30,
          "StorageClass": "STANDARD_IA"
        },
        {
          "Days": 90,
          "StorageClass": "GLACIER_IR"
        }
      ]
    },
    {
      "Id": "ExpireDiagnosticLogsAfter14Days",
      "Status": "Enabled",
      "Prefix": "diagnostic/",
      "Expiration": {
        "Days": 14
      }
    }
  ]
}This policy keeps critical logs in Standard S3 for 30 days, transitions to Infrequent Access for the next 60 days, then moves to Glacier Instant Retrieval after 90 days. Diagnostic logs expire entirely after 14 days.
Cleartax implemented log-level routing and reduced storage costs by 65% while maintaining full 90-day retention for production error logs and security events. Their monthly log storage bill dropped from $8,200 to $2,900 after routing Kubernetes health checks and debug logs to a 7-day cold storage tier.
Step 3: Apply Sampling to High-Frequency Repetitive Logs
Even after filtering low-value logs, some sources generate high volumes of similar messages that are useful during incidents but do not need every single event stored. Sampling retains a statistically representative subset while discarding the rest.
When to use sampling:
Sampling works best for logs that:
- Repeat identical messages at high frequency (health checks, periodic task completions)
- Contain useful information but do not require every instance to be stored
- Are queried for aggregate trends rather than individual events
Do not sample logs where every event matters: production errors, security events, transaction failures, or user-impacting issues. Missing one critical error event during an incident investigation can delay root cause identification.
Sampling strategies:
There are three common sampling approaches:
- Rate-based sampling: Keep 1 in every N log lines (e.g., sample 10% of health check logs)
- Time-based sampling: Keep one log per time window (e.g., one health check log per minute instead of every 10 seconds)
- Hash-based sampling: Sample based on a deterministic hash of log content to ensure the same message type is always sampled at the same rate
Example Fluent Bit configuration using rate-based sampling:
[FILTER]
    Name sampling
    Match kube.*
    Condition Key message Regex health_check_success
Percentage 10This filter keeps 10% of health check success logs and drops the other 90%.
Example Vector configuration using time-based sampling:
[transforms.sample_health_checks]
type = "sample"
inputs = ["kubernetes_logs"]
rate = 6
key_field = "message"
exclude.message.regex = "health_check_success"This configuration samples health check logs to one event every 6 seconds instead of logging every single check.
Cost impact of sampling:
A Kubernetes cluster running 200 pods with health checks every 10 seconds generates approximately 1.7 million health check log lines per day. At an average log size of 200 bytes per line, that is 340 MB/day or 10.2 GB/month just from health checks.
Applying 90% sampling reduces this to 1 GB/month. If your log storage cost is $0.20/GB/month, that is a $1.84/month savings per 200-pod cluster. Scale this across 10 clusters and you save $220/month, or $2,640/year, from health check sampling alone.
Redbus applied sampling to Kubernetes health checks and AWS ELB access logs, reducing log ingestion by 22% (4.8 TB/month) without impacting incident response. Their sampling configuration kept 100% of errors and warnings but sampled successful health checks at 5% and routine API 200 responses at 20%.
Step 4: Compress Logs Before Storage and Use Efficient Serialization Formats
Most log management platforms compress logs automatically, but the compression ratio and format choice significantly impact storage costs. Switching from uncompressed JSON to compressed JSON or a binary format like Parquet can reduce storage by 70-85%.
Log compression basics:
Compression reduces storage size by identifying repeated patterns in log data and encoding them more efficiently. Text-based logs (JSON, plain text) compress well because they contain repetitive field names, timestamps, and common strings.
Compression algorithms commonly used for logs:
- gzip: Standard compression, 60-70% size reduction, widely supported
- zstd: Faster compression and decompression than gzip, 65-75% size reduction
- lz4: Extremely fast, 50-60% size reduction, good for high-throughput pipelines
Enable compression in log shippers:
Most log shippers support compression before sending logs to storage or an observability platform.
Example Fluentd configuration with gzip compression:
<match **>
  @type s3
  s3_bucket observability-logs
  s3_region us-east-1
  path logs/
  time_slice_format %Y%m%d%H
  compress gzip
  <buffer time>
    timekey 3600
    timekey_wait 10m
    chunk_limit_size 256m
  </buffer>
</match>This configuration compresses log chunks with gzip before uploading to S3, reducing storage by approximately 65%.
Use efficient serialization formats:
JSON is human-readable but inefficient for storage. Each log line repeats field names like timestamp, level, message, service even though they are identical across millions of log lines.
Binary formats like Parquet store field names once and encode values compactly:
- JSON: 500 bytes per log line
- JSON + gzip: 150 bytes per log line (70% reduction)
- Parquet + Snappy: 80 bytes per log line (84% reduction)
If your observability platform supports Parquet ingestion, converting logs to Parquet before long-term storage can cut retention costs by 75-85% compared to raw JSON.
Example cost comparison for 50 TB/month log volume over 90-day retention:
| Format | Storage per month | 90-day cost at $0.02/GB/month |
|---|---|---|
| Raw JSON | 50 TB | $3,000 |
| JSON + gzip | 15 TB | $900 |
| Parquet + Snappy | 8 TB | $480 |
Switching from raw JSON to Parquet reduces monthly storage costs by $2,520, or $30,240/year.
Mamaearth enabled gzip compression in their Fluent Bit pipeline and switched long-term log storage to Parquet format, reducing storage costs by 78% while keeping all logs fully queryable. Their 90-day retention cost dropped from $11,400/month to $2,500/month.
Step 5: Use Smart Sampling to Retain High-Value Traces While Reducing Volume
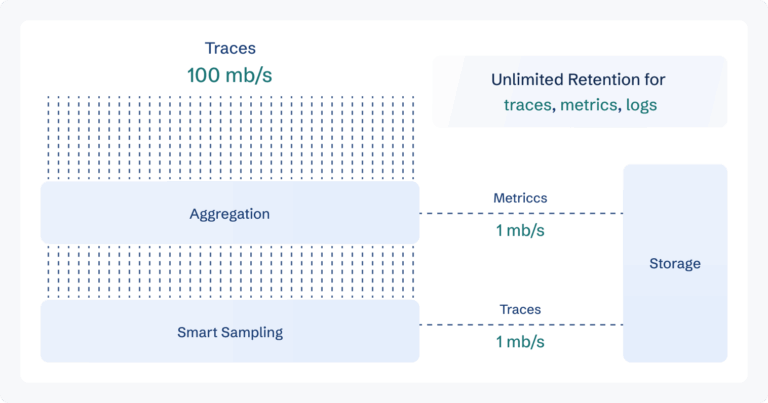
Traditional sampling uses a fixed percentage (sample 10% of all logs) or random selection, which often discards the exact logs needed during incident investigation. Smart sampling (also called intelligent sampling or context-aware sampling) selectively retains logs based on attributes like error status, latency, user impact, or transaction type.
How smart sampling differs from random sampling:
Random sampling keeps 10% of all logs regardless of content. If 95% of your logs are routine successful operations and 5% are errors, random 10% sampling will capture most successful operations and potentially miss critical errors.
Smart sampling prioritizes retention of logs that are statistically rare or contextually important:
- Always keep logs with error severity or HTTP 5xx status
- Always keep logs from high-latency requests (p95 or higher)
- Always keep logs associated with specific high-value user actions (checkout, payment)
- Sample routine success logs at 5-10%
Implementing smart sampling:
Smart sampling requires log shippers or observability platforms that support conditional filtering based on log attributes.
Example Vector configuration for smart sampling:
[transforms.smart_sample]
type = "filter"
inputs = ["application_logs"]
# Always keep errors
[[transforms.smart_sample.conditions]]
type = "check_fields"
"level.eq" = "ERROR"
# Always keep high-latency requests
[[transforms.smart_sample.conditions]]
type = "check_fields"
"response_time.gt" = 1000
# Sample successful requests at 5%
[transforms.sample_success]
type = "sample"
inputs = ["application_logs"]
rate = 20
exclude.level.eq = "ERROR"
exclude.response_time.gt = 1000This configuration keeps 100% of error logs and slow requests (>1 second response time) while sampling successful fast requests at 5%.
Cost impact of smart sampling:
A SaaS application processing 10 million API requests per day generates approximately 200 GB/day of logs (20 KB per request). Over 30 days, that is 6 TB of log data.
Applying 10% random sampling reduces this to 600 GB/month. But random sampling discards 90% of errors along with 90% of successes, making incident investigation harder.
Smart sampling that keeps 100% of errors (assuming 2% error rate) and samples 5% of successes reduces log volume to:
- Errors: 2% of 6 TB = 120 GB (100% retained)
- Successes: 98% of 6 TB = 5.88 TB × 5% sampling = 294 GB
- Total: 414 GB/month
This is 31% lower volume than random 10% sampling, while retaining every single error event. At $0.30/GB for indexed storage, smart sampling saves $56/month compared to random sampling and $1,692/month compared to no sampling.
Delhivery implemented smart sampling using reducing observability costs without losing visibility strategies and reduced log storage by 72% while retaining 100% of production errors and high-latency traces. Their monthly log bill dropped from $14,800 to $4,100 without losing any critical troubleshooting data.
Step 6: Archive Cold Logs to Object Storage and Enable On-Demand Rehydration
For compliance or long-term trend analysis, some logs must be retained for 1-3 years even though they are rarely queried. Storing these logs in indexed hot storage at $0.20-0.40/GB/month becomes prohibitively expensive. Cold object storage (AWS S3 Glacier, Azure Archive, GCP Coldline) costs $0.004-0.01/GB/month, reducing long-term retention costs by 95%.
When to use cold storage:
Cold storage makes sense for:
- Compliance-driven retention where logs must be kept for 1-3 years but are rarely accessed
- Historical logs older than 90 days that are no longer needed for active troubleshooting
- Archived logs from decommissioned services that must be retained for audit purposes
Cold storage has retrieval delays (minutes to hours) and retrieval costs ($0.01-0.03/GB), so it is not suitable for logs needed during active incident response.
Implementation steps:
Most observability platforms support automatic archival to object storage after a defined period.
Example CubeAPM configuration for automatic cold archival:
CubeAPM retains all logs in hot indexed storage by default. To reduce costs for logs older than 90 days, configure lifecycle policies in your underlying storage bucket (S3, Azure Blob, GCP Storage) to transition logs to cold tiers automatically.
Example S3 lifecycle policy:
{
  "Rules": [
    {
      "Id": "ArchiveLogsAfter90Days",
      "Status": "Enabled",
      "Filter": {
        "Prefix": "logs/"
      },
      "Transitions": [
        {
          "Days": 90,
          "StorageClass": "GLACIER_IR"
        },
        {
          "Days": 180,
          "StorageClass": "DEEP_ARCHIVE"
        }
      ]
    }
  ]
}This policy moves logs to Glacier Instant Retrieval after 90 days (retrieval in minutes, $0.004/GB/month storage) and Deep Archive after 180 days (retrieval in 12 hours, $0.00099/GB/month storage).
On-demand rehydration:
When you need to query archived logs, most platforms support rehydration: temporarily moving logs back to hot storage for querying.
Rehydration workflow:
- Identify the date range of logs needed for investigation
- Request rehydration via your observability platform or directly from object storage
- Wait for retrieval (minutes for Glacier IR, hours for Deep Archive)
- Query logs normally once rehydration completes
- Logs return to cold storage automatically after 24-48 hours
Rehydration costs are typically $0.01-0.03/GB, which is acceptable for infrequent access. If you are rehydrating logs weekly, cold storage may not save money compared to keeping logs in warm indexed storage.
Cost comparison: hot vs cold storage for 1-year retention
Scenario: 50 TB/month log volume, 1-year retention requirement
| Storage tier | Monthly cost | Annual cost |
|---|---|---|
| Hot indexed ($0.30/GB/month) | $15,000 | $180,000 |
| Warm indexed ($0.10/GB/month) | $5,000 | $60,000 |
| Cold Glacier IR ($0.004/GB/month) | $200 | $2,400 |
Cold storage reduces 1-year retention cost by $177,600 compared to hot indexed storage.
Practo moved logs older than 60 days to S3 Glacier Instant Retrieval and reduced annual retention costs by 94%. Their observability platform keeps 60 days of logs in hot indexed storage for active troubleshooting, while 10 months of historical logs are archived in Glacier at $0.004/GB/month. This approach cut their annual log storage bill from $96,000 to $8,800.
Troubleshooting Common Issues
Issue: Logs are being dropped during high-traffic spikes
Cause: Log shipper buffers are full because ingestion rate exceeds buffer flush rate.
Solution: Increase buffer size and flush interval in your log shipper configuration. Example Fluent Bit fix:
[OUTPUT]
    Name s3
    Match *
    bucket observability-logs
    region us-east-1
    <buffer>
        chunk_limit_size 512m
        flush_interval 10s
        retry_limit 5
</buffer>This increases buffer to 512 MB per chunk and flushes every 10 seconds instead of waiting for the chunk to fill.
Issue: Sampled logs are missing critical events during incident investigation
Cause: Sampling is applied uniformly without prioritizing high-value logs.
Solution: Switch from random sampling to smart sampling that always retains errors, high-latency events, and user-impacting failures. See Step 5 for implementation examples.
Issue: Cold storage retrieval takes too long to be useful during incidents
Cause: Logs are stored in Deep Archive or Glacier Flexible Retrieval, which have 12-hour retrieval times.
Solution: Use Glacier Instant Retrieval for logs that may be needed within hours. Glacier IR retrieves in milliseconds to minutes, making it practical for incident investigation. Only use Deep Archive for logs that will never be queried urgently (compliance archives, decommissioned service logs).
Issue: Observability platform shows lower log volume but storage costs have not decreased
Cause: Indexed log volume decreased, but raw ingested logs are still being stored and billed separately.
Solution: Verify that your platform or storage bucket is actually deleting logs after the retention period expires. Some platforms charge separately for ingestion and storage, so reducing indexed logs does not reduce raw storage costs. Check for orphaned S3 buckets or storage volumes that are accumulating old logs without expiration policies.
Issue: Compliance team requires 2-year retention but observability platform only supports 90 days
Cause: Most observability platforms limit indexed retention to 30-90 days due to cost and performance constraints.
Solution: Use cold object storage for long-term compliance retention while keeping only 30-90 days in the observability platform for active troubleshooting. Configure log shippers to send logs to both the observability platform and an S3 bucket with a 2-year lifecycle policy. This satisfies compliance without paying for 2 years of indexed storage.
Log retention costs scale linearly with volume and retention period, but the strategies in this guide can reduce storage bills by 60-80% without sacrificing observability or compliance. The key is applying different retention policies to different log types based on their troubleshooting value, using compression and efficient formats, and leveraging cold storage for long-term archives.
The most effective approach combines all five strategies: audit and filter low-value logs first, route remaining logs to differentiated storage tiers, apply smart sampling to high-frequency sources, enable compression, and archive old logs to cold object storage with on-demand rehydration.
For teams already using how to evaluate an observability platform that supports tiered storage and smart sampling, these strategies can be implemented in days. Teams on legacy platforms may need to migrate to a more cost-efficient architecture to unlock these savings.
Disclaimer: The information in this article reflects the latest details available at the time of publication and may change as technologies and products evolve. Features, pricing, and plan limits can change over time. Always verify the latest information directly with the vendor before making purchasing or deployment decisions.
Frequently Asked Questions
How long should logs be retained?
Retention periods depend on three factors: compliance requirements, troubleshooting needs, and cost constraints. Most teams retain production error logs for 90-180 days, operational logs for 30-60 days, and debug or health check logs for 7-14 days. Regulated industries (healthcare, finance) often require 1-3 years for audit logs. Retention beyond 90 days should use cold object storage to reduce costs.
Which of the following are best practices for data retention?
Best practices include applying differentiated retention policies by log type instead of a single retention period for all logs, using cold object storage for compliance-driven long-term retention, enabling compression before storage, implementing smart sampling to reduce volume while retaining high-value events, and regularly auditing log sources to remove low-value high-volume logs.
What is designed for long-term data retention?
Cold object storage systems like AWS S3 Glacier, Azure Archive Storage, and GCP Coldline/Archive are purpose-built for long-term retention at $0.001-0.01/GB/month. These tiers support multi-year retention at 95% lower cost than hot indexed storage but have retrieval delays and per-GB retrieval fees.
How can I reduce log retention costs without losing compliance?
Use tiered storage: keep 30-90 days in hot indexed storage for troubleshooting, then automatically move logs to cold object storage for compliance retention. This satisfies regulatory requirements while paying $0.004/GB/month for archived logs instead of $0.20-0.40/GB/month for indexed storage.
What is smart sampling and how does it differ from random sampling?
Smart sampling selectively retains logs based on attributes like error status, latency, or transaction type, always keeping high-value events while sampling routine successes at low rates. Random sampling keeps a fixed percentage of all logs regardless of content, often discarding critical error events. Smart sampling reduces volume by 70-80% while retaining 100% of errors and high-latency requests.
How much can compression reduce log storage costs?
Compression reduces log storage by 60-85% depending on format. Text logs (JSON, plain text) with gzip compression achieve 65-70% reduction. Binary formats like Parquet with Snappy compression achieve 80-85% reduction. A team storing 50 TB/month uncompressed can reduce this to 8 TB/month with Parquet, saving $2,520/month at $0.02/GB storage cost.
Should I delete health check logs entirely or sample them?
Sample health check logs at 5-10% instead of deleting entirely. Health checks rarely provide troubleshooting value but can be useful for correlating infrastructure events (node restarts, network partitions) with application behavior. Sampling keeps enough data for correlation without consuming storage for millions of identical success messages.