










Hibernate’s object-relational mapping abstracts away database interactions so cleanly that it also hides the performance problems they cause. A single getOrderItems() call on a list of 200 orders can silently fire 201 SQL statements. A missing index on a joined column makes every findByCustomerId call a full table scan. Neither shows up in your application logs unless you configure Hibernate to tell you.
This guide covers how Hibernate monitoring works, which configuration properties actually matter, how to detect and fix the N+1 select problem, and how to surface session-level metrics in both development and production environments.
What Is Hibernate Monitoring?
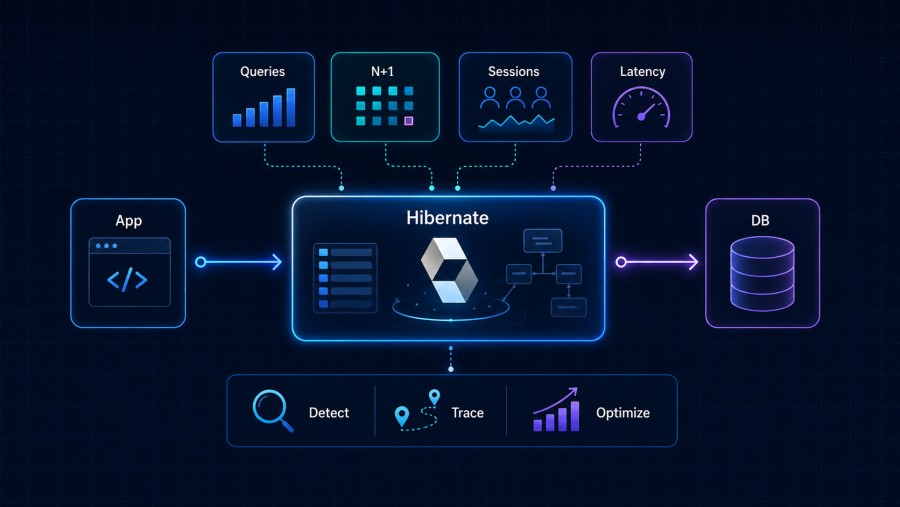
Hibernate monitoring is the practice of instrumenting your JPA/Hibernate layer to expose what SQL it generates, how long each query takes, and how many database round trips each session makes. Without it, Hibernate behaves as a black box; your application appears to work correctly while issuing three times as many queries as it should.
There are three distinct problems Hibernate monitoring helps you catch:
- Slow queries: individual SQL statements that exceed an acceptable execution threshold, usually caused by missing indexes or inefficient JPQL
- N+1 selects: a pattern where loading a parent collection triggers one additional query per child record, multiplying database calls exponentially
- Session inefficiency: sessions that open too many connections, keep transactions open too long, or load entities they never use
Hibernate monitoring matters in production because these problems rarely appear under light load. An N+1 issue on a 10-record result set adds 10 queries. The same query on a 500-record result set during peak traffic adds 500 queries and can saturate your database connection pool.
According to the 2024 JVM Ecosystem Report by Snyk, Hibernate remains the dominant JPA provider in Java production environments, used by the majority of Spring Boot applications, making its monitoring behavior directly relevant to most Java backend teams.
How Hibernate Monitoring Works
Hibernate exposes performance data through three separate mechanisms, and most teams only activate one of them.
SQL logging via the org.hibernate.SQL category
The most basic form of monitoring. Set org.hibernate.SQL to DEBUG in your logging framework, and Hibernate prints every SQL statement it executes to your log output. In Log4j2:
<Logger name="org.hibernate.SQL" level="DEBUG" additivity="false">
    <AppenderRef ref="Console"/>
</Logger>In application.properties for Spring Boot:
logging.level.org.hibernate.SQL=DEBUG
logging.level.org.hibernate.orm.jdbc.bind=TRACEThe second line logs bind parameter values alongside each statement, which is essential for debugging parameterized queries. Without it, you see WHERE id = ? instead of WHERE id = 42.
This approach works for development but produces massive log volume in production and adds measurable latency to every query. It is not suitable for production use at scale.
Slow query logging via log_queries_slower_than_ms
Hibernate 5.4.5 and later supports a slow query threshold that logs only statements exceeding a configured execution time. This is the approach you should use in production.
spring.jpa.properties.hibernate.session.events.log.LOG_QUERIES_SLOWER_THAN_MS=200Or in hibernate.cfg.xml:
<property name="hibernate.session.events.log.LOG_QUERIES_SLOWER_THAN_MS">200</property>With this configuration, Hibernate uses its StatisticalLoggingSessionEventListener to time each query and write a log entry only when the threshold is exceeded. The log output includes the SQL, execution time in milliseconds, and the number of rows returned.
The threshold value of 200ms is a reasonable starting point. Teams with strict SLAs often lower this to 50–100ms after an initial baseline period. Unlike full SQL logging, this adds negligible overhead because the timing measurement happens regardless and only the logging itself is conditional.
Hibernate statistics via generate_statistics
Enabling hibernate.generate_statistics=true activates Hibernate’s internal statistics collector, which tracks per-session and cumulative metrics including query counts, execution times, cache hit/miss rates, and entity load counts.
spring.jpa.properties.hibernate.generate_statistics=true
logging.level.org.hibernate.stat=DEBUGAt the end of each session, Hibernate writes a summary to the log:
Session Metrics {
  16048 nanoseconds spent acquiring 1 JDBC connections;
  0 nanoseconds spent releasing 0 JDBC connections;
  432132 nanoseconds spent preparing 9 SQL statements;
  10202702 nanoseconds spent executing 9 SQL statements;
  0 nanoseconds spent executing 0 JDBC batches;
  9 flushes as part of loader execution(s);
}This is where N+1 problems become obvious. A session that prepares and executes 9 SQL statements when you expected 1 is telling you something is wrong.
The performance impact of generate_statistics: Hibernate’s own documentation notes that collecting statistics adds overhead, and this is commonly referenced as the reason to avoid it in production. In practice, the overhead is measurable (typically 5–15% additional processing time per session in high-throughput scenarios), and the recommendation to disable it in production holds for most teams. Use it in staging or during profiling windows rather than continuously.
Detecting and Fixing N+1 Select Problems
N+1 is the most common and most damaging Hibernate performance pattern. Understanding exactly when it triggers and how to fix it is what separates teams that find these issues in development from teams that find them in production.
Why N+1 happens
Take a standard one-to-many mapping:
@Entity
public class Order {
    @OneToMany(fetch = FetchType.LAZY)
    private List<OrderItem> items;
}The LAZY fetch type is the default and the correct default for most cases. The problem occurs when application code loads a list of orders and then accesses the items collection on each one:
List<Order> orders = entityManager.createQuery("SELECT o FROM Order o", Order.class)
    .getResultList(); // 1 query
for (Order order : orders) {
    System.out.println(order.getItems().size()); // 1 query per order = N queries
}For 100 orders, this produces 101 queries. For 1,000 orders, it produces 1,001. The SQL logging output makes this immediately visible – you see the same SELECT on order_items repeated with different order_id bind values.
Detecting N+1 via session statistics
Enable hibernate.generate_statistics=true and look at the statement count per session. If a use case that should need 2–3 queries is reporting 150+, you have an N+1 problem. The StatisticalLoggingSessionEventListener output shows prepared statement count, which is the fastest signal.
In Spring Boot, you can access statistics programmatically:
@Autowired
private EntityManagerFactory entityManagerFactory;
public void printStats() {
    Statistics stats = entityManagerFactory.unwrap(SessionFactory.class).getStatistics();
    System.out.println("Query count: " + stats.getQueryExecutionCount());
    System.out.println("Entity load count: " + stats.getEntityLoadCount());
}Fixing N+1 with JOIN FETCH
The standard fix is to rewrite the JPQL query to eagerly fetch the association when you know you will access it:
List<Order> orders = entityManager.createQuery(
    "SELECT DISTINCT o FROM Order o JOIN FETCH o.items", Order.class)
.getResultList();This produces a single SQL JOIN that retrieves both orders and their items together. The DISTINCT prevents duplicate Order objects in the result caused by the join.
Fixing N+1 with @EntityGraph
For Spring Data JPA repositories, @EntityGraph is cleaner than rewriting JPQL:
@EntityGraph(attributePaths = {"items"})
List<Order> findAllWithItems();This instructs Hibernate to perform a JOIN FETCH without modifying the JPQL query string.
Fixing N+1 with batch fetching
When JOIN FETCH is not appropriate (for example, when the association has its own pagination), Hibernate’s batch fetching loads lazy associations in configurable batch sizes:
spring.jpa.properties.hibernate.default_batch_fetch_size=25With this setting, when Hibernate encounters 100 uninitialized items collections, it loads them in batches of 25, executing 4 queries instead of 100. This is a pragmatic fix for existing codebases where refactoring every JPQL query is not feasible.
The Hibernate N+1 detection approach most teams miss
Most guides suggest reading the log output manually to spot repeated queries. A faster approach is to write an integration test that asserts on query count using Hibernate’s statistics API:
@Test
public void loadOrdersShouldNotExceedFiveQueries() {
    Statistics stats = sessionFactory.getStatistics();
    stats.setStatisticsEnabled(true);
    stats.clear();
    orderService.getOrdersWithItems();
    long queryCount = stats.getPrepareStatementCount();
    assertThat(queryCount).isLessThanOrEqualTo(5);
}This turns N+1 detection into a failing CI test rather than a production incident. It is the most reliable way to prevent regressions.
Key Hibernate Session Metrics to Track
Beyond slow queries and N+1 counts, Hibernate’s statistics API exposes metrics that matter for understanding session health over time.
Query execution metrics
| Metric | Method | What it tells you |
|---|---|---|
| Total query count | getQueryExecutionCount() | Volume of SQL executed per session |
| Max query time | getQueryExecutionMaxTime() | Worst-case query latency |
| Slowest query | getQueryExecutionMaxTimeQueryString() | Which JPQL caused the worst latency |
| Entity loads | getEntityLoadCount() | How many entities were loaded from DB |
| Entity fetches | getEntityFetchCount() | How many lazy loads triggered |
A high getEntityFetchCount() relative to getEntityLoadCount() is a strong signal of lazy loading being overused. If you load 50 orders and fetch 200 entity associations, you have N+1 patterns active.
Cache metrics
| Metric | What it tells you |
|---|---|
getSecondLevelCacheHitCount() | How often L2 cache served requests |
getSecondLevelCacheMissCount() | How often L2 cache was bypassed |
getQueryCacheHitCount() | Query result cache effectiveness |
A second-level cache hit rate below 80% usually means either the cache is too small, the entity eviction strategy is too aggressive, or the entities being cached change too frequently to benefit from caching.
Connection pool metrics
Hibernate statistics alone do not expose connection pool state. For that, pair Hibernate monitoring with connection pool metrics from HikariCP, which is the default pool in Spring Boot:
spring.datasource.hikari.maximum-pool-size=10
management.endpoints.web.exposure.include=health,metricsHikariCP exposes metrics at /actuator/metrics/hikaricp.connections.active when Spring Boot Actuator is on the classpath. A pool running at capacity (active = maximum-pool-size) combined with high Hibernate query counts points to session duration being too long, not just query speed.
Best Practices for Hibernate Monitoring
Use slow query logging in production, full logging in development
LOG_QUERIES_SLOWER_THAN_MS adds less than 1ms of overhead per session in most workloads. Full SQL logging with org.hibernate.SQL=DEBUG can double log volume and measurably slow your application. Reserve full logging for local development and short profiling windows.
Set the slow query threshold based on your actual SLA
If your API must respond in 300ms and your typical non-database processing takes 80ms, your database budget is around 220ms total. Setting the Hibernate slow query threshold at 150ms gives you a 70ms buffer and catches the queries that are individually too slow before they compound.
Never enable generate_statistics permanently in production
Use it in staging or during scheduled profiling windows. The overhead is real. A more sustainable approach is to expose SessionFactory statistics via Micrometer and scrape them at a low frequency (every 60 seconds) rather than collecting per-session detail continuously.
Expose Hibernate metrics via Micrometer for Spring Boot
Spring Boot Actuator with Micrometer can export Hibernate statistics to Prometheus or any compatible backend:
spring.jpa.properties.hibernate.generate_statistics=true
management.metrics.export.prometheus.enabled=trueMicrometer registers Hibernate metrics under the hibernate.* namespace. Useful metrics include hibernate.queries (counter), hibernate.query.seconds (timer), and hibernate.sessions.open (counter). These give you trend data without the per-session log noise.
Add N+1 detection to your CI pipeline
As shown in the detection section, asserting on getPrepareStatementCount() in integration tests catches N+1 regressions before they reach production. This is more reliable than periodic log reviews and does not depend on any external tooling.
Correlate Hibernate slow queries with request traces
A slow Hibernate query in isolation tells you the SQL was slow. Correlating it with the HTTP request that triggered it tells you which endpoint is slow, which user is affected, and whether it is happening consistently or only under specific conditions. This correlation is the gap between logging and full observability.
Tools and Implementation
Hibernate’s native capabilities
The built-in options, LOG_QUERIES_SLOWER_THAN_MS, generate_statistics, and StatisticalLoggingSessionEventListener, cover detection in development and controlled profiling in production. They require no additional dependencies and work with any Hibernate 5.4+ application.
For Spring Boot teams, enabling Spring Boot Actuator and Micrometer adds structured metric export with minimal configuration. This is the right baseline for every production Hibernate application.
DataSource Proxy
datasource-proxy is an open source JDBC proxy library that intercepts queries before they reach the database driver. It gives you query logging, parameter binding, and execution time measurement independent of Hibernate’s internal logging. This is useful when you need consistent query metrics across JPA and native JDBC calls in the same application.
@Bean
public DataSource dataSource(DataSourceProperties properties) {
    DataSource actual = properties.initializeDataSourceBuilder().build();
    return ProxyDataSourceBuilder.create(actual)
        .logSlowQueryBySlf4j(200, TimeUnit.MILLISECONDS)
        .countQuery()
        .build();
}The advantage over Hibernate’s slow query log is that it works for native JDBC queries and gives you total query counts per request, which you can assert against in tests.
P6Spy
P6Spy is a JDBC driver wrapper that logs all database interactions at the driver level. It is more invasive than datasource-proxy (it replaces your JDBC driver) but produces comprehensive output including execution times, row counts, and full SQL with parameters already substituted. It is well-suited for development and profiling but should not run in production.
Prometheus and Grafana
Exporting Hibernate metrics via Micrometer to Prometheus, then visualizing in Grafana, gives you time-series dashboards for query count trends, cache hit rates, and session counts. This is the standard self-hosted approach and works well for teams already operating a Prometheus stack.
The limitation is that Prometheus and Grafana give you metrics but not traces. Knowing that query latency is rising does not tell you which specific code path triggered the slow query or which service call chain it belongs to.
This is where full infrastructure monitoring platforms become relevant. They connect database-level signals to application traces and service maps, giving you a complete picture rather than isolated metrics.
CubeAPM

CubeAPM provides APM with span-level database query visibility, which surfaces Hibernate query latency directly within distributed traces. When a slow Hibernate query occurs, CubeAPM shows you the exact SQL span, its duration, the parent service call, and the full request trace it belongs to, without requiring you to correlate log timestamps manually.
CubeAPM is OpenTelemetry-native, so instrumentation works through the standard OpenTelemetry Java agent. Once the agent is attached to your Spring Boot application, database spans including Hibernate-generated SQL are captured automatically and exported to CubeAPM without any Hibernate-specific configuration.
For Hibernate monitoring specifically, CubeAPM adds:
- Span-level query visibility: every Hibernate-generated SQL statement appears as a child span in the trace waterfall, with execution time and parameters
- DB query latency dashboards: aggregated views of query execution time by query type, endpoint, and service
- Slow query alerting: alerts on database span duration exceeding a threshold, routed to Slack, PagerDuty, or email
- Trace-to-log correlation: link slow Hibernate spans to application logs for the same request without switching tools
CubeAPM runs self-hosted inside your own cloud or on-prem environment, which means database query data and application traces never leave your infrastructure. For teams with data residency requirements or regulated workloads, this matters as much as the observability features themselves.
Pricing is usage-based at $0.20/GB of ingested data with no per-seat fees, which avoids the seat-tax problem common with tools like New Relic and Datadog. A team ingesting 5TB/month across traces, logs, and metrics pays $750/month regardless of how many engineers access the dashboards.
Pricing based on publicly available information as of June 2025. Verify current rates at the [CubeAPM pricing page](https://cubeapm.com/pricing/).
CubeAPM also covers the broader application performance monitoring picture beyond Hibernate, tracking service latency, error rates, and infrastructure metrics in the same platform, so teams do not need separate tools for database spans and service-level observability.
Conclusion
Hibernate monitoring is not a single switch. It is a layered approach: slow query logging catches individual statements that exceed your threshold, session statistics expose N+1 patterns and excessive lazy loading, and full APM tracing connects database queries to the service calls that triggered them. The most effective teams instrument all three layers, use N+1 detection in CI tests to prevent regressions, and expose session metrics via Micrometer for production trend tracking. Tools like CubeAPM close the gap between Hibernate’s log output and the distributed trace context needed to understand why a slow query is occurring in the first place.
Disclaimer: The information in this article reflects the latest details available at the time of publication and may change as technologies and products evolve. Features, pricing, and plan limits can change over time. Always verify the latest information directly with the vendor before making purchasing or deployment decisions.
Frequently Asked Questions
What is the best way to find slow Hibernate queries in production?
Use `hibernate.session.events.log.LOG_QUERIES_SLOWER_THAN_MS` set to a threshold in milliseconds. This logs only queries that exceed the threshold using Hibernate’s `StatisticalLoggingSessionEventListener`, adding negligible overhead compared to full SQL logging. Set the threshold based on your API’s SLA budget, typically 100–200ms is a practical starting point.
Does enabling hibernate.generate_statistics slow down my application?
Yes. The statistics collector adds overhead because it measures and aggregates every query, session open, and entity load. In high-throughput applications this can add 5–15% processing time per session. Use it during profiling sessions or in staging environments. For production, export metrics at low frequency via Micrometer instead of enabling per-session collection continuously.
How do I detect N+1 select problems automatically?
Write integration tests that enable Hibernate statistics, execute the use case under test, then assert on `sessionFactory.getStatistics().getPrepareStatementCount()`. If the count exceeds an expected maximum, the test fails. This catches N+1 regressions in CI before they reach production, which is more reliable than reviewing log output manually.
What is the difference between JOIN FETCH and batch fetching for N+1 fixes?
JOIN FETCH rewrites the query to eagerly load the association in a single SQL JOIN, returning all data in one round trip. Batch fetching keeps lazy loading but groups initialization requests into batches defined by `hibernate.default_batch_fetch_size`, reducing 100 queries to a handful. Use JOIN FETCH when you always need the association. Use batch fetching when you need lazy loading by default but want to limit the round-trip penalty when associations are accessed.
Can I monitor Hibernate metrics in Prometheus without writing custom code?
Yes. Add Spring Boot Actuator and the Micrometer Prometheus registry to your classpath, set `spring.jpa.properties.hibernate.generate_statistics=true`, and Micrometer automatically registers Hibernate metrics under the `hibernate.*` namespace. Prometheus can then scrape the `/actuator/prometheus` endpoint for query counts, session counts, and cache hit rates as time-series data.
What Hibernate metrics should I alert on in production?
Alert on `hibernate.query.seconds.max` exceeding your slow query threshold, `hibernate.sessions.open` growing unbounded over time which indicates connection leaks, and a second-level cache miss rate above 80% if you rely on caching for read performance. Pair these with connection pool saturation metrics from HikariCP for a complete picture of session health.
How does OpenTelemetry instrumentation relate to Hibernate monitoring?
The OpenTelemetry Java agent instruments JDBC at the driver level, capturing every database call as a span in your distributed traces. This includes all SQL generated by Hibernate. You get execution time, the SQL statement, and the full trace context showing which HTTP request and service chain triggered the query. This is complementary to Hibernate’s own logging and statistics — OTel adds the request context that Hibernate-level logs lack.