









A Metaspace OutOfMemoryError can crash your JVM without warning. The error surfaces in production, often triggered by excessive class loading from dynamic frameworks like Spring Boot or from applications that generate classes at runtime. Unlike heap memory errors that developers commonly encounter and recognize, non-heap failures catch teams off guard because monitoring tools often ignore native memory regions entirely.
This guide covers what Java non-heap memory is, how Metaspace and Code Cache differ from the deprecated PermGen, what causes non-heap memory leaks, and how to monitor these regions before they crash your application.
What Is Non-Heap Memory in Java?
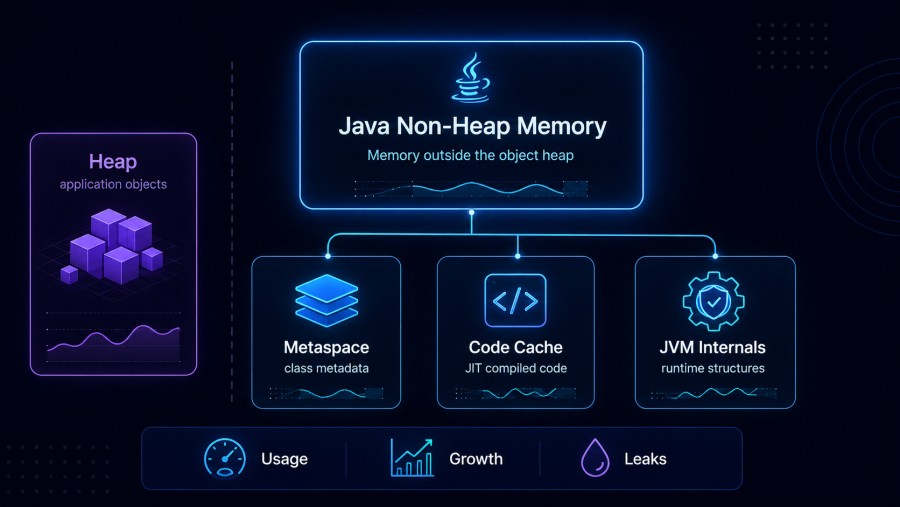
Non-heap memory is the portion of JVM memory allocated outside the Java heap, stored in native system memory rather than the garbage-collected heap space. The JVM uses non-heap memory to store class metadata, compiled native code, thread stacks, internal JVM structures, and memory-mapped files. Unlike heap memory, which stores application objects and is managed by the garbage collector, non-heap memory is managed by the JVM itself and grows dynamically based on application behavior.
Non-heap memory includes three primary regions: Metaspace (or PermGen in Java 7 and earlier), Code Cache, and Thread Stacks. Each serves a distinct purpose and has different growth patterns. Metaspace stores class metadata loaded by class loaders. Code Cache stores JIT-compiled native code generated by the Hotspot compiler. Thread Stacks store method call frames and local variables for each thread. A fourth category, Direct Memory, is used by NIO buffers and memory-mapped files when applications explicitly allocate off-heap memory.
The key distinction between heap and non-heap memory is garbage collection. Heap memory is continuously managed by the garbage collector, which reclaims unused objects automatically. Non-heap memory does not participate in standard garbage collection. Metaspace metadata is only freed when class loaders are unloaded. Code Cache is managed by the JIT compiler. Thread Stacks are released only when threads terminate. This means non-heap memory leaks are harder to detect and resolve because they accumulate silently without triggering the same garbage collection pressure signals that heap leaks create.
How Non-Heap Memory Works in the JVM
The JVM allocates non-heap memory from the operating system’s native memory rather than from the Java heap. This allocation happens dynamically as the application runs. When a class is loaded, the JVM allocates Metaspace to store the class structure, field definitions, method bytecode, and constant pool. When the JIT compiler optimizes a hot method, it allocates Code Cache to store the compiled machine code. When a new thread starts, the JVM allocates a thread stack from native memory.
Each non-heap region has different growth characteristics and different limits. Metaspace grows unbounded by default in Java 8 and later, limited only by available native memory. You can cap it with -XX:MaxMetaspaceSize. Code Cache is capped by default at 48 MB for client VMs and 240 MB for server VMs in Java 8, configurable with -XX:ReservedCodeCacheSize. Thread Stacks are sized per thread, typically 1 MB per thread by default, configurable with -Xss.
The most common non-heap memory issue is a Metaspace leak caused by class loader leaks. Application servers like Tomcat and frameworks like Spring Boot frequently create and destroy class loaders during hot redeployments or when loading plugin architectures. If a class loader is not properly garbage collected after undeployment, all classes it loaded remain in Metaspace permanently. Each redeployment loads a new copy of every class, doubling Metaspace usage. Over time, this exhausts native memory and triggers java.lang.OutOfMemoryError: Metaspace.
Code Cache exhaustion happens when the JIT compiler generates more compiled code than the cache can hold. This is less common than Metaspace leaks but occurs in applications with extremely large codebases or applications that dynamically generate many methods. When Code Cache fills, the JIT compiler stops compiling, and the application falls back to interpreted bytecode execution, causing severe performance degradation. You can monitor Code Cache usage with JMX or command-line tools like jstat.
Thread Stacks contribute to non-heap memory usage proportionally to thread count. An application with 500 threads and the default 1 MB stack size uses 500 MB of non-heap memory just for stacks. This becomes significant in containerized environments where total memory is limited. Reducing stack size with -Xss512k or limiting thread pools can reduce non-heap overhead.
Direct Memory is used by NIO buffers allocated with ByteBuffer.allocateDirect(). This memory is not part of Metaspace or Code Cache but is still counted as non-heap. Applications that process large files or network streams using NIO can exhaust Direct Memory if buffers are not released. Direct Memory is limited by -XX:MaxDirectMemorySize, which defaults to the heap size.
Metaspace vs PermGen: What Changed in Java 8
PermGen (Permanent Generation) was the storage region for class metadata in Java 7 and earlier. It was part of the heap and had a fixed size set by -XX:MaxPermSize, typically 64 MB to 256 MB. PermGen was garbage collected, but only when the entire class loader was eligible for collection. In practice, PermGen frequently filled up during application redeployments, causing OutOfMemoryError: PermGen space errors that became one of the most common production issues in Java 7 applications.
Java 8 removed PermGen and replaced it with Metaspace. The primary difference is location and sizing. Metaspace is stored in native memory outside the heap, not inside it. Metaspace grows dynamically without a hard limit by default, so it can use as much native memory as the operating system provides. This eliminated the fixed-size bottleneck that caused most PermGen errors.
However, replacing PermGen with Metaspace did not eliminate class loader leaks. It only changed how they manifest. Instead of hitting a 256 MB PermGen limit and crashing immediately, applications now silently consume native memory until the entire system runs out of RAM. This can exhaust container memory limits in Kubernetes or Docker, trigger OOM-killer, or crash the host OS if swap is disabled. The failure mode is worse because it is less visible.
Metaspace is divided into two parts: class metadata space and compressed class space. Class metadata space stores class structures, methods, and constant pools. Compressed class space stores compressed class pointers when compressed OOPs (Ordinary Object Pointers) are enabled. Compressed class space is capped at 1 GB by default and configured with -XX:CompressedClassSpaceSize. Class metadata space is unbounded unless you set -XX:MaxMetaspaceSize.
The advantage of Metaspace over PermGen is flexibility. Applications with large class counts no longer hit arbitrary fixed limits. The disadvantage is that unbounded growth makes leaks harder to detect. In PermGen, you knew immediately when you hit the limit. With Metaspace, the application may run for days or weeks before native memory exhaustion crashes the JVM or container.
To prevent unbounded Metaspace growth, always set -XX:MaxMetaspaceSize in production. A reasonable starting value is 256 MB to 512 MB for typical applications. Applications with many classes or heavy use of reflection, proxies, or bytecode generation may need 1 GB or more. Monitor Metaspace usage in production and set the limit slightly above normal peak usage to catch leaks early.
What Is Code Cache and Why It Matters?
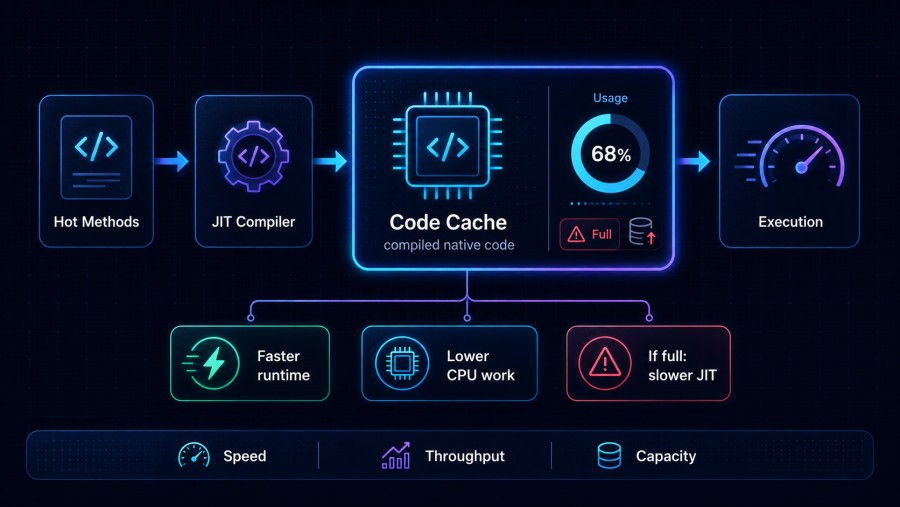
Code Cache is the JVM memory region where the JIT (Just-In-Time) compiler stores compiled native machine code. When the JVM detects that a method is executed frequently (a “hot” method), the JIT compiler translates the Java bytecode into optimized native code and stores it in Code Cache. Subsequent calls to that method execute the compiled version directly, bypassing the interpreter and improving performance by 10x to 100x for hot paths.
Code Cache is divided into three segments in Java 9 and later: non-method code (JVM internal code), profiled code (lightly optimized methods still being profiled), and non-profiled code (fully optimized methods). This segmentation allows the JIT compiler to manage cache eviction more intelligently by prioritizing space for fully optimized code.
The default Code Cache size is 240 MB for server-class JVMs in Java 8 and later. This is sufficient for most applications. However, applications with extremely large codebases, applications that use code generation frameworks heavily (like Spring with CGLIB proxies), or applications with many small methods can fill the Code Cache. When Code Cache is full, the JIT compiler stops compiling new methods, and a warning appears in the logs: CodeCache is full. Compiler has been disabled.
Once the compiler is disabled, all subsequent method calls execute in interpreted mode, which is 10x to 100x slower than compiled code. This causes severe performance degradation. The application does not crash, but response times increase dramatically. The only way to recover is to restart the JVM or increase Code Cache size.
You can monitor Code Cache usage with the jstat -compiler command or by querying JMX beans. The key metric is CodeCacheUsed / CodeCacheMax. If this ratio exceeds 90%, the JIT compiler starts evicting less-used compiled methods to make space for new ones. If it reaches 100%, the compiler disables entirely.
To increase Code Cache size, use -XX:ReservedCodeCacheSize=512m or higher. Increasing Code Cache also increases non-heap memory usage, so factor this into container memory limits. A reasonable guideline is to allocate 5% to 10% of total container memory to Code Cache for large applications.
Code Cache exhaustion is less common than Metaspace leaks but more catastrophic when it happens because performance collapses instantly. If you see “CodeCache is full” in logs, increase the cache size immediately and restart the JVM. Do not wait for performance to recover on its own; it will not.
Monitoring Non-Heap Memory with JVM Tools
The JVM provides several built-in tools for monitoring non-heap memory. The most commonly used are jstat, jcmd, JVisualVM, and JMX. Each has different use cases and visibility into non-heap regions.
jstat is a command-line tool that displays JVM statistics in real time. To monitor Metaspace, use jstat -gc <pid> 1000 to print garbage collection statistics every second. The output includes columns for Metaspace capacity (MC), Metaspace used (MU), compressed class space capacity (CCSC), and compressed class space used (CCSU). If Metaspace used consistently increases without ever decreasing, you likely have a class loader leak.
To monitor Code Cache, use jstat -compiler <pid>. This shows the number of compiled methods, failed compilations, and whether the compiler is active. If the compiler stops (indicated by a message in the JVM logs), Code Cache is full.
jcmd is another command-line tool that provides detailed JVM diagnostics. jcmd <pid> VM.native_memory summary prints a detailed breakdown of native memory usage including Metaspace, Code Cache, Thread Stacks, and internal JVM structures. This command requires that you start the JVM with -XX:NativeMemoryTracking=summary or -XX:NativeMemoryTracking=detail. Native Memory Tracking (NMT) adds about 5% to 10% overhead, so enable it only in non-production environments or during troubleshooting.
JVisualVM is a GUI tool included with the JDK that provides real-time monitoring of heap, non-heap, threads, and classes. The “Monitor” tab shows non-heap memory usage as a line graph. The “Sampler” or “Profiler” tab shows loaded classes, which correlates directly with Metaspace usage. If the class count increases continuously, Metaspace is likely leaking.
JMX (Java Management Extensions) exposes JVM metrics as MBeans that can be queried programmatically or through monitoring tools. The java.lang:type=MemoryPool,name=Metaspace MBean reports Metaspace usage, committed memory, and maximum size. The java.lang:type=MemoryPool,name=Code Cache MBean reports Code Cache usage. Most APM tools query these MBeans to surface non-heap metrics in dashboards.
For production monitoring, relying on command-line tools is not sustainable. You need continuous visibility into non-heap memory trends over time. This is where APM tools and infrastructure monitoring platforms come in. Tools like CubeAPM, Datadog, and New Relic automatically collect JMX metrics and alert when Metaspace or Code Cache usage crosses thresholds.
Common Causes of Non-Heap Memory Leaks
Non-heap memory leaks are almost always caused by class loader leaks. A class loader leak happens when a class loader is not garbage collected after it is no longer needed, which prevents all classes it loaded from being unloaded from Metaspace. Every class holds a reference to its class loader, and every class loader holds references to all classes it loaded. This creates a circular reference structure that is only broken when the class loader itself becomes unreachable and is garbage collected.
Application servers like Tomcat, JBoss, and WebLogic create a new class loader for each deployed web application. When you undeploy or redeploy an application, the old class loader should be garbage collected. However, if any live thread, static field, or JVM internal structure still holds a reference to any object loaded by that class loader, the entire class loader remains reachable, and none of its classes are unloaded. Each redeployment loads a new copy of every class into a new Metaspace region, doubling memory usage.
The most common causes of class loader leaks are:
- Thread locals that are not cleared. If a thread from a shared thread pool (like Tomcat’s HTTP thread pool) sets a thread-local variable pointing to an object loaded by the application class loader, that reference persists after the application is undeployed. This prevents the class loader from being collected.
- Static fields holding references to application objects. If a library class loaded by the parent class loader holds a static reference to an object loaded by the application class loader, the application class loader cannot be collected.
- JDBC drivers that are not deregistered. JDBC drivers register themselves with the
DriverManagerwhen loaded. If you do not explicitly callDriverManager.deregisterDriver()before undeploying, the driver reference persists. - ThreadPoolExecutors that are not shut down. If your application creates an
ExecutorServiceand does not callshutdown()before undeployment, the executor’s threads keep the application class loader alive. - Custom caches that hold class references. If your application maintains a cache of
Classobjects or reflection metadata, those references prevent class unloading.
To detect class loader leaks, use a heap dump tool like Eclipse Memory Analyzer (MAT) or JProfiler. Take a heap dump after several redeployments. Search for multiple instances of the same class with different class loaders. If you see MyClass [Loaded by WebappClassLoader @0x123] and MyClass [Loaded by WebappClassLoader @0x456], you have a class loader leak.
Fixing class loader leaks requires code changes. Clean up thread locals in ServletContextListener.contextDestroyed(). Avoid static references to application objects. Deregister JDBC drivers explicitly. Shut down all thread pools before undeployment. Modern frameworks like Spring Boot reduce this problem by embedding the application server (Tomcat or Jetty) inside the application, so redeployment restarts the entire JVM rather than just the class loader.
Tools for Monitoring Java Non-Heap Memory
Monitoring non-heap memory requires tools that collect JVM metrics continuously and surface trends over time. Command-line tools like jstat and jcmd are useful for spot checks but impractical for production monitoring. You need a platform that queries JMX or integrates with JVM agents to stream metrics into dashboards and trigger alerts.

CubeAPM provides native JVM monitoring with runtime metrics including Metaspace usage, Code Cache usage, thread count, and garbage collection activity. CubeAPM runs inside your own cloud or on-prem infrastructure, so JVM telemetry never leaves your network. It integrates with OpenTelemetry Java agents to correlate non-heap memory metrics with APM traces and logs. When a Metaspace spike correlates with a specific API endpoint or deployment event, CubeAPM surfaces that connection automatically. Pricing is $0.20/GB for all telemetry data ingested with no per-host or per-user fees, and all metrics are retained indefinitely at no extra cost. CubeAPM is compatible with Prometheus, Datadog agents, and New Relic agents, so you can migrate incrementally without replacing your entire stack at once.
Datadog APM includes JVM runtime metrics as part of its APM product. The Datadog Java agent automatically collects Metaspace, Code Cache, heap, and GC metrics and surfaces them in the APM dashboard. Datadog charges $31/host/month for APM on infrastructure monitoring hosts, or $42/host/month for APM-only hosts. For a 50-host cluster, that is $1,550/month before logs, custom metrics, or real user monitoring. Datadog supports alerting on JVM metrics and correlating them with traces, but all telemetry is sent to Datadog’s SaaS infrastructure, which may not meet data residency requirements.
New Relic offers JVM monitoring through its Java agent. Metaspace and Code Cache metrics appear in the JVM metrics dashboard. New Relic charges per user or per compute capacity unit (CCU), both of which can scale unpredictably. The per-user model charges $49 to $99 per full-platform user per month. The CCU model charges for compute units based on telemetry processing volume, which correlates roughly with data ingested. Teams report CCU costs of $0.35/GB to $0.50/GB depending on query frequency and retention. New Relic also charges for data egress if you export telemetry to external systems.
Dynatrace provides AI-assisted JVM monitoring with automatic anomaly detection. Dynatrace detects Metaspace leaks and Code Cache exhaustion automatically and alerts when metrics deviate from baseline. Dynatrace pricing is host-based, starting around $0.08/hour per monitored host ($58/host/month) for full-stack monitoring. For 50 hosts, that is $2,900/month. Dynatrace offers both SaaS and managed deployment options, but the managed option still requires Dynatrace to host the backend infrastructure.
Prometheus and Grafana are open source and widely used for JVM monitoring. The Prometheus JMX Exporter scrapes JMX metrics from the JVM and exposes them in Prometheus format. You can then query these metrics in Grafana dashboards and create alerts in Prometheus Alertmanager. The Prometheus stack is free, but you manage the infrastructure yourself. Retention is limited by disk space, and high-cardinality queries can be slow. For teams that already run Prometheus for Kubernetes or infrastructure monitoring, adding JVM metrics is straightforward. For teams starting from zero, the operational overhead is significant.
Elastic APM integrates with the Elastic Stack (Elasticsearch, Logstash, Kibana) and includes JVM runtime metrics in the APM agent. Metrics are stored in Elasticsearch alongside APM traces and logs. Elastic APM is free if you self-host Elasticsearch. Elastic Cloud (hosted Elasticsearch) charges based on cluster size, starting around $95/month for a minimal cluster and scaling to thousands of dollars per month for production workloads. Elastic’s query performance degrades with high-cardinality data unless you carefully manage index mappings and retention policies.
For teams that need synthetic monitoring in addition to JVM metrics, most of these platforms offer synthetic checks as an add-on. CubeAPM includes synthetic monitoring with no additional per-check fees. Datadog charges $5 per 10,000 synthetic test runs. New Relic includes 500 checks per month in the platform tier, then charges per additional check.
Best Practices for Preventing Non-Heap Memory Issues
Preventing non-heap memory problems requires setting limits, monitoring trends, and fixing leaks before they reach production. The most important configuration change is setting -XX:MaxMetaspaceSize. Without this flag, Metaspace can consume all available native memory, crashing the container or host. Start with 256 MB for typical applications and increase based on monitoring. If Metaspace usage stabilizes below 200 MB under load, 256 MB is sufficient. If it grows to 400 MB, increase the limit to 512 MB. Setting the limit too low causes premature OutOfMemoryError. Setting it too high allows leaks to grow undetected.
- Enable Native Memory Tracking in non-production environments with
-XX:NativeMemoryTracking=summary. This adds overhead, so do not use it in production, but it is invaluable during load testing and troubleshooting. Runjcmd <pid> VM.native_memory summarybefore and after test runs to identify which native memory regions are growing. - Monitor Metaspace usage continuously in production. Set an alert threshold at 80% of max Metaspace size. If usage crosses 80%, investigate immediately. Check loaded class count with
jcmd <pid> GC.class_histogramor via JMX. If the class count is stable, Metaspace usage should be stable. If the class count increases over time, you have a class loader leak. - For Code Cache, monitor usage and set an alert at 90% of reserved size. If Code Cache usage exceeds 90%, increase the size before it fills completely. Unlike Metaspace, Code Cache filling does not crash the JVM, but it does destroy performance. Preventing the problem is far easier than recovering from it.
- Avoid creating threads excessively. Each thread consumes 1 MB of stack space by default. An application with 1,000 threads uses 1 GB of non-heap memory just for stacks. Use bounded thread pools with reasonable limits. For containerized applications, calculate total memory as heap + Metaspace + Code Cache + (thread count × stack size) and set container memory limits accordingly.
- Fix thread-local leaks by clearing thread locals in
finallyblocks or usingThreadLocal.remove(). If you use a shared thread pool (like Tomcat’s), never assume that threads are destroyed after request completion. Always clean up thread locals explicitly. - Test application redeployments in a staging environment with multiple redeploy cycles. Monitor Metaspace usage after each cycle. If usage doubles after each redeployment, you have a class loader leak. Fix it before deploying to production.
- Regularly review GC logs and JVM metrics for anomalies. A sudden increase in Metaspace or Code Cache usage after a deployment often indicates a new leak introduced by recent code changes. Correlate metric changes with deployment events using APM tools that track deployments and link them to telemetry data.
Frequently Asked Questions
What is the difference between Metaspace and PermGen?
Metaspace replaced PermGen in Java 8. PermGen was a fixed-size region inside the heap used to store class metadata, while Metaspace is stored in native memory outside the heap and grows dynamically. Metaspace can consume more memory than PermGen ever could, so setting `-XX:MaxMetaspaceSize` is critical to prevent unbounded growth.
Why does Metaspace keep growing even after garbage collection?
Metaspace only shrinks when class loaders are unloaded, which happens when a class loader and all classes it loaded become unreachable. If your application creates class loaders that are never garbage collected, Metaspace grows indefinitely. This is called a class loader leak and is the most common cause of Metaspace exhaustion.
How do I know if my JVM has a Code Cache problem?
Monitor Code Cache usage with `jstat -compiler` or via JMX. If Code Cache used exceeds 90% of reserved size, the JIT compiler may start evicting compiled methods. If it reaches 100%, the compiler disables entirely, and you will see “CodeCache is full” in the logs. Performance will degrade severely until you restart the JVM with a larger Code Cache size.
Can I reduce non-heap memory usage without changing my application?
You can reduce thread stack size with `-Xss512k` or `-Xss256k` to lower memory usage per thread. You can also limit Metaspace with `-XX:MaxMetaspaceSize` to prevent excessive growth. However, these are containment measures. Fixing the root cause requires identifying and removing class loader leaks or reducing thread counts.
What tools show non-heap memory usage in real time?
JVisualVM, JConsole, and most APM tools display non-heap memory usage. Command-line tools like `jstat` and `jcmd` also provide real-time snapshots. For continuous production monitoring, use an APM platform like CubeAPM, Datadog, or New Relic that collects JVM metrics automatically and alerts on threshold violations.
Is it safe to set MaxMetaspaceSize to unlimited?
No. Without a limit, Metaspace can consume all available native memory, causing the JVM or container to crash with an OutOfMemoryError or triggering the OOM-killer in containerized environments. Always set a reasonable limit based on your application’s class loading behavior and monitor usage in production.
Why do I see multiple copies of the same class in a heap dump?
This indicates a class loader leak. Each redeployment creates a new class loader that loads fresh copies of all application classes. If old class loaders are not garbage collected, each copy of the class persists in Metaspace, multiplying memory usage with every redeployment.
Disclaimer: The information in this article reflects the latest details available at the time of publication and may change as technologies and products evolve. Features, pricing, and plan limits can change over time. Always verify the latest information directly with the vendor before making purchasing or deployment decisions.