










Supabase sits at the edge of your infrastructure where every query, auth request, and storage operation flows through its Postgres core. Without visibility into query latency, connection pool saturation, or API throttling, performance degradation can quietly compound for hours before user reports surface.
Most teams realize too late that Supabase Studio’s built-in metrics are too coarse to diagnose real problems. Connection spikes, slow queries, and replication lag need query-level visibility, not just aggregate dashboard tiles. This guide compares 8 tools that actually monitor Supabase, evaluated on cost model, signal depth, deployment flexibility, and what they miss.
Quick Comparison: 8 Supabase Monitoring Tools
| Tool | Best For | Pricing | Free Plan | Deployment |
|---|---|---|---|---|
| CubeAPM | Full stack teams needing unified APM, logs, and Postgres visibility | $0.20/GB ingested | Free Trial | Self-hosted, managed |
| Datadog | Enterprises with multi-cloud stacks needing broad integration coverage | Starts $15/host/month + $31/host for APM | 14-day trial | SaaS only |
| Sentry | Error tracking with session replay for frontend-heavy Supabase apps | Free tier, Pro from $26/month | Yes | SaaS only |
| Grafana Cloud | Teams already using Prometheus or Loki for Postgres metric visualization | Free tier, Pro from $49/month | Yes | SaaS + self-hosted |
| Better Stack | Developer-friendly incident management with fast log search | Free tier, Pro from $29/month | Yes | SaaS only |
| New Relic | Managed observability platform for teams prioritizing ease of use over cost | Free tier, Standard $49/user/month | Yes | SaaS only |
| Supadex | Mobile dashboard for Supabase project monitoring on iOS | Free, Pro $3.99/month | Yes | Mobile app |
| Prometheus + Grafana | Open source teams wanting full control over Postgres metrics | Free | Yes | Self hosted |
1. CubeAPM
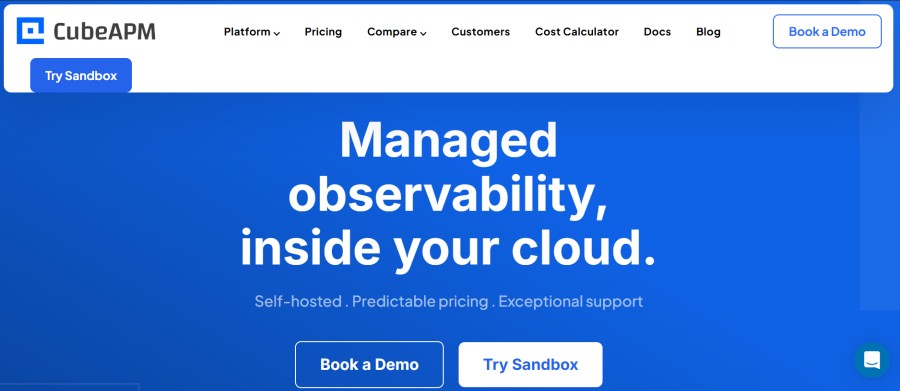
CubeAPM is a self-hosted observability platform that runs inside your VPC or on-premises, giving full visibility into Supabase Postgres performance without sending telemetry data outside your cloud.
Key Features:
- Native OpenTelemetry support for Postgres metric collection via standard exporters
- Query-level visibility with latency breakdown, connection pool stats, and slow query identification
- Unified view of database metrics, application traces, and logs in one platform
- Real-time alerting on query performance degradation, connection saturation, and replication lag
- Unlimited retention with predictable $0.20/GB pricing; no separate indexing fees
Pricing: $0.20/GB ingested, billed quarterly. Infrastructure cost (compute + storage) is included. No per-seat fees.
Pros:
- Data stays inside your infrastructure; meets data residency and compliance requirements
- Correlates Supabase database metrics with APM traces to pinpoint whether slowdowns originate in queries or application code
- Ingestion-based pricing means no surprise overages from metric cardinality or user growth
Cons:
- Requires self-hosted or BYOC deployment; your team manages the underlying infrastructure
- No autonomous anomaly detection; alerts are rule-based, not AIOps-driven
Best for: DevOps teams with data sovereignty requirements who need full stack visibility into Supabase database performance alongside application telemetry.
2. Datadog
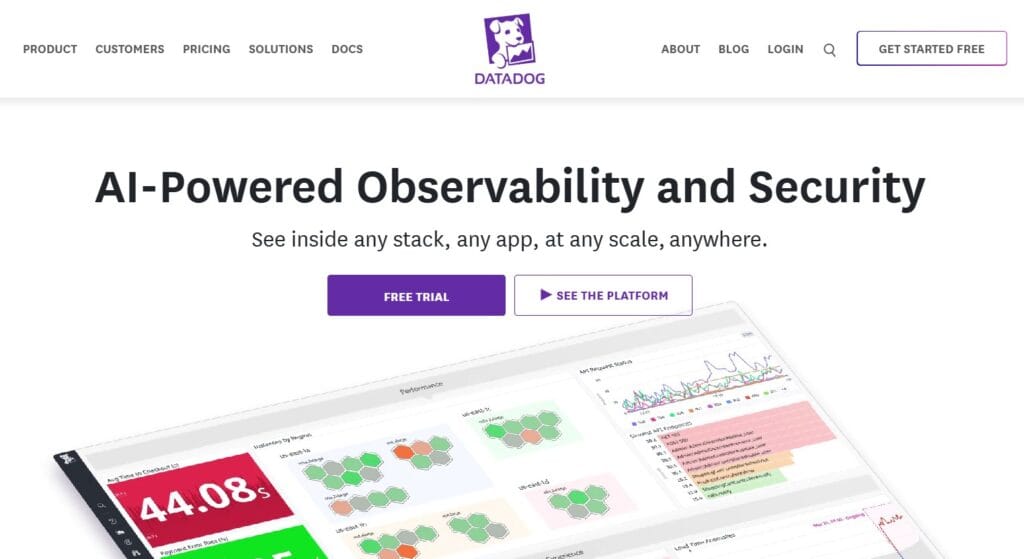
Datadog offers a managed observability platform with a community-maintained Supabase integration that scrapes metrics from Supabase’s Prometheus-compatible API.
Key Features:
- Scrapes ~200 Postgres performance series via Supabase Metrics API
- Pre-built dashboards for database CPU, IO, WAL, connection, and query stats
- Correlates database metrics with logs, traces, and infrastructure monitoring in one platform
- Real-time alerting with anomaly detection and integration with PagerDuty, Slack, and email
Pricing: Starts at $15/host/month for infrastructure monitoring. APM adds $31/host/month. Database Monitoring is included with APM. Verify current rates on Datadog’s pricing page.
Pros:
- Broad integration ecosystem; connects Supabase metrics with 700+ other services and tools
- Managed SaaS means no infrastructure to maintain
Cons:
- Per-host pricing compounds fast as infrastructure scales; a 50-node cluster costs $750/month for infrastructure monitoring alone before APM or logs
- Reddit users report bills jumping unpredictably when metric cardinality or trace volume increases
- Cloud-only deployment means telemetry data leaves your infrastructure
Best for: Enterprises with multi-cloud stacks who need Supabase monitoring integrated into a broader managed observability platform and can absorb Datadog’s cost structure.
3. Sentry
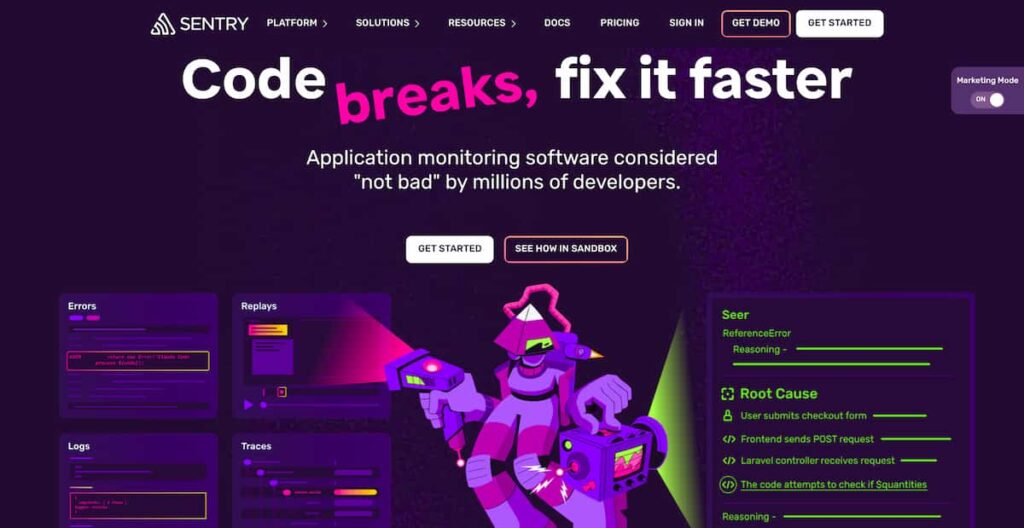
Sentry focuses on error tracking and session replay, making it useful for monitoring frontend errors and API failures in Supabase-powered applications.
Key Features:
- Captures JavaScript errors, API failures, and unhandled exceptions in real time
- Session replay shows exactly what users experienced before an error occurred
- Performance monitoring for API endpoints and database query latency
- Real-time alerting with context-rich error reports and stack traces
Pricing: Free tier includes 5,000 errors/month. Pro starts at $26/month for 50,000 errors. Verify pricing on Sentry’s plans page.
Pros:
- Fast setup. JavaScript SDK integrates with Supabase client libraries in minutes
- Strong frontend error tracking with session replay for debugging user issues
- Free tier works well for small projects
Cons:
- Limited database-level visibility. Tracks API errors but not Postgres query performance
- Pricing scales with error volume, which can spike during incidents
Best for: Frontend-heavy Supabase apps where tracking JavaScript errors and user session behavior is the priority.
4. Grafana Cloud
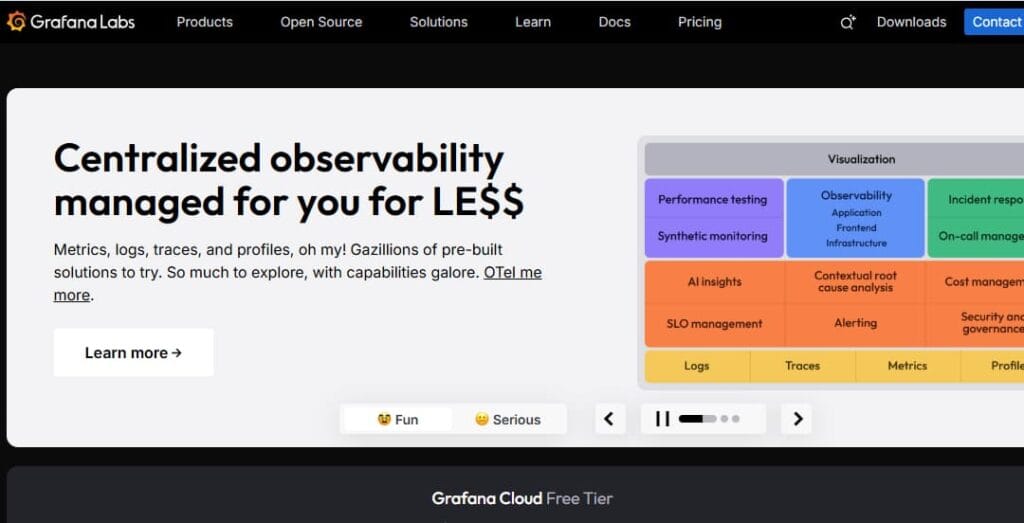
Grafana Cloud provides managed Prometheus and Grafana for teams that want visual dashboards without self-hosting, including a community-maintained Supabase integration.
Key Features:
- Scrapes metrics from Supabase’s Prometheus API endpoint using managed Prometheus
- Pre-built Supabase dashboard with 200+ charts for database CPU, memory, connections, and query stats
- Unified view of metrics, logs, and traces via Grafana Loki and Tempo
- Real-time alerting with customizable thresholds and notification channels
Pricing: Free tier includes 10,000 series and 50 GB logs. Pro starts at $49/month. Verify current pricing on Grafana Cloud’s plans page.
Pros:
- Open source foundation means no vendor lock-in; dashboards and alerts are portable
- Managed Prometheus eliminates self-hosting burden
- Strong integration with existing Prometheus and Loki setups
Cons:
- Limited database-specific diagnostics compared to specialized APM tools
- Requires manual configuration of scrape jobs and dashboard imports
- Query-level visibility depends on enabling pg_stat_statements and exporting via custom exporters
Best for: Teams already using Prometheus or Loki who want managed Grafana dashboards for Supabase metrics without self-hosting the full stack.
5. Better Stack
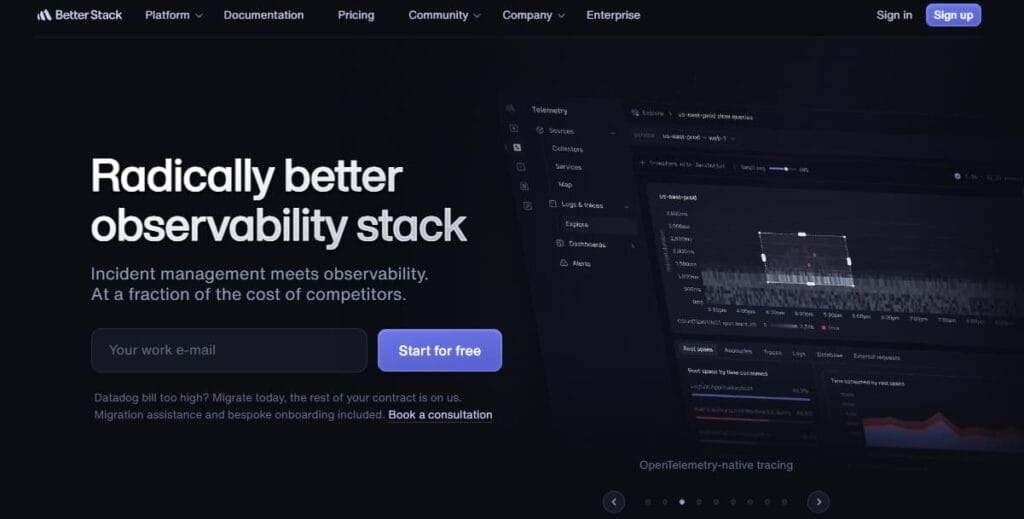
Better Stack combines log management, uptime monitoring, and incident management with a developer-friendly UI optimized for fast troubleshooting.
Key Features:
- Ingests Supabase logs via log drain integration for centralized log search
- Uptime monitoring with API endpoint checks and real-time alerting
- Fast full-text log search with filtering by service, log level, or custom fields
- Incident management with on-call scheduling, escalation policies, and post-mortems
Pricing: Free tier includes 1 GB of logs/month. Pro starts at $29/month for 10 GB logs and 10 monitors. Verify pricing on Better Stack’s plans page.
Pros:
- Fast setup; log drain connects to Supabase in under 5 minutes
- Developer-friendly UI with instant log search and filtering
- Strong uptime monitoring for Supabase API endpoints
Cons:
- No database-level query visibility; tracks logs and API uptime but not Postgres performance
- SaaS only deployment means logs leave your infrastructure
Best for: Startups and lean teams needing fast log search and uptime monitoring for Supabase without the complexity of a full APM platform.
6. New Relic

New Relic offers a managed observability platform with broad coverage, including database monitoring that can connect to Supabase Postgres via standard Postgres integrations.
Key Features:
- Database monitoring with query-level visibility, explain plans, and performance recommendations
- Correlates database metrics with APM traces to link slow queries to application endpoints
- Real-time alerting with anomaly detection and integration with Slack, PagerDuty, and email
- Unified platform for logs, metrics, traces, and infrastructure monitoring
Pricing: Free tier includes 100 GB data ingest/month. Standard plan charges per user ($49–$99/user/month) or via Compute Capacity Units. Verify pricing on New Relic’s plans page.
Pros:
- Managed SaaS with no infrastructure to maintain
- Strong query-level visibility with explain plans and optimization recommendations
Cons:
- Per-user pricing compounds fast; a 20-person team pays $980–$1,980/month in seat costs before data ingest fees
- Proprietary NRQL query language creates lock-in; dashboards and alerts are not portable
- Cloud-only deployment means database telemetry leaves your infrastructure
Best for: Teams prioritizing ease of use and managed observability over cost control, who can absorb New Relic’s per-user or CCU pricing model.
7. Supadex
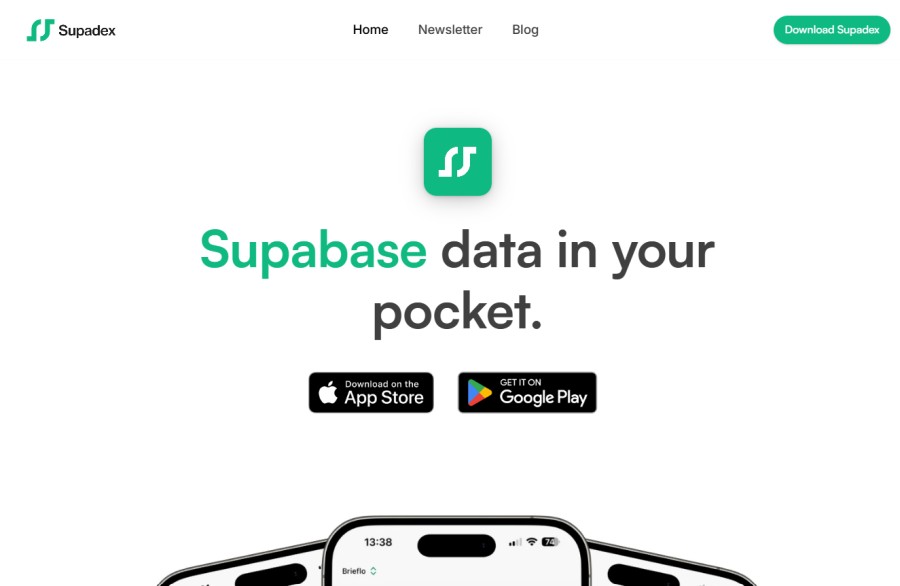
Supadex is a mobile dashboard app for iOS that connects directly to Supabase’s Management API, giving on-the-go visibility into projects, databases, and storage.
Key Features:
- Real-time analytics for REST and Auth requests, storage stats, and active users
- Database table browser with built-in SQL editor for running queries from mobile
- Storage bucket management with file browsing and public URL copying
- Multi-project support with dark/light theme and real-time updates
Pricing: Free version available. Pro subscription: $3.99/month or $39.99/year. Lifetime plan: $79.99. Verify pricing on the App Store.
Pros:
- Fast mobile access to Supabase project metrics and database tables
- No infrastructure to deploy; connects directly via Supabase API
- Local token storage with no third-party data collection
Cons:
- Mobile only — no desktop or web interface
- Limited query level visibility — shows table data but not Postgres performance metrics
- Does not support self hosted Supabase instances
Best for: Developers who need quick mobile access to Supabase project metrics and database tables on the go.
8. Prometheus + Grafana
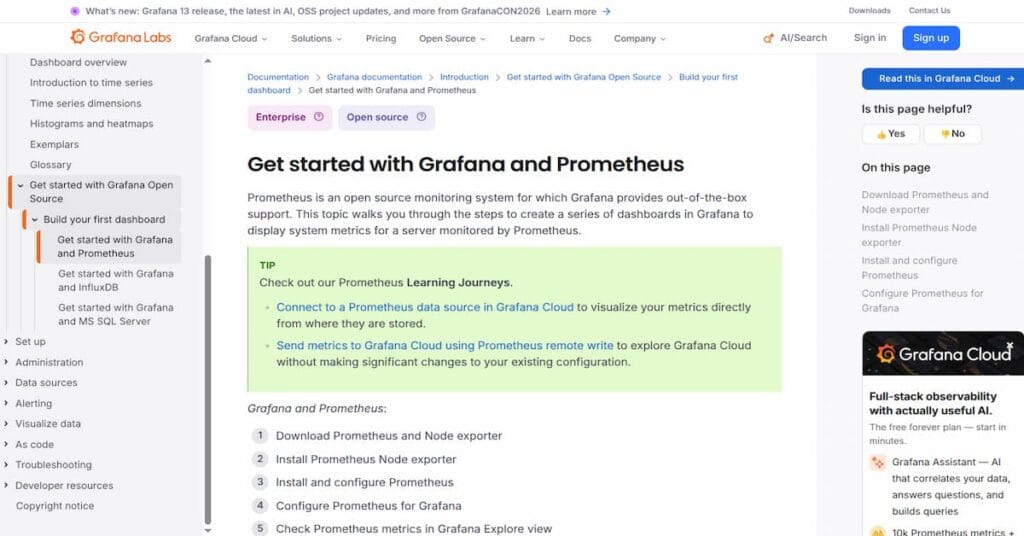
The open-source combination of Prometheus (for metric collection) and Grafana (for visualization) gives full control over Supabase monitoring without SaaS costs.
Key Features:
- Scrapes Supabase’s Prometheus-compatible Metrics API for ~200 database performance series
- Pre-built Supabase Grafana dashboard with 200+ charts for CPU, memory, connections, and query stats
- Full control over retention, alerting, and data residency
- Open-source foundation means no vendor lock-in
Pricing: Free and open source. Infrastructure costs depend on your deployment (cloud VM, Kubernetes, or on-premises).
Pros:
- No SaaS fees; total cost is infrastructure and operational overhead
- Full data control; telemetry never leaves your environment
- Community-maintained dashboards and alert packs available
Cons:
- Requires self-hosting and Day 2 operations; upgrades, scaling, and backup are your responsibility
- Limited query-level diagnostics without additional exporters like pg_stat_statements
- Steep learning curve for teams new to PromQL and Grafana query syntax
Best for: Open source teams with ops capacity who want full control over Supabase metrics and data residency without SaaS costs.
How to Choose the Right Supabase Monitoring Tool
Choosing a monitoring tool for Supabase depends on three factors: deployment preference (SaaS vs. self-hosted), visibility depth (logs and uptime vs. query-level Postgres diagnostics), and cost model (flat ingestion vs. per host vs. per user).
Start with deployment preference. If data residency or compliance requires keeping telemetry inside your infrastructure, CubeAPM or Prometheus + Grafana are your only options. If a managed SaaS platform is acceptable, Datadog, New Relic, Grafana Cloud, Better Stack, and Sentry are viable.
Match visibility depth to your needs. If you need query-level Postgres diagnostics (slow query identification, connection pool stats, explain plans), CubeAPM, Datadog, New Relic, and Grafana Cloud (with custom exporters) provide this. If API uptime and log search are sufficient, Better Stack or Sentry work well. If mobile access to project metrics is the priority, Supadex fits.
Evaluate cost structure. CubeAPM charges $0.15/GB ingested with unlimited retention and no per-seat fees. Datadog starts at $15/host/month plus $31/host for APM, and bills compound with metric cardinality. New Relic charges per user ($49–$99/user/month) or via Compute Capacity Units, which can be opaque. Grafana Cloud, Better Stack, and Sentry offer free tiers and usage based pricing. Prometheus + Grafana are free but require ops overhead.
This estimate models a production-ready setup with high availability. A smaller or simpler deployment may cost significantly less.
Decision framework:
- Self-hosted + full stack visibility + ingestion-based pricing → CubeAPM
- Managed SaaS + broad integrations + budget for per-host pricing → Datadog
- Open source + full control + ops capacity → Prometheus + Grafana
- Frontend errors + session replay + fast setup → Sentry
- Managed Grafana + existing Prometheus setup → Grafana Cloud
- Fast log search + uptime monitoring + lean team → Better Stack
- Mobile dashboard for on-the-go access → Supadex
- Managed platform + per-user pricing acceptable → New Relic
Supabase monitoring is not one size fits all. The right tool depends on whether you prioritize data control, query-level visibility, cost predictability, or ease of deployment. Most production teams need more than Supabase Studio provides. The question is which additional layer fits your stack and constraints.
Disclaimer: The information in this article reflects the latest details available at the time of publication and may change as technologies and products evolve. Features, pricing, and plan limits can change over time. Always verify the latest information directly with the vendor before making purchasing or deployment decisions. This review is based on Munsit’s independent research and analysis and does not constitute an official audit or endorsement. This article is intended for informational purposes only and is not meant to disparage any individual, company, or product. We encourage readers to verify current details directly with the relevant providers before making any decisions.
Frequently Asked Questions
What is the best tool for monitoring Supabase in production?
CubeAPM, Datadog, and Grafana Cloud are the strongest options for production Supabase monitoring. CubeAPM gives full-stack visibility with self-hosted deployment and flat pricing. Datadog provides managed monitoring with broad integrations but at a higher cost. Grafana Cloud works well for teams already using Prometheus.
Does Supabase have built-in monitoring?
Yes, Supabase Studio provides basic database metrics like active connections, query count, and storage usage. For query-level visibility, slow query identification, and real-time alerting, you need an external monitoring tool like CubeAPM, Datadog, or Grafana.
Can I monitor Supabase with Prometheus and Grafana?
Yes, Supabase exposes a Prometheus-compatible metrics API that surfaces ~200 Postgres performance series. You can scrape this endpoint with Prometheus and visualize metrics in Grafana using the community-maintained Supabase dashboard.
What metrics should I monitor for Supabase?
Critical Supabase metrics include database CPU and memory usage, active connections, connection pool saturation, query latency, slow queries, replication lag, WAL growth, and storage usage. Monitoring these helps detect performance degradation before users are affected.
How do I set up monitoring for a self-hosted Supabase instance?
Self-hosted Supabase instances do not expose the same Management API as Supabase Cloud. You can monitor Postgres directly using pg_stat_statements, postgres_exporter for Prometheus, or CubeAPM with OpenTelemetry to collect database metrics and correlate them with application traces.
Does Datadog support Supabase monitoring?
Yes, Datadog has a community-maintained Supabase integration that scrapes metrics from Supabase’s Prometheus-compatible API. It provides pre-built dashboards for database performance and integrates with Datadog’s broader observability platform.
What is the cheapest way to monitor Supabase?
The cheapest option is self-hosted Prometheus and Grafana, which are free and open source but require operational overhead. Among managed options, Better Stack and Grafana Cloud offer free tiers that work well for small projects. CubeAPM provides $0.20/GB pricing with no per-seat fees for growing teams.