









NATS is a lightweight, high-performance messaging system written in Go, designed for cloud-native architectures and distributed systems. Its simplicity and speed make it a popular choice for microservices communication, IoT telemetry, and event-driven systems. But without proper monitoring, a slow message delivery, a memory leak, or a cluster partition can silently degrade system reliability before anyone notices.
According to the CNCF Annual Survey 2024, messaging and streaming, with NATS among the most deployed systems. As teams scale NATS deployments across Kubernetes, multi-cloud, and hybrid environments, visibility into server health, message throughput, and resource consumption becomes essential.
This guide covers what NATS monitoring is, how NATS exposes metrics, what to track, and how to set up monitoring using built-in endpoints, Prometheus, Grafana, and dedicated NATS monitoring tools.
What Is NATS Monitoring?
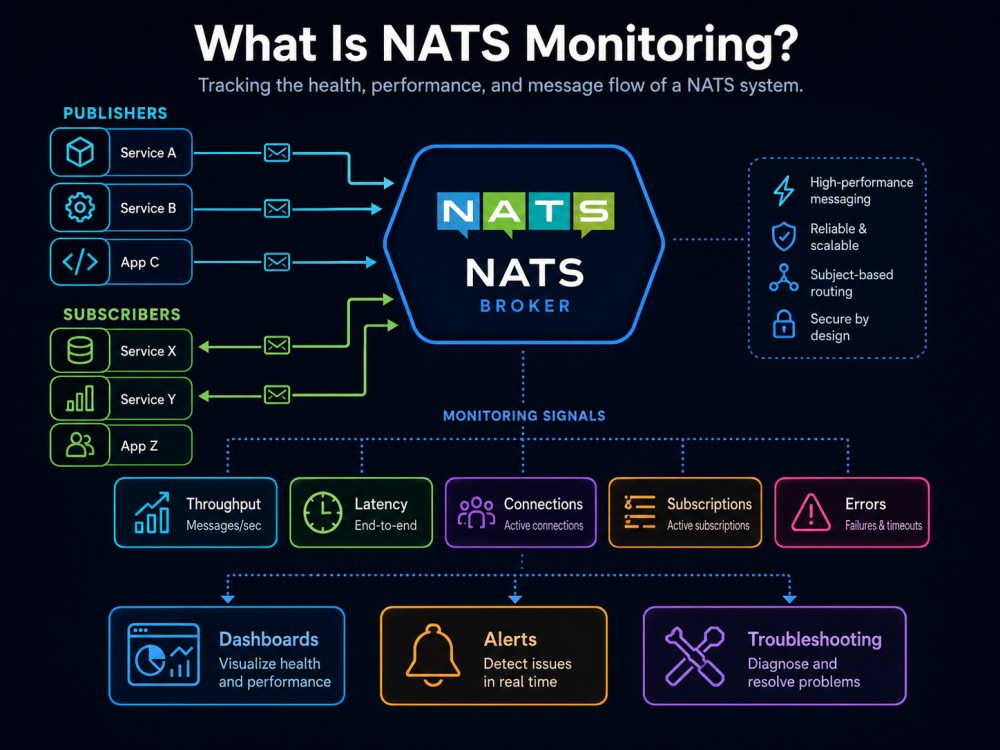
NATS monitoring is the practice of tracking the health, performance, and behavior of NATS servers and clusters in real time. It involves collecting metrics about message delivery rates, connection counts, memory usage, CPU consumption, and error conditions to ensure reliable message flow and system stability.
NATS provides a built-in HTTP monitoring endpoint that exposes real-time telemetry without requiring external probes or sidecars. This endpoint serves JSON-formatted metrics covering server state, client connections, message statistics, and resource consumption. The data can be consumed directly via HTTP requests or scraped by monitoring platforms like Prometheus.
Monitoring NATS becomes critical when systems rely on message delivery for core business logic. A missed message, delayed publish, or connection drop can cascade into service failures downstream. NATS monitoring provides early warning signals before these issues impact end users.
How NATS Monitoring Works
NATS exposes monitoring data through a lightweight HTTP server that runs on a dedicated port separate from the message transport layer. When enabled, this monitoring server provides several endpoints that return structured JSON responses containing server and cluster state.
The core monitoring endpoint is /varz, which returns general server information including uptime, memory usage, CPU utilization, number of active connections, and message counts. The /connz endpoint provides details about every active client connection including connection time, pending bytes, subscriptions, and message rates. The /routez endpoint exposes cluster routing information showing peer connections and message flow between servers. The /subsz endpoint lists active subscriptions and their statistics.
These endpoints can be queried directly via HTTP GET requests or scraped by monitoring tools that support JSON ingestion. NATS also supports Prometheus-formatted metrics via a dedicated exporter, allowing seamless integration with Prometheus and Grafana stacks.
The monitoring data flows in real time, updating as connections are established, messages are published, and subscriptions are created. This enables rapid detection of anomalies such as connection spikes, memory exhaustion, slow consumers, and message backlogs.
Enabling Monitoring in NATS
To enable the monitoring server, start NATS with the -m flag followed by the monitoring port:
nats-server -m 8222Alternatively, configure monitoring in the NATS server configuration file:
http_port: 8222Once enabled, the monitoring endpoints are accessible at http://localhost:8222/varz, http://localhost:8222/connz, and other paths. These endpoints require no authentication by default, so production deployments should restrict access via network policies or reverse proxies.
Key Monitoring Endpoints
The /varz endpoint provides high-level server metrics, including:
- Server ID, version, and uptime
- Total messages sent and received
- Number of active connections and subscriptions
- Memory usage and CPU percentage
- Slow consumer count
- Maximum payload size and connection limits
The /connz endpoint returns detailed connection data:
- Connection ID and remote address
- Number of pending bytes in send and receive buffers
- Messages sent and received per connection
- Subscription count per connection
- Connection start time
The /routez endpoint shows cluster routing state:
- Connected route peers
- Number of subscriptions propagated between servers
- Messages forwarded to each peer
- Route connection status
The /subsz endpoint lists active subscriptions:
- Subject name
- Queue group name
- Number of subscriptions on each subject
- Message counts per subscription
NATS Metrics to Track
Effective NATS monitoring requires tracking metrics across server health, message flow, client connections, and resource consumption. The specific metrics depend on deployment architecture, but certain core indicators apply universally.
Server Health Metrics
Server uptime tracks how long the NATS server has been running without restart. Unexpected restarts indicate crashes, OOM kills, or configuration errors. Memory usage shows current memory consumption and should be monitored against available limits to prevent OOM conditions. CPU usage percentage indicates processing load and helps identify bottlenecks when approaching saturation.
Error counts track connection failures, authorization errors, and slow consumer events. A sudden spike in slow consumer counts signals clients unable to keep up with message delivery rates, causing message backpressure. Connection count shows the number of active client connections and helps detect unexpected load or connection leaks.
Message Flow Metrics
Messages in and out per second measure throughput and help detect traffic pattern changes. Bytes in and out per second complement message counts by showing actual data volume, which matters for bandwidth planning and cost estimation. Subscription count indicates how many active subscriptions exist across all clients and affects message routing overhead.
Pending messages show the number of messages waiting in buffers for slow consumers. High pending counts indicate backpressure and potential message loss if buffers overflow. Dropped messages track messages that could not be delivered due to slow consumers or full buffers.
JetStream Metrics
For NATS deployments using JetStream for persistence and streaming, additional metrics become relevant. Stream count shows the number of active streams. Consumer count tracks consumers reading from those streams. Messages stored indicates total messages retained across all streams. Bytes stored shows storage consumption and helps plan capacity.
Stream lag measures how far behind consumers are from the latest message in a stream. High lag indicates slow processing or consumer failures. Acknowledgment rates show how quickly consumers acknowledge received messages, impacting delivery guarantees and replay behavior.
Cluster Metrics
In clustered NATS deployments, route metrics track connectivity between servers. Route count shows the number of active inter-server connections. Route messages forwarded indicates how many messages are being replicated or routed between cluster members. Route connection errors signal network problems or cluster partition events.
NATS Monitoring with Prometheus

Prometheus is the most common platform for monitoring NATS in production. NATS servers include a built-in HTTP monitoring endpoint that exposes metrics in JSON format, which Prometheus can scrape using the NATS Prometheus Exporter.
Setting Up Prometheus for NATS
The NATS Prometheus Exporter runs as a separate process that queries the NATS monitoring endpoint and translates JSON metrics into Prometheus format. Deploy the exporter as a sidecar container in Kubernetes or as a standalone binary on the same host as the NATS server.
Start the exporter with the NATS monitoring URL:
prometheus-nats-exporter -varz http://localhost:8222/varzConfigure Prometheus to scrape the exporter endpoint:
scrape_configs:
  - job_name: 'nats'
    static_configs:
- targets: ['localhost:7777']The exporter exposes metrics on port 7777 by default. Prometheus scrapes this endpoint at the configured interval and stores the metrics for querying and alerting.
Key Prometheus Metrics for NATS
The exporter translates NATS monitoring data into Prometheus metrics with the gnatsd_ prefix. Common metrics include:
gnatsd_varz_connections: number of active connectionsgnatsd_varz_in_msgs: total messages receivedgnatsd_varz_out_msgs: total messages sentgnatsd_varz_in_bytes: total bytes receivedgnatsd_varz_out_bytes: total bytes sentgnatsd_varz_slow_consumers: count of slow consumersgnatsd_varz_mem: memory usage in bytesgnatsd_varz_cpu: CPU usage percentage
These metrics can be queried in Prometheus using PromQL and visualized in Grafana dashboards.
NATS Monitoring Tools
Beyond Prometheus and Grafana, several tools provide dedicated NATS monitoring capabilities with pre-built dashboards, alerting, and correlation features.
NATS Surveyor
NATS Surveyor is an open-source monitoring tool built specifically for NATS. It collects metrics from NATS servers, JetStream, and clusters, then exports them to Prometheus. Surveyor includes a pre-built Grafana dashboard that visualizes server health, message flow, and cluster state.
Surveyor runs as a standalone binary or container and connects to NATS servers via the monitoring endpoint. It supports multi-server deployments and can aggregate metrics across clusters. The tool is maintained by the NATS project and reflects the official monitoring best practices.
Deploy Surveyor as a container:
docker run -d -p 7777:7777 natsio/nats-surveyor:latestConfigure Surveyor to connect to your NATS server and start collecting metrics. The Grafana dashboard provides immediate visibility into connections, message rates, and resource usage.
CubeAPM

CubeAPM is a full-stack observability platform that includes infrastructure monitoring for NATS alongside APM, logs, and distributed tracing. It runs inside your cloud or on-premises, keeping telemetry data local and eliminating data egress costs. CubeAPM supports OpenTelemetry-native ingestion and correlates NATS metrics with application traces and logs for end-to-end visibility.
CubeAPM provides pre-built dashboards for NATS covering server health, message throughput, connection counts, and JetStream state. It includes anomaly detection and smart alerting that reduces noise by grouping related signals. Pricing is $0.15/GB of data ingested with unlimited retention and no per-host or per-user fees.
For teams monitoring NATS as part of a broader observability stack that includes Kubernetes, databases, and application traces, CubeAPM offers unified monitoring without SaaS vendor lock-in.
Grafana and NATS Dashboards
Grafana is widely used to visualize NATS metrics collected via Prometheus. The NATS community maintains official Grafana dashboard templates that can be imported directly. These dashboards display real-time server metrics, connection graphs, message rate trends, and cluster health indicators.
Import the NATS Surveyor dashboard from the Grafana dashboard library or build custom dashboards using Prometheus queries. Key panels typically include connection count over time, messages per second, memory usage trends, and slow consumer alerts.
Netdata
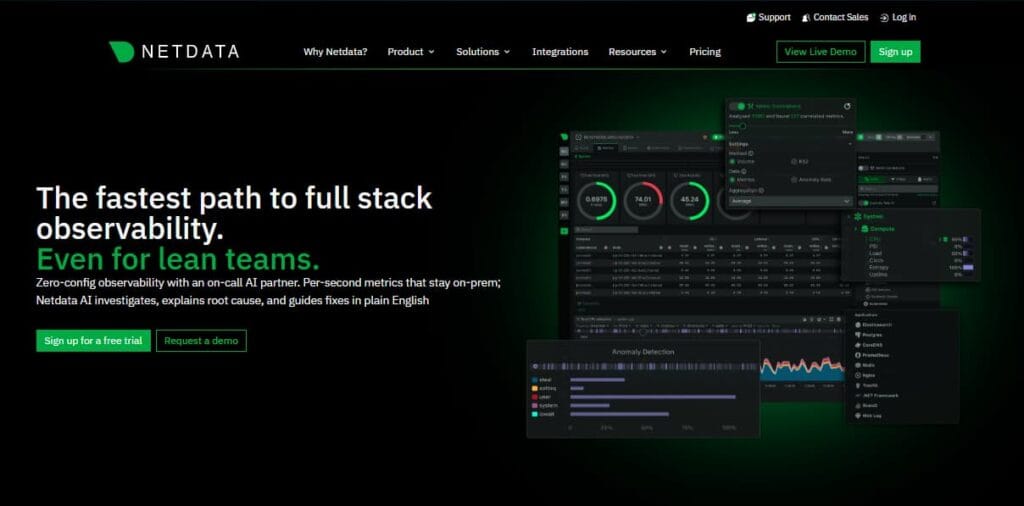
Netdata offers a NATS monitoring module that provides real-time insights into server performance. It collects metrics directly from the NATS monitoring endpoint and displays them in an interactive web interface. Netdata requires no configuration beyond enabling the NATS plugin and automatically detects running NATS servers.
Netdata is useful for quick setup and immediate visibility without requiring Prometheus infrastructure. However, it lacks long-term retention and advanced alerting compared to Prometheus-based stacks.
Datadog and New Relic
Enterprise observability platforms like Datadog and New Relic support NATS monitoring through community-built integrations. These integrations scrape the NATS monitoring endpoint and forward metrics to the platform’s dashboards and alerting systems.
Datadog NATS integration provides pre-built dashboards and monitors for connection counts, message rates, and server health. New Relic offers similar capabilities through its infrastructure agent. Both platforms charge based on host count and data volume, which can scale costs quickly in multi-server NATS deployments.
Best Practices for NATS Monitoring
Effective NATS monitoring requires more than collecting metrics. Implementing best practices around alerting, retention, and correlation ensures monitoring provides actionable insights when issues occur.
Set Alerts on Critical Thresholds
Define alerts for metrics that indicate service degradation. Alert when connection count drops unexpectedly, signaling network problems or client failures. Alert when slow consumer count exceeds a threshold, indicating message backpressure. Alert when memory usage approaches available limits to prevent OOM kills.
Use rate-based alerts for message flow metrics to detect sudden drops or spikes. A 50% reduction in messages per second might indicate an upstream failure, while a sudden spike could signal a retry storm or misconfigured client.
Monitor JetStream Separately
JetStream introduces additional failure modes compared to core NATS. Monitor stream storage consumption to prevent disk exhaustion. Alert when consumer lag exceeds defined SLAs. Track acknowledgment rates to detect slow processing or stuck consumers.
JetStream also exposes metrics about replication and cluster state. Monitor replica health and lag to ensure high availability and data durability.
Correlate NATS Metrics with Application Traces
NATS monitoring becomes more powerful when correlated with application performance data. Tools that support distributed tracing allow teams to trace a slow API request back to a delayed NATS message publish or consume operation.
Correlating NATS metrics with logs and traces shortens mean time to resolution by surfacing the exact message subject, queue group, or connection causing the bottleneck.
Retain Historical Data for Capacity Planning
Store NATS metrics long-term to identify trends and plan capacity. Analyze message rate growth over months to forecast when additional servers or resources will be needed. Review connection count patterns to understand peak load periods and optimize scaling policies.
Platforms that offer unlimited retention without additional cost, such as CubeAPM, simplify long-term capacity planning compared to tools that charge per month of retention or limit historical data access.
Test Monitoring During Failures
Validate monitoring coverage by simulating failures. Disconnect clients, exhaust server memory, partition the cluster, or flood the system with messages. Confirm that alerts fire within expected timeframes and provide sufficient context to diagnose the issue.
Regular failure testing ensures monitoring remains effective as systems evolve and dependencies change.
Conclusion
NATS monitoring provides essential visibility into the health, performance, and reliability of messaging infrastructure. By tracking server metrics, message flow, connection state, and resource consumption, teams can detect and resolve issues before they impact downstream services.
NATS exposes monitoring data through built-in HTTP endpoints that integrate seamlessly with Prometheus, Grafana, and dedicated monitoring tools. Whether using open-source solutions like NATS Surveyor or full-stack platforms like CubeAPM, the key is correlating NATS metrics with broader system telemetry to understand how message delivery affects application behavior.
For teams running NATS in production, effective monitoring reduces incident response time, improves capacity planning, and ensures reliable message delivery at scale.
Disclaimer: The information in this article reflects the latest details available at the time of publication and may change as technologies and products evolve. Features, pricing, and plan limits can change over time. Always verify the latest information directly with the vendor before making purchasing or deployment decisions.
Frequently Asked Questions
How to check if NATS is running?
Query the NATS monitoring endpoint at `http://localhost:8222/varz`. If the server is running, it returns a JSON response with server state and metrics. Alternatively, use the NATS CLI command `nats server ping` to check server connectivity.
What metrics should I monitor for NATS in production?
Monitor connection count, messages in and out per second, memory usage, CPU percentage, slow consumer count, and pending message count. For JetStream, track stream storage, consumer lag, and acknowledgment rates. Alert on unexpected drops in connection count or spikes in slow consumers.
How do I integrate NATS monitoring with Prometheus?
Use the NATS Prometheus Exporter to scrape the NATS monitoring endpoint and expose metrics in Prometheus format. Configure Prometheus to scrape the exporter endpoint, then visualize metrics in Grafana using pre-built NATS dashboards.
What is the difference between NATS core monitoring and JetStream monitoring?
NATS core monitoring tracks server health, connections, and message flow through the pub-sub system. JetStream monitoring adds stream-specific metrics including storage consumption, consumer lag, acknowledgment rates, and replication state. JetStream requires separate monitoring configuration.
Can I monitor NATS without installing Prometheus?
Yes, tools like Netdata, NATS Surveyor, and CubeAPM can monitor NATS without requiring a separate Prometheus installation. NATS also exposes raw JSON metrics via the monitoring endpoint, which can be consumed directly by custom scripts or monitoring agents.
How do I monitor NATS clusters?
Enable monitoring on all cluster members and scrape each server’s monitoring endpoint. Use the `/routez` endpoint to track inter-server connections and message forwarding. Monitor route connection status, message replication rates, and cluster partition events using dedicated cluster metrics.
What tools provide pre-built NATS dashboards?
NATS Surveyor, Grafana with Prometheus, Netdata, Datadog, and CubeAPM all provide pre-built dashboards for NATS monitoring. NATS Surveyor includes an official Grafana dashboard maintained by the NATS project that covers server health, message rates, and JetStream state.