










AppSignal is a developer-focused APM and monitoring platform for teams that want application performance monitoring, error tracking, host metrics, uptime monitoring, check-ins, dashboards, and logging in one place. It is especially strong for Ruby, Elixir, Node.js, Python, and JavaScript teams, with broader coverage through OpenTelemetry.
AppSignal pricing is built around monthly request volume instead of hosts, users, applications, or dashboards. AppSignal counts a request when an app handles a client request or runs a background job, and it measures total monthly usage across all applications.
That makes AppSignal easier to estimate than many host-based or ingest-based observability tools, but buyers still need to watch request growth, background job volume, logging storage, long-term log retention, and compliance add-ons. This review verifies AppSignal’s current pricing, billing rules, real cost examples, user reviews, and alternatives before you shortlist it.
What Is AppSignal?
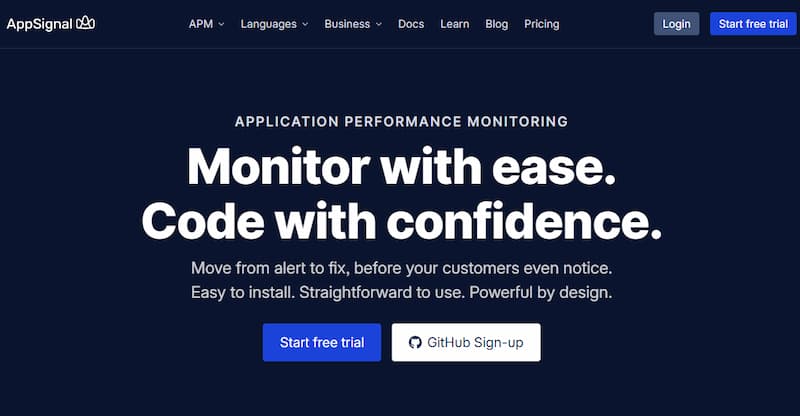
AppSignal is an application performance monitoring and observability platform built by AppSignal B.V., a Netherlands-based software company. The platform combines APM, error tracking, host monitoring, uptime monitoring, anomaly detection, metric dashboards, check-ins, and logging in a unified interface. AppSignal says more than 1,500 development teams use the platform.
AppSignal is positioned as a simpler monitoring option for developer-led teams that do not want the pricing and setup complexity of larger enterprise platforms. Its main pricing difference is that it charges mainly by monthly requests, not by hosts, users, apps, teams, or dashboards.
Supported Languages and Frameworks
AppSignal has installation documentation for Ruby, Elixir, Node.js, Python, front-end JavaScript, Go, Java, and PHP. Its setup guide says the installation wizard currently supports Ruby, Elixir, and Node.js for error and performance monitoring, JavaScript for front-end error monitoring, and also provides installation paths for Python, Go, Java, and PHP.
AppSignal also supports additional ecosystems through OpenTelemetry. Its OpenTelemetry page lists support for Ruby on Rails, Elixir, Node.js, JavaScript error tracking, Python, Go, Java, PHP, and Rust, along with integrations such as Kubernetes and Vercel.
Key Features of AppSignal
AppSignal groups errors and gives developers context for debugging. Its pricing page lists error debugging reports, real-time error alerts, issue tracker routing, filtering, error charts, trends, and custom tags as part of its error tracking feature set.
AppSignal provides performance monitoring for application requests and background work. Its pricing page lists alerts for slow requests, duration breakdowns, event timelines, memory leak detection, slow queries, and N+1 query detection.
AppSignal includes host monitoring features such as CPU usage, disk I/O, disk usage, load average, memory usage, network usage, and host comparison. This is useful for teams that want basic infrastructure context without adding a separate host-monitoring product.
AppSignal includes uptime monitoring with HTTP/HTTPS checks, downtime alerts, uptime metrics, and checks from four locations. It also includes a free public status page.
AppSignal Check-ins help teams monitor cron jobs, scheduled tasks, heartbeat jobs, and background processes. AppSignal’s Check-ins documentation shows that users can create cron check-ins and heartbeat check-ins from the Check-ins page.
AppSignal supports default dashboards, custom dashboards, fullscreen views, shareable charts, and custom metrics from code. The pricing page also states that all plans include unlimited dashboards.
AppSignal has log management, but this section needs careful wording. Logging is not unlimited. AppSignal’s pricing page lists logging as a paid add-on with 1 GB/month free, and its billing documentation says all plans include 1 GB of free logging storage. For logs above 1 GB, customers are charged under the appropriate logging plan, starting at 10 GB.
AppSignal supports OpenTelemetry, which allows teams to send telemetry from languages and frameworks beyond its strongest native agents. AppSignal says OpenTelemetry extends monitoring beyond native integrations for Ruby, Elixir, Node.js, Python, and front-end JavaScript into ecosystems such as Go, Java, PHP, Rust, Laravel, Symfony, Next.js, and Vercel.
AppSignal lists MCP Server as one of its product features on the pricing page. This is relevant for teams exploring AI-assisted debugging workflows, but it should be presented as a product capability rather than a core APM requirement.
AppSignal Pricing in 2026
AppSignal uses request-based pricing. The official paid plan starts at $279/year, which equals $23.25/month when billed yearly, for 250K monthly requests. AppSignal also offers a permanent free plan with 50K monthly requests, 1 GB logging, and 5-day retention.
AppSignal Free Plan
| Feature | Free plan details |
| Monthly requests | 50K requests |
| Logging | 1 GB included |
| Retention | 5 days |
AppSignal Paid Plan
| Plan | Official verified price | Notes |
| 250K requests/month | $279/year, or $23.25/month billed yearly | Official AppSignal starting paid plan |
What Counts as a Request in AppSignal?
AppSignal counts usage mainly through monthly requests. A billable request is counted when an app handles a request from a client or when it runs a background job. AppSignal’s billing documentation also says a request always contains performance metrics and may include error metrics, but it is still considered one request.
At the time of AppSignal’s current billing documentation, custom metrics, uptime monitors, and host metrics do not count against the plan’s request limit. That is an important detail because it means AppSignal’s core bill is more closely tied to application traffic and background job volume than to infrastructure size.
Example
If one app processes 250K monthly web requests on one host, it uses the 250K request allocation. If the same total request volume is spread across multiple hosts or containers, the request usage is still based on the total request count, not the number of hosts.
That makes AppSignal easier to forecast for teams that scale infrastructure horizontally but do not see the same rate of traffic growth.
What Is Included in All Plans?
AppSignal’s pricing page says all plans include unlimited users, unlimited teams, unlimited applications, and unlimited dashboards. It also says all features are available in all plans, but logging should still be treated carefully because only 1 GB/month is included for free and logging beyond that is billed through logging plans.
| Included area | Verified note |
| Users | Unlimited users |
| Teams | Unlimited teams |
| Applications | Unlimited applications |
| Dashboards | Unlimited dashboards |
What Does AppSignal Really Cost?
The scenarios below are directional editorial estimates based on AppSignal’s public pricing information, billing documentation, and the pricing calculator behavior shown on AppSignal’s website as of May 2026. They are not official AppSignal quotes.
AppSignal pricing has two main parts in this model: application monitoring and logging. Application monitoring is based on monthly request volume. AppSignal counts both client-handled application requests and background job executions as requests. Logging is a paid add-on after the included 1 GB/month of log storage. AppSignal’s billing docs state that logs above the free 1 GB allowance are charged through logging storage buckets, starting at 10 GB.
Actual costs can change based on request volume, background job volume, log volume, retention needs, billing cycle, currency, and custom terms. Buyers should verify the final number inside AppSignal’s pricing calculator or directly with AppSignal before purchase.
Pricing Assumptions Used in These Scenarios
AppSignal’s public pricing page shows 250K requests/month at $279/year, or $23.25/month when billed yearly. The page also states that all plans include unlimited users, unlimited teams, unlimited applications, and unlimited dashboards.
For logging, we use the pricing relationship shown in AppSignal’s calculator:
| Logging amount | Annual logging cost | Monthly equivalent |
| 20 GB/month | $218/year | ~$18.17/month |
| 10 GB/month | ~$109/year | ~$9.08/month |
| 1 TB/month | ~$11,161/year | ~$930/month |
So the working logging formula is:
| Formula item | Value |
| Logging cost per 10 GB/month | ~$9.08/month |
| Logging cost per 1 GB/month | ~$0.908/month |
| Estimated monthly log cost | Monthly log GB × ~$0.908 |
This means logging becomes the main cost driver when log volume reaches hundreds of GB or multiple TB per month.
Workload Assumptions Used for AppSignal Estimates
For AppSignal, traces and metrics are not priced directly in this model. We only use logs for the logging add-on and requests for application monitoring.
| Team size | Request assumption | Log volume assumption | Retention assumption | Add-ons included? |
| Small team | ~3M requests/month | ~720 GB logs/month | Standard AppSignal logging retention | No |
| Growing team | ~25M requests/month | ~2.5 TB logs/month | Standard AppSignal logging retention | No |
| Mid-market team | ~500M requests/month | ~13.5 TB logs/month | Standard AppSignal logging retention | No |
Scenario 1: Small Team, ~3M Requests/Month + ~720 GB Logs/Month
Situation
A small engineering team runs a few production services with application monitoring, error tracking, uptime checks, host metrics, background jobs, and log search enabled. The team does not have a dedicated observability engineer, so it wants a simpler SaaS APM tool with predictable request-based billing.
Why teams at this stage consider AppSignal
Teams at this stage may consider AppSignal because it avoids per-host and per-user billing. AppSignal also includes unlimited users, teams, applications, and dashboards, which makes it easier for small teams to add developers without changing the bill directly.
Estimated profile
| Configuration | Detail |
| Monthly request volume | ~3M requests/month |
| Background jobs | Moderate |
| Log volume | ~720 GB/month |
Estimated monthly cost
Disclaimer: This is a directional editorial estimate based on AppSignal’s public pricing model and observed calculator behavior. It is not an official AppSignal quote.
| Component | Calculation | Monthly cost |
| Application monitoring | 3M request tier | ~$59/month |
| Logging | 720 GB × ~$0.908/GB | ~$654/month |
| Long-term log storage | Not included | $0 |
| HIPAA Compliance | Not included | $0 |
| Total estimated cost | $59 + $654 | ~$713/month |
What this scenario shows
At small-team scale, AppSignal can still be relatively predictable, but logs already matter more than request volume. The application monitoring tier is modest, while 720 GB of logs creates most of the estimated monthly cost.
Scenario 2: Growing Team, ~25M Requests/Month + ~2.5 TB Logs/Month
Situation
A growing SaaS team runs more production services, APIs, background workers, scheduled jobs, and customer-facing workflows. The team needs APM, error tracking, uptime monitoring, host metrics, logs, and alerting across multiple services.
Why teams at this stage consider AppSignal
Teams at this stage may evaluate AppSignal because its billing model is still easier to understand than multi-meter observability pricing. Instead of paying separately by host, user, dashboard, or application, the core monitoring bill follows request volume, while logs are modeled separately as a storage add-on.
Estimated profile
| Configuration | Detail |
| Monthly request volume | ~25M requests/month |
| Background jobs | Moderate to high |
| Log volume | ~2.5 TB/month |
Estimated monthly cost
Disclaimer: This is a directional editorial estimate. Actual AppSignal pricing may vary based on the exact pricing selector result, contract terms, billing cycle, and add-ons.
| Component | Calculation | Monthly cost |
| Application monitoring | 25M request tier | ~$239/month |
| Logging | 2,500 GB × ~$0.908/GB | ~$2,270/month |
| Long-term log storage | Not included | $0 |
| HIPAA Compliance | Not included | $0 |
| Total estimated cost | $239 + $2,270 | ~$2,509/month |
What this scenario shows
At growing-team scale, logging becomes the dominant cost driver. The request tier is still easy to estimate, but 2.5 TB of monthly logs pushes the total into the low-thousands range. Teams using AppSignal at this stage should review logging volume, noisy services, debug logs, and retention needs before committing.
Scenario 3: Mid-Market Team, ~500M Requests/Month + ~13.5 TB Logs/Month
Situation
A mid-market engineering team runs a larger distributed application with many customer-facing APIs, background workers, queues, scheduled jobs, and production services. The team needs APM, error tracking, host correlation, uptime monitoring, alerts, and enough log volume to investigate incidents across services.
Why teams at this stage consider AppSignal
Teams at this scale may still consider AppSignal because its pricing model is simpler than platforms that combine host billing, ingest billing, indexed log billing, user seats, and separate add-on products. However, large log volume and high request volume now need careful modeling.
Estimated profile
| Configuration | Detail |
| Monthly request volume | ~500M requests/month |
| Background jobs | High |
| Log volume | ~13.5 TB/month |
| Retention | Standard AppSignal logging retention |
| Long-term log storage | Not included |
| HIPAA Compliance | Not included |
| Pricing basis | Higher request-tier estimate + logging add-on |
Estimated monthly cost
Disclaimer: This workload is beyond the clearly visible public 250K pricing example and should be confirmed directly in AppSignal’s pricing calculator or with AppSignal sales. The request-tier number below is a directional estimate used only for editorial modeling.
| Component | Calculation | Monthly cost |
| Application monitoring | Higher request-tier estimate for ~500M requests/month | ~$847/month |
| Logging | 13,500 GB × ~$0.908/GB | ~$12,258/month |
| Long-term log storage | Not included | $0 |
| HIPAA Compliance | Not included | $0 |
| Total estimated cost | $847 + $12,258 | ~$13,105/month |
What this scenario shows
At mid-market scale, AppSignal’s real-world cost is shaped mainly by log volume. The request-based APM cost is still important, but 13.5 TB/month of logs creates most of the bill. Buyers at this stage should confirm exact request-tier pricing, logging bucket pricing, retention requirements, and any Business add-ons before choosing AppSignal.
What Drives AppSignal Costs?
Request volume is the main billing driver. Web requests, API requests, and background job executions can all increase usage.
Background jobs count as requests. This matters for systems with queues, scheduled workers, cron jobs, asynchronous tasks, and event-driven processing. A system with moderate web traffic but heavy background processing can still move into a higher request tier.
AppSignal includes 1 GB/month of logging storage, but logging above that is charged through logging plans starting at 10 GB. Teams with verbose logs, debug-level logging, or high API traffic should estimate logging separately.
Long-term log storage is listed as a business add-on. The official pricing page shows it at $89/month, while a separate add-on page currently describes long-term log syncing as $99/month. Because there is a mismatch between AppSignal pages, buyers should confirm the current price directly before purchase.
HIPAA Compliance is listed as a $89/month business add-on on AppSignal’s pricing page. AppSignal has also written about its HIPAA BAA add-on as part of its business add-ons.
Additional Costs Buyers Should Plan For
| Hidden cost area | Why it matters |
| Log growth | 1 GB/month is included, but production logs can exceed this quickly |
| Background job volume | Jobs count as requests, so worker-heavy systems can increase usage |
| Compliance | HIPAA support is a paid add-on |
| Longer retention | Long-term log storage is a business add-on |
| Higher request tiers | Sustained traffic growth can move the account into a larger plan |
| US data residency | US hosting is coming soon, not clearly generally available |
AppSignal User Reviews
AppSignal has a smaller public review base than major observability platforms, so the feedback should be read with that context. Still, the available reviews are generally positive. AppSignal’s pricing page says it is rated 4.8 on G2, and public review pages commonly highlight simple setup, developer-friendly monitoring, clear billing, and strong support.
What Users Like
Users often praise AppSignal for being simple to install and connect to an application. This comes up strongly in reviews for Ruby, Rails, Elixir, Phoenix, and similar backend stacks, where AppSignal can start showing useful performance and error data without heavy setup work.
Reviewers also like that AppSignal’s billing feels easier to understand than many larger observability platforms. G2 review summaries mention simple billing, and AppSignal’s own pricing page emphasizes no hidden fees, no overages, and access to all features on every plan.
Users rate AppSignal well for support quality. G2 comparison data says reviewers preferred doing business with AppSignal and rated its support positively, which fits AppSignal’s developer-first positioning.
Users like that AppSignal brings APM, error tracking, performance monitoring, and basic operational visibility into one workflow. Capterra reviews mention easy error discovery, useful GitHub integration, and a simple overview that helps developers find issues faster.
What Users Dislike
The following points reflect recurring themes from G2, Capterra, and community review summaries. They should be treated as user feedback, not universal limitations of AppSignal.
Some users note that AppSignal can become expensive as traffic increases. This matches how AppSignal pricing works: application monitoring scales with monthly requests and background jobs, while logs become a paid add-on after the included 1 GB. Teams with high request volume or heavy production logs should model costs before committing.
A Capterra reviewer notes that AppSignal has more limited functionality compared with larger tools such as New Relic. This is a fair trade-off to mention: AppSignal is simpler and easier to use, but teams that need deep enterprise observability, advanced analytics, or broad platform coverage may need to compare it with New Relic, Datadog, Dynatrace, or CubeAPM.
AppSignal Review Summary
| Review source | Rating |
| G2 | 4.8/5 |
| Capterra | 4.5/5 |
| Software Advice | 4.5/5 |
| TrustRadius | 9.6/10 |
AppSignal Alternatives
AppSignal competes with developer-first monitoring tools, large SaaS observability platforms, log/incident platforms, and self-hosted observability products.
AppSignal vs. CubeAPM
AppSignal is a SaaS APM platform built for teams that want fast setup, request-based pricing, and a developer-friendly workflow. It is a strong fit for Ruby, Elixir, Node.js, Python, and JavaScript teams that want APM, error tracking, uptime checks, host monitoring, check-ins, and logs in one product.
CubeAPM is a self-hosted, OpenTelemetry-native observability platform built for teams that want telemetry to stay inside their own infrastructure. It is better suited for teams that care about data ownership, Kubernetes-heavy environments, predictable per-GB pricing, and full-stack visibility across metrics, events, logs, and traces.
| Category | AppSignal | CubeAPM |
| Pricing model | Request-based SaaS pricing | Predictable per-GB pricing |
| Deployment | SaaS hosted by AppSignal | Self-hosted inside customer infrastructure |
| Logs | 1 GB free, then paid logging plans | Full log management inside customer environment |
| OpenTelemetry | Supported | OTel-native |
| Best for | Small and mid-size dev teams wanting simple SaaS APM | Teams needing infrastructure control, compliance, and predictable telemetry costs |
For teams comparing AppSignal against larger SaaS vendors, CubeAPM is worth evaluating when data residency, cost predictability, and OpenTelemetry control matter more than a fully hosted SaaS workflow.
AppSignal vs. Sentry
Sentry is developer-first, but it is more focused on error monitoring, debugging, tracing, replays, and logs. Sentry’s pricing is event-based across errors, traces, replays, and logs, while AppSignal uses request-based pricing and includes APM, host monitoring, uptime checks, check-ins, and dashboards in one product.
| Category | AppSignal | Sentry |
| Pricing model | Request-based | Event-based across errors, traces, replays, and logs |
| Error tracking | Included | Core strength |
| APM | Included | Performance monitoring/tracing available |
| Logs | 1 GB free, then paid logging plans | Logs included up to plan limits, extra usage through PAYG |
| Best for | All-in-one APM for dev teams | Error tracking and debugging-first teams |
AppSignal vs. Datadog
Datadog is a broad enterprise observability platform with infrastructure monitoring, APM, logs, RUM, synthetics, security, and many integrations. Datadog’s pricing is modular and varies by product. Its pricing list shows Infrastructure Pro at $15 per host/month on annual billing, and Datadog’s APM billing documentation lists APM Enterprise at $40 per underlying APM host.
| Category | AppSignal | Datadog |
| Pricing model | Request-based | Modular pricing by product and usage |
| APM | Included in AppSignal plan | Separate APM pricing |
| Logs | 1 GB free, then paid logging plans | Separate log management pricing |
| Integrations | Strong for common developer stacks | Broad enterprise integration ecosystem |
| Best for | Developer teams wanting billing simplicity | Enterprise teams needing broad observability and security |
Choose AppSignal if you want simpler pricing and developer-friendly APM. Choose Datadog if you need broad cloud, infrastructure, security, and enterprise observability coverage.
AppSignal vs. New Relic
New Relic is a full-stack observability platform with pricing built around data ingest and users. New Relic’s official pricing page lists 100 GB/month of free Original Data ingest and $0.40/GB beyond the free limit on Standard and Pro, while Data Plus is listed at $0.60/GB beyond the free limit.
| Category | AppSignal | New Relic |
| Pricing model | Request-based | Data ingest + user pricing |
| Free tier | 50K requests/month | 100 GB/month free ingest |
| APM | Strong for supported developer stacks | Broad APM across many environments |
| Logs | 1 GB free, then paid logging plans | Unified logs with ingest-based pricing |
| Best for | Smaller teams wanting simple APM billing | Teams wanting full-stack SaaS observability |
Choose AppSignal if request-based pricing is easier for your team to forecast. Choose New Relic if you want broader full-stack observability and are comfortable managing ingest and user-based costs.
AppSignal vs. Dynatrace
Dynatrace is an enterprise observability platform built around application and infrastructure observability, automation, AI-assisted analysis, logs, digital experience monitoring, and application security. Dynatrace’s official rate card lists Full-Stack Monitoring at $0.01 per memory-GiB-hour and Infrastructure Monitoring at $0.04 per hour for any size host.
| Category | AppSignal | Dynatrace |
| Pricing model | Request-based | Modular consumption-based pricing |
| Setup | Lightweight per language | OneAgent and enterprise deployment model |
| APM depth | Good for supported dev stacks | Deep enterprise APM and automation |
| AI/automation | Anomaly detection and alerts | Davis AI and automated root-cause analysis |
| Best for | Small and mid-size developer teams | Large enterprises and complex environments |
Choose AppSignal for simple developer-first monitoring. Choose Dynatrace for deep enterprise observability, automation, and complex multi-cloud environments.
AppSignal vs. Better Stack
Better Stack focuses strongly on logs, uptime monitoring, incident management, and status pages. AppSignal is more APM-centered, with performance monitoring, error tracking, host metrics, uptime checks, check-ins, and logs. Better Stack can be stronger for log workflows and incident response, while AppSignal is better when application performance monitoring is the core need.
| Category | AppSignal | Better Stack |
| Pricing model | Request-based | Log/event volume and plan-based |
| APM | Core product area | Not the main product focus |
| Error tracking | Included | Not the main product focus |
| Uptime monitoring | Included | Core strength |
| Logs | 1 GB free, then paid logging plans | Core strength |
| Best for | Dev teams wanting APM + monitoring | Teams wanting log management and incident workflows |
Is AppSignal the Right Choice?
When AppSignal Is the right fit
AppSignal is a strong fit for teams using its supported ecosystems and wanting quick APM setup without a lot of configuration. Its own site lists support for Ruby on Rails, Elixir, Node.js, JavaScript, Python, Go, Java, PHP, Rust, OpenTelemetry, Vercel, and Kubernetes.
AppSignal does not charge separately by user, team, application, or dashboard. Its main billing unit is monthly request volume, which is easier for many small teams to understand than multi-product observability pricing.
Small and mid-sized engineering teams can get APM, error tracking, host metrics, uptime checks, dashboards, alerts, logging, and check-ins without stitching together many tools.
If traffic and background job volume are easy to estimate, AppSignal pricing can be easier to forecast.
When AppSignal May Not Be the Right Fit
At very high request volume, AppSignal can still become expensive because pricing rises with monthly requests and background jobs.
AppSignal includes only 1 GB of logging before paid logging buckets apply. Teams with high log volume should estimate logging separately.
AppSignal is SaaS. Teams that need telemetry to stay inside their own cloud or on-prem environment should evaluate self-hosted options like CubeAPM.
AppSignal says US data hosting is coming soon. Buyers should confirm availability directly with AppSignal before relying on it for compliance.
Large enterprises needing advanced service maps, security products, digital experience monitoring, automated root cause analysis, or complex cloud governance may prefer Datadog, New Relic, Dynatrace, or a self-hosted OpenTelemetry-native stack.
Conclusion
AppSignal is a strong APM choice for developer-led teams that want simple setup, request-based pricing, error tracking, performance monitoring, host metrics, uptime checks, check-ins, dashboards, and basic logging in one SaaS platform.
Its pricing is easier to understand than many enterprise observability platforms because it does not charge separately by host, user, application, team, or dashboard. The official paid plan starts at $279/year for 250K monthly requests, and the free plan includes 50K requests, 1 GB logging, and 5-day retention.
The main trade-offs are scale, logs, and data control. High request volume, heavy background jobs, extra log storage, long-term retention, HIPAA requirements, and data residency needs can all affect the real cost. Teams that need self-hosted observability, stronger data ownership, OpenTelemetry-native control, or predictable per-GB pricing should evaluate CubeAPM alongside AppSignal.
Disclaimer: The pricing estimates in this article are directional editorial models based on AppSignal’s publicly available pricing and calculator as of May 2026. They are not official AppSignal quotes. Actual costs depend on host count, span volume, plan selection, billing cycle, and any negotiated terms. The review themes reflect user feedback from G2, Capterra, and community discussions and should not be treated as universal product limitations. Always verify current pricing and features at appsignal.com before making purchasing decisions.
FAQs
1. What is AppSignal’s starting price?
AppSignal’s paid plan starts at $279/year, equal to $23.25/month when billed yearly, for 250K monthly requests.
2. Does AppSignal have a free plan?
Yes. AppSignal has a permanent free plan with 50K monthly requests, 1 GB logging, and 5-day retention.
3. How does AppSignal pricing work?
AppSignal uses request-based pricing. It counts client requests handled by an application and background jobs run by the application. Usage is measured across all applications.
4. Does AppSignal charge per host?
No. AppSignal pricing is not mainly based on host count. Its pricing page says plans include unlimited applications, users, teams, and dashboards.
5. Does AppSignal support OpenTelemetry?
Yes. AppSignal supports OpenTelemetry and says OpenTelemetry can send traces, metrics, and logs to AppSignal.
6. What are the best AppSignal alternatives?
Common alternatives include CubeAPM, Sentry, Datadog, New Relic, Dynatrace, and Better Stack. CubeAPM is a strong fit for teams that want self-hosted, OpenTelemetry-native observability with telemetry stored inside their own infrastructure.