









Amazon RDS is the managed database service many AWS teams use when they do not want to run databases from scratch. It supports engines like MySQL, PostgreSQL, MariaDB, Oracle, SQL Server, and Amazon Aurora, while AWS handles much of the setup, patching, backups, and underlying infrastructure.
That is why AWS RDS monitoring is not optional. It is the discipline of continuously collecting, analyzing, and acting on the metrics, logs, events, and traces that describe how your RDS instances are behaving. Done well, monitoring lets you catch storage exhaustion before a write fails, identify a runaway query before it brings down an entire cluster, and right-size instances before the cloud bill mushrooms.
This guide covers everything you need to build a robust AWS RDS monitoring strategy: what the service is, the key metrics to watch, every native monitoring tool AWS provides, and best practices backed by AWS Prescriptive Guidance.
What Is Amazon RDS and Why Does Monitoring Matter?
Amazon RDS is AWS’s managed relational database service. It helps teams create, run, and scale databases in the cloud without handling every low-level admin task themselves. AWS takes care of common work like provisioning, patching, backups, and basic maintenance.
AWS supports multiple popular engines under the RDS umbrella:
- Amazon Aurora (MySQL-compatible and PostgreSQL-compatible)
- MySQL
- PostgreSQL
- MariaDB
- Oracle
- Microsoft SQL Server
The appeal of RDS is its low-administration model. AWS handles the undifferentiated heavy lifting so teams can focus on building applications. However, that same convenience creates a blind spot: because the platform manages so much automatically, teams can underestimate how much operational intelligence is still required from them. Monitoring fills that gap.
Why monitoring is business-critical
Most applications have a database at their core. When that database slows down, users feel it immediately. Transactions hang. Dashboards refuse to load. APIs start timing out, and the support queue fills up fast.
RDS monitoring is what keeps that from blindsiding you. It gives your DBAs and SREs enough visibility to catch a problem while it is still small, recognize when usage is trending toward a capacity ceiling, and understand where money is quietly leaking before the bill arrives.
The Three Monitoring Layers in Amazon RDS
AWS structures RDS observability across three distinct layers. Understanding this architecture helps you select the right tool for each problem.
1. Instance-Level Monitoring (Amazon CloudWatch)
AWS CloudWatch watches the machine: CPU, storage, memory, network throughput, and how many clients are connected. RDS feeds these metrics to CloudWatch automatically, once a minute, and there is no extra charge for it. It is the first place you look and the foundation everything else is built on.
2. Operating System-Level Monitoring (Enhanced Monitoring)
Sometimes instance-level metrics are not granular enough. Enhanced Monitoring deploys a lightweight agent directly on the DB instance host and captures OS-level telemetry, including per-process CPU, memory pages, swap activity, and disk I/O, all at up to 1-second granularity. This is critical for diagnosing problems that are invisible at the 1-minute CloudWatch resolution.
3. Database Engine-Level Monitoring (CloudWatch Database Insights)
CloudWatch Database Insights is now the main AWS-native tool for database engine-level monitoring. It helps you analyze DB Load, wait events, SQL activity, and database health from the CloudWatch console. This is the layer you use when CloudWatch shows that a resource is under pressure, but you need to know which query, user, wait event, or workload is causing it.
Key AWS RDS Metrics to Monitor
Before configuring alerts, you need to know what to watch. The table below lists the most important RDS CloudWatch metrics, what they measure, and why they matter.
| Metric | What It Measures | When to Worry |
| CPUUtilization | Processor load across all DB activity | Above 80% sustained? Tune queries before you scale hardware |
| DatabaseConnections | Active client connections | Spike with no traffic increase usually means a connection leak |
| FreeStorageSpace | Disk remaining on the instance | Alarm at 20%. Zero means writes stop, instantly |
| ReadLatency / WriteLatency | Time per disk read or write (seconds) | Any upward trend over days means I/O pressure is building |
| ReplicaLag | How far a Read Replica trails the primary | Even a few seconds means users are reading stale data |
| FreeableMemory | RAM available to the DB engine | Drops low and RDS starts hitting disk. Query times spike fast |
| NetworkReceiveThroughput / NetworkTransmitThroughput | Bytes in and out per second | Watch closely on instances running bulk exports or ETL jobs |
| BurstBalance | CPU credit balance on T-class instances | Drains to zero and the instance throttles to baseline CPU silently |
How to Establish a Performance Baseline
Before you set a single alarm, you need to know what normal looks like for your specific database. That means running it through real load patterns: a typical weekday, a month-end batch run, a traffic spike. Measure performance across all of them and record it. Your alerts should fire when something deviates from your baseline, not when it crosses a number someone else picked.
- Performance Warning Signs to Watch For: AWS flags these as the most common signals that something is going wrong:
- CPU or RAM running higher than expected: Not always a hardware problem. Check for slow queries and missing indexes first.
- Disk above 85% capacity. At this point you should already be investigating what can be archived or cleaned up, not waiting for an alarm.
- Network throughput below your normal baseline. A drop here with no change in traffic usually points to a configuration or connectivity issue worth investigating.
- Connection count rising while performance is falling. Classic sign that connection limits need tightening or that a connection pool is misconfigured.
- IOPS deviating from baseline. If your working data set has grown beyond what fits in memory, reads start hitting disk and IOPS climb. That is usually the fix to look at first.
Want a deeper walkthrough on monitoring AWS RDS with Prometheus? Our guide covers metric collection, alert configuration, and dashboard setup end to end.
Read the Full GuideNative AWS Monitoring Tools for RDS: A Complete Reference
AWS provides a suite of native tools that together cover every monitoring layer. The table below summarizes the full toolkit.
| Tool | Layer Covered | Key Strength | Data Granularity |
| Amazon CloudWatch | Instance-level | 50+ built-in metrics, alarms, dashboards | 1-minute intervals; no extra charge |
| Enhanced Monitoring | OS-level | Process-level CPU, memory, disk, swap | Up to 1-second granularity |
| CloudWatch Database Insights | DB engine-level | DB Load, wait events, SQL analysis, | Standard mode includes basic visibility |
| CloudWatch Logs | Log analysis | Error, slow-query, and audit log storage | Real-time streaming |
| Database Activity Streams | Security / audit | Near-real-time encrypted activity stream | Per-statement capture |
| Amazon DevOps Guru | Anomaly detection | ML-driven proactive performance recommendations | Continuous |
| AWS CloudTrail | API audit | Logs console and API calls for compliance | Per-event |
Amazon CloudWatch
CloudWatch is the foundation of AWS RDS monitoring. It automatically collects over 50 default metrics for every active RDS instance and makes them available for dashboards, alarms, and programmatic queries. Alarms can be static (for example, alert when CPUUtilization exceeds 80%) or dynamic, using anomaly detection powered by machine learning.
Amazon RDS Enhanced Monitoring
Enhanced Monitoring deploys an agent directly on the DB instance host rather than reading from the hypervisor. That gap matters. CloudWatch averages data over one-minute windows, which means a sub-minute spike can disappear entirely. In AWS testing, Enhanced Monitoring caught WriteIOPS at 1,600 during a burst load that CloudWatch reported as 530. Same instance, same moment, very different picture.
Metrics land in CloudWatch Logs under RDSOSMetrics in JSON format, at granularity intervals of 1, 5, 10, 15, 30, or 60 seconds.
Amazon CloudWatch Database Insights
Amazon CloudWatch Database Insights is the successor to the standalone RDS Performance Insights console experience. It brings database performance monitoring into CloudWatch and helps teams analyze DB Load, wait events, top SQL statements, database health, and fleet-level performance from one place.
Key capabilities include:
- DB Load analysis: Shows how much active work the database is handling and whether load is above the instance’s available vCPU capacity.
- Wait event breakdown: Helps identify whether slowness is coming from CPU, I/O, locks, commits, or other database waits.
- Top SQL visibility: Surfaces the queries contributing most to database load.
- Fleet-level monitoring: Lets teams monitor multiple RDS and Aurora databases from the CloudWatch console.
- Advanced diagnostics: Database Insights Advanced is the forward-looking option for longer retention, execution plans, and on-demand analysis after the Performance Insights transition.
Amazon CloudWatch Logs for RDS
RDS gives you access to four log types: error logs, slow query logs, general logs, and audit logs. You can read them in the RDS console or pull them via the CLI, but the more useful setup is streaming them into CloudWatch Logs.
Once they are there, you can keep them as long as you need, set alerts on specific patterns (a deadlock error appearing, for example), and wire them into Lambda functions for automated responses. A slow query log sitting in CloudWatch Logs that triggers an alert is far more useful than one you remember to check manually once a week.
Database Activity Streams
Database Activity Streams provide a near-real-time stream of database activity for security monitoring and compliance auditing. All activity is encrypted using AWS Key Management Service (AWS KMS) and can be integrated with third-party security tools. Use cases include detecting and investigating unauthorized access, maintaining compliance by auditing SQL commands, and monitoring administrative actions.
Amazon DevOps Guru for RDS
DevOps Guru is a separate AWS service that continuously monitors RDS telemetry and uses machine learning to detect anomalous patterns across all registered resources. When it detects an anomaly connected to database performance, it automatically generates a detailed database deep-dive report, highlighting the nature of the issue, its severity, the top contributing SQL statements, and recommended next steps.
AWS CloudTrail
CloudTrail logs all API calls made to RDS via the console, CLI, or SDK. This is essential for auditing configuration changes: who modified a parameter group, who deleted a read replica, or who changed a security group. Integrating CloudTrail logs with an alerting pipeline helps catch human errors and unauthorized changes before they cause outages.
Looking for a broader comparison of RDS monitoring tools beyond the native AWS stack? Our guide reviews the best options across open source, commercial, and hybrid setups.
Read the Full GuideAWS RDS Monitoring Best Practices
AWS Prescriptive Guidance makes this the first recommendation. Define what success looks like for your database: what is the acceptable query latency? What is the maximum tolerable replica lag? What connection count triggers an alert? Document this upfront so alerts are meaningful from day one.
A database does not behave the same way all day. Morning traffic, weekday traffic, month-end reporting, batch jobs, and sales campaigns can all create very different patterns.
That is why baselines matter. You need to know what normal looks like before you can tell what abnormal looks like.
Do not alert only because a metric crosses a fixed number. Compare current behavior with past behavior. A CPU spike during a planned batch job may be fine. The same spike during normal user traffic may be a problem.
CloudWatch Database Insights helps you see what is actually putting load on the database. Instead of only seeing that CPU is high, you can check which SQL statements, waits, users, or hosts are contributing to the problem.
For production systems, use Database Insights as the main AWS-native SQL-level troubleshooting layer. Standard mode is useful for recent performance visibility. If you need longer history, execution plans, or on-demand analysis after June 30, 2026, plan for Database Insights Advanced.
CloudWatch gives you the basic RDS metrics, but 1-minute granularity can miss short spikes. That matters for busy workloads, batch-heavy systems, and applications where a few bad seconds can still hurt users.
Enhanced Monitoring gives you a closer look at the operating system behind the DB instance. For most production databases, 10- or 15-second granularity is a practical starting point. Use 1-second monitoring only when you truly need that level of detail.
Start with the metrics that usually lead to real user pain. The critical metrics include:
- FreeStorageSpace: Alert when storage drops near your safe limit.
- CPUUtilization: Alert when CPU stays high for several minutes.
- DatabaseConnections: Alert when connections get close to the instance limit.
- ReplicaLag: Alert when lag exceeds what your app can tolerate.
- FreeableMemory: Alert when available memory stays too low.
The goal is not to alert on everything. The goal is to catch the few signals that warn you before users start seeing failed transactions, slow dashboards, or API timeouts.
Amazon RDS publishes event notifications when instance state changes occur. Subscribe to at minimum:
- Failover events for Multi-AZ instances.
- Failure events.
- Low storage events.
- Recovery events.
- Maintenance window events.
The slow query log is not turned on by default, but it is one of the easiest ways to find queries that are quietly hurting performance.
Enable it and set long_query_time based on how your application behaves, not on a random default. A query that takes two seconds may be fine for a background report, but terrible for a checkout flow or user-facing API.
Review slow queries regularly in CloudWatch Database Insights where supported, and send database logs to CloudWatch Logs for alerting, search, and longer-term analysis.
Understand whether your workload is read-heavy or write-heavy. For read-heavy workloads, consider adding read replicas, indexes, materialized views, or upstream caches. For write-heavy workloads, look at removing slow indexes, reducing lock contention, and investigating asynchronous replication options.
AWS has been moving RDS performance visibility into CloudWatch Database Insights, so teams can connect database load, CloudWatch metrics, Enhanced Monitoring data, and database diagnostics from a more central place.
That matters during an incident. When an API slows down or a dashboard stops loading, engineers should not have to jump between several consoles just to understand what changed. Use the unified view to connect database load, system metrics, and query behavior faster.
Set up CloudTrail to capture all RDS API activity and route events to CloudWatch Logs or an S3 bucket for retention. Create alerts for high-impact events such as security group modifications, parameter group changes, and instance deletions. Human error is a documented cause of database outages, and CloudTrail is the audit trail that helps you diagnose and prevent it.
Monitoring for Availability, Performance, and Cost
Availability Monitoring
Availability is the first concern in any database monitoring strategy. Your monitoring setup should tell you immediately when an instance is unavailable, when a Multi-AZ failover has occurred, and when maintenance windows may cause brief disruptions. All RDS databases include weekly maintenance windows for patches and security updates. Most maintenance completes with minimal impact, but some updates require a Multi-AZ failover, and any upgrade could potentially cause an unexpected outage. Review RDS event logs and the RDS console after maintenance windows to confirm clean completion.
Performance Monitoring
Performance monitoring focuses on ensuring queries execute within acceptable latency bounds and resources are efficiently utilized. Performance degrades progressively: it rarely fails catastrophically all at once. Key early warning signals include gradually increasing read and write latency, a growing number of active sessions in CloudWatch Database Insights, rising CPU utilization without a corresponding increase in throughput, and escalating replica lag.
CloudWatch Database Insights captures this degradation at the SQL level. By visualizing database load and breaking it down by wait event type, teams can see whether a performance problem is caused by I/O pressure, CPU saturation, lock contention, or commit latency.
Cost Management
AWS RDS costs are driven primarily by instance type, storage provisioned, IOPS, data transfer, and the number of read replicas. Monitoring enables cost optimization in several ways:
- CloudWatch Database Insights can help show when an instance is oversized. For example, if DB Load stays far below the available vCPUs, you may be paying for more capacity than the workload needs.
- Storage trends are also useful. Instead of adding extra storage too early, you can watch growth over time and provision based on real usage.
- Read replica metrics help you decide whether replicas are actually helping. If a replica is barely used, it may be safe to remove. If reads are overloading the primary, a replica may be worth adding.
- It also helps to set cost alerts in AWS Budgets. This can catch sudden spending jumps caused by misconfigured storage, auto scaling, replicas, or unexpected traffic.
Auditing and Security Monitoring for RDS
Performance is only one side of RDS monitoring. In production, you also need to know who is connecting to the database, what they are doing, and whether any access pattern looks risky.
This matters even more for regulated systems. A strange login pattern, a sudden change in activity, or an unexpected command can point to a security issue long before it becomes a bigger incident.
Database Activity Streams provide a near-real-time, tamper-evident audit trail of all database operations. All stream data is encrypted with AWS KMS before being written, ensuring that even AWS personnel cannot access potentially sensitive activity. Activity streams can be integrated with Amazon Kinesis Data Streams and third-party Security Information and Event Management (SIEM) tools.
For RDS for PostgreSQL and Aurora PostgreSQL, the pgAudit extension provides session-level and object-level audit logging. This covers which objects were accessed, which SQL commands were run, and by which database user. pgAudit logs can be streamed to CloudWatch Logs for centralized analysis.
CloudTrail records every AWS API call against your RDS resources, including CreateDBInstance, ModifyDBInstance, DeleteDBSnapshot, and AuthorizeDBSecurityGroupIngress. This is the control-plane audit trail that complements the data-plane audit provided by Database Activity Streams and pgAudit.
Teams that route developer database access through EC2 jump hosts or proxy layers can layer on query logging at the proxy level. Tools such as ProxySQL (which now supports PostgreSQL) can log every query along with the authenticating user and timestamp, creating an audit trail at the network layer that does not depend on database-level audit extensions. This approach is particularly useful when developers need to connect to private RDS instances inside a VPC.
Third-Party and Open-Source RDS Monitoring Tools
CubeAPM
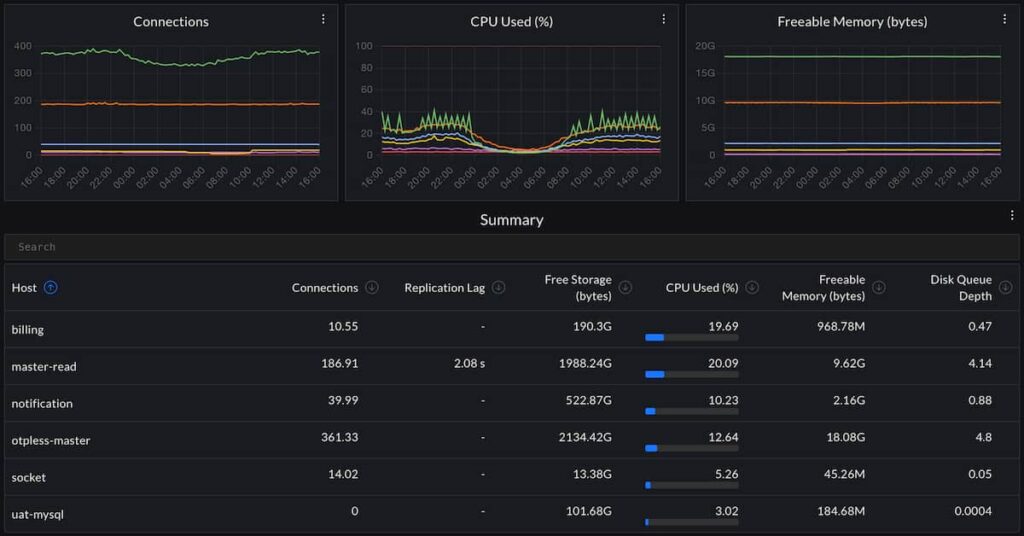
CloudWatch tells you read latency is high. CubeAPM tells you which API endpoint is causing it, which users are feeling it, and what the request path looks like from browser to database. It pulls in CloudWatch metrics, Enhanced Monitoring data, and slow query logs, then layers application traces on top. Instead of jumping between five consoles during an incident, your team works from one view with the full context already connected.
Other Notable Monitoring Solutions
Several well-established third-party tools also offer RDS monitoring capabilities:
- SolarWinds Database Performance Analyzer (DPA): Uses a wait-based analysis approach, similar in philosophy but with broader database support: Oracle, SQL Server, PostgreSQL, MySQL, MariaDB, Aurora, and standard RDS. It runs 24/7, surfaces query-level blocking analysis, and uses machine learning to flag anomalies before they turn into incidents.
- Dynatrace: Dynatrace pulls user experience, application performance, CloudWatch metrics, network data, and logs into one place. The part that saves real time is the AI layer: it maps your infrastructure automatically and surfaces anomalies on its own, so you are not spending hours configuring thresholds for every metric on every instance.
- ManageEngine Applications Manager: Discovers your RDS instances automatically and gets monitoring running with minimal configuration. CPU, disk, and connection counts are tracked out of the box, with alerting and reporting that does not require a dedicated observability engineer to maintain.
- IBM Instana: After deployment, Instana maps your entire infrastructure automatically and tracks how each component interacts with the others. For RDS specifically it monitors call rates, latency, error rates, and instance health in real time.
- Splunk Infrastructure Monitoring: Aggregates CloudWatch metrics alongside metrics from other AWS services, open-source middleware, and on-premises systems. It provides out-of-the-box dashboards, built-in detectors, calculated fields, and outlier detection.
A Step-by-Step AWS RDS Monitoring Setup
Use this checklist when instrumenting a new RDS instance or auditing an existing one.
Open the RDS console, select your instance, and check the Monitoring tab. You should see CPUUtilization, DatabaseConnections, FreeStorageSpace, ReadLatency, and WriteLatency coming in. These push automatically every minute at no extra cost. If they are not showing up, something is misconfigured at the IAM or VPC level.
Go to Modify, expand Additional configuration, and enable Enhanced Monitoring. Assign the rds-monitoring-role IAM role and pick a granularity. Ten seconds works well for most production workloads. Drop to 1 second only if you are actively debugging a sub-minute performance problem, since it significantly increases CloudWatch Logs volume.
Check whether CloudWatch Database Insights is enabled for your production RDS and Aurora databases. Use Standard mode for basic recent performance visibility. Use Advanced mode if you need longer retention, execution plans, on-demand analysis, or deeper troubleshooting features after the Performance Insights transition.
This is off by default and frequently left that way. Go into the parameter group and set slow_query_log = 1 for MySQL or MariaDB, or log_min_duration_statement for PostgreSQL. Pick a threshold that matches your application’s latency tolerance and stream the output to CloudWatch Logs.
Four alarms every production instance needs: CPUUtilization above 80%, FreeStorageSpace below 20% of provisioned, DatabaseConnections above 90% of the instance class limit, and ReplicaLag above whatever your application can tolerate. Add anomaly detection alarms for metrics that fluctuate predictably by time of day.
In the console, go to Event subscriptions and set up alerts for Failover, Failure, Low storage, and Recovery events. Route them to an SNS topic that feeds your on-call system. These are the events that need a human response within minutes.
Make sure CloudTrail is logging RDS API calls in every region where you run instances. Route those events into CloudWatch Logs so you get real-time alerts on configuration changes like security group modifications or parameter group edits. Human error causes a surprising number of database incidents.
Block time once a month to go through slow query logs, check that alarms are still calibrated correctly, and compare current performance baselines against the previous month. Use CLoudWatch Insights to spot any new SQL statements that have quietly become top resource consumers since the last review.
Common AWS RDS Monitoring Mistakes to Avoid
- Treating CloudWatch as the whole solution CloudWatch is the starting point, not the finish line. On any production database that matters, CloudWatch Insights and Enhanced Monitoring are not optional extras. They are what turn a vague “something is slow” into a specific query on a specific instance with a specific wait event.
- Using only static thresholds A static CPU alarm set at 80% will fire every night during your batch job and get ignored. Eventually it will fire during a real incident and get ignored then too. Use CloudWatch Anomaly Detection for metrics with predictable patterns so your alarms mean something when they go off.
- Leaving the slow query log disabled It ships disabled and most teams never turn it on. That is a mistake. The slow query log is the most direct signal you have for SQL-level performance problems, and it costs almost nothing to enable and stream to CloudWatch Logs.
- Not monitoring read replicas independently A replica can be lagging hours behind the primary while the primary looks completely healthy. Users hitting that replica are reading stale data and you will not know unless you have separate alarms on ReplicaLag and replica CPU for each replica individually.
- No storage alarm until it is too late Storage exhaustion is one of the most common and most avoidable RDS outages. When FreeStorageSpace hits zero, writes stop immediately. Set an alarm at 20% remaining and treat it seriously when it fires.
- Adding third-party tools before you need them Start with what AWS gives you. It covers the majority of what most teams actually need. Bring in a third-party tool when you have identified a specific gap, not because it looks good on an architecture diagram.
Conclusion
RDS monitoring is three jobs at once: CloudWatch for instance-level visibility, Enhanced Monitoring for OS-level granularity, and CloudWatch Insights for SQL-level diagnostics. Skip any one layer and you will eventually spend hours debugging a problem that the right tool would have surfaced in minutes.
Start with the native AWS stack. It covers most of what production databases actually need. When you hit the edges of what it can do, tools like CubeAPM extend that visibility into the application layer without replacing the foundation.
You cannot fix what you cannot see. In database operations, the cost of not seeing is always measured in downtime.
This guide reflects AWS RDS documentation, AWS Prescriptive Guidance, and publicly available product information as of 2026. AWS services and pricing change frequently. Always verify current feature availability, limits, and costs in the official AWS documentation before making architectural or purchasing decisions.
FAQs
1. What is AWS RDS Enhanced Monitoring?
Enhanced Monitoring is a feature that captures metrics in real time for the operating system running on your Amazon RDS DB instance. It provides up to 1-second granularity for CPU, memory, Amazon RDS and OS processes, file system, and disk I/O data. It is distinct from CloudWatch, which collects hypervisor-level metrics at 1-minute intervals.
2. How much does RDS Enhanced Monitoring cost?
Enhanced Monitoring itself has no direct cost. However, it writes metric data to CloudWatch Logs, which incurs standard CloudWatch Logs data transfer and storage charges once you exceed the free tier (5 GB per month). At 1-second granularity, approximately 16.07 GB per instance per month is ingested. At 60-second granularity, this drops to approximately 0.27 GB.
3. What is DB Load in CloudWatch Database Insights?
DB Load measures active work inside the database, usually shown as average active sessions. It helps you understand whether the database is waiting on CPU, I/O, locks, commits, or other bottlenecks. When DB Load stays above the available vCPU capacity, the database usually needs query tuning, index changes, workload changes, or scaling.
4. What is the difference between CloudWatch and CloudWatch Database Insights?
CloudWatch monitors infrastructure-level metrics such as CPU, storage, network, connections, and read/write latency. CloudWatch Database Insights focuses on database engine behavior, including DB Load, wait events, SQL activity, and database performance diagnostics. CloudWatch shows that something is under pressure; Database Insights helps explain what inside the database is causing it.
5. What are the most important RDS CloudWatch metrics?
The most consistently important metrics are CPUUtilization, DatabaseConnections, FreeStorageSpace, ReadLatency, WriteLatency, FreeableMemory, and ReplicaLag. Set CloudWatch Alarms on all of these for every production instance.