Docker is powering the modern stack, with 61% of organizations running containers in production by 2024. As adoption grows, monitoring Docker environments has become mission-critical. DevOps teams are now seeking Docker-native observability solutions that deliver better cost efficiency, performance, and control.
CubeAPM is designed for Docker from the ground up. It ingests OpenTelemetry data from Dockerized services and correlates logs, traces, and metrics while applying smart sampling to reduce noise without losing critical insights.
In this article, we’ll explore the 8 best Docker monitoring tools, comparing features, pricing, and use cases to help you choose the right fit for your containerized workloads.
Best Docker Monitoring Tools
1. CubeAPM – Best overall for Docker-native observability and cost efficiency
2. Datadog – Popular enterprise-grade container monitoring
3. New Relic – Full-stack observability with Docker dashboards
4. Dynatrace – AI-powered monitoring with deep root-cause analysis
5. Prometheus + Grafana – Open-source metrics and visualization stack
6. SigNoz – OpenTelemetry-native, self-hosted observability platform
7. Sematext – SaaS-based Docker and Kubernetes monitoring
8. Zabbix – Traditional infra monitoring with Docker support
What is Docker Monitoring?
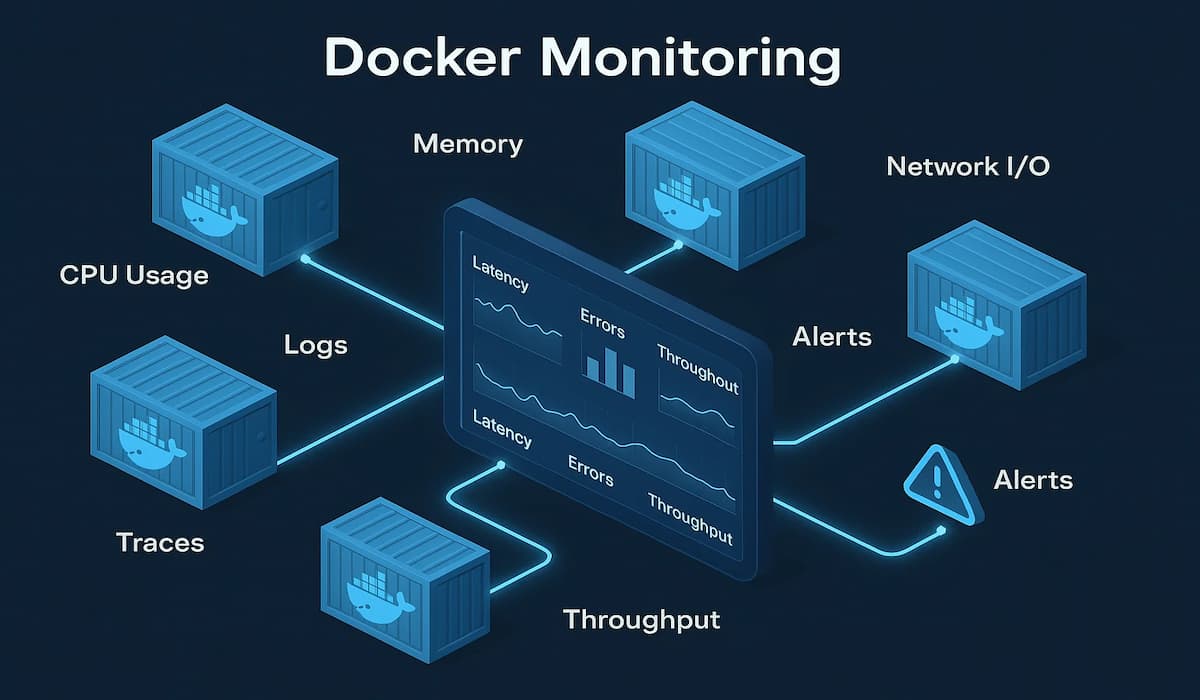
Docker monitoring is the process of tracking the health, performance, and resource usage of containers running in a Docker environment. Unlike traditional servers, containers are lightweight, short-lived, and highly dynamic—they can start, stop, and scale within seconds. This makes visibility a challenge, as logs, metrics, and traces are constantly changing with container lifecycles.
Effective Docker monitoring covers the full MELT stack (Metrics, Events, Logs, and Traces):
- Metrics: CPU, memory, network I/O, and error rates show resource usage and performance.
- Logs: Capture output from short-lived containers before they vanish, essential for debugging.
- Traces: Link containerized microservices to reveal latency, bottlenecks, and failed calls.
- Events: Track restarts, crashes, and image updates to understand reliability and change history.
Why it matters in modern environments:
- Cluster visibility: Critical when Docker is used with orchestrators like Kubernetes or Docker Swarm.
- Cost optimization: Identifies under-utilized or over-provisioned containers for better efficiency.
- Scalability & resilience: Ensures fast troubleshooting and predictable scaling as workloads grow.
Example: How CubeAPM Handles Docker Monitoring
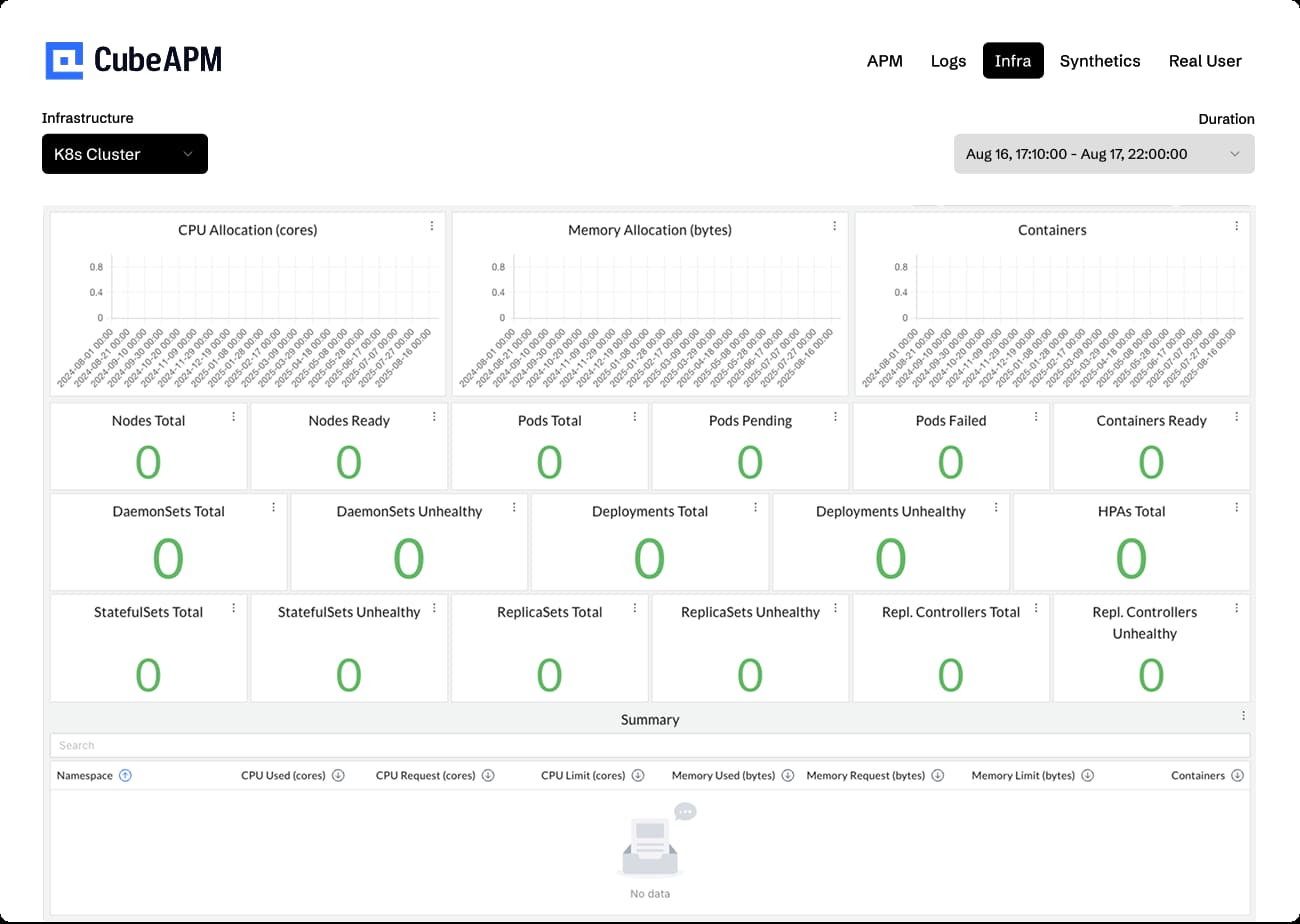
CubeAPM approaches Docker monitoring by embedding observability directly into containerized environments. It can itself run as a Docker container or as a multi-node setup with Docker Compose, which makes it easy to deploy alongside the workloads it monitors.
Once active, CubeAPM automatically receives OpenTelemetry (OTLP) data from Dockerized applications, ensuring metrics, traces, and logs from containers flow seamlessly into a single platform.
Key capabilities CubeAPM brings to Docker monitoring include:
- Container metrics: Tracks CPU, memory, and network I/O usage at both host and container levels.
- Log aggregation: Captures short-lived container logs via Fluent Bit, Vector, or Loki and stores them centrally.
- Trace correlation: Links logs and metrics to distributed traces through shared IDs for precise root cause analysis.
- Smart sampling: Prioritizes traces from slow or error-prone containers while filtering out noise.
- Deployment flexibility: Supports single-node or multi-node Compose setups, with on-prem hosting for compliance.
- Compatibility: Works seamlessly with OpenTelemetry, Prometheus, and even Datadog/New Relic agents for migration ease.
Together, these capabilities make CubeAPM a Docker-native monitoring solution that simplifies observability, reduces costs, and ensures teams maintain full visibility across fast-changing container environments.
Why Teams Choose Different Docker Monitoring Tools
1. Pricing model & budget predictability
Vendors price telemetry very differently. Datadog combines per-GB ingest with per-host APM and separate log indexing fees, which can make costs unpredictable at scale. New Relic provides 100 GB free, then charges per GB with additional user-based fees. CubeAPM stands out with its flat $0.15/GB pricing — just $1,500/month for 10 TB — giving teams predictable spend without hidden fees.
2. OpenTelemetry standardization & portability
OpenTelemetry has become the de facto standard for instrumentation. Teams increasingly prefer solutions that natively support OTEL, ensuring vendor neutrality and future-proofing. This flexibility allows switching tools without reinstrumenting every service.
3. Depth of container and Kubernetes visibility
Some teams prioritize advanced container awareness. Dynatrace, for example, offers automated service maps and root-cause analysis across Docker and Kubernetes workloads. Grafana Cloud provides managed traces, logs, and metrics with Kubernetes add-ons for deeper insights into clusters.
4. Retention & storage economics
Retention policies significantly impact cost. Grafana Cloud and Dynatrace charge for long-term log and trace storage, while Datadog separates log ingestion from indexed retention.CubeAPM includes flexible retention options with transparent per-GB pricing, making it feasible to store months of Docker telemetry without cost surprises.
5. Feature focus: metrics-first vs. full MELT
Some tools only deliver container metrics, forcing teams to stitch together separate log and tracing tools. CubeAPM consolidates metrics, events, logs, and traces (MELT) in one platform. For Docker monitoring, this means CPU spikes, error logs, and slow traces are correlated in real time, enabling faster fixes.
6. Special workflows & UI fit
For many engineers, the interface itself is decisive. Some tools provide curated dashboards, service maps, or Docker-specific explorers that speed up troubleshooting. Teams choose based on which UI accelerates their daily workflows.
Top 8 Docker Monitoring Tools
1. CubeAPM

Known for
CubeAPM is recognized for delivering Docker-native observability with transparent pricing. It provides full MELT coverage—metrics, events, logs, and traces—at a flat $0.15/GB, making it far more predictable than host-based or retention-driven models. Its support for on-premise hosting, OpenTelemetry compatibility, and 800+ integrations positions.
Docker Monitoring Features
- Deployable as a Docker container or Docker Compose cluster.
- Automatic container discovery with minimal setup.
- Captures short-lived container logs before they disappear.
- Correlates container events, metrics, and traces for faster RCA.
Key Features
- Full-stack MELT observability in one platform.
- Smart sampling to reduce noise and preserve critical data.
- Distributed tracing with detailed waterfall views.
- Error tracking with an errors inbox.
- Synthetic and real user monitoring for end-to-end coverage.
Pros
- Flat and transparent pricing, no host or container limits.
- Self-hosting option ensures compliance and data residency control.
- Seamless OpenTelemetry compatibility.
- Significant savings compared to Datadog and New Relic at scale.
Cons
- Not suited for teams looking for off-prem solutions
- Strictly an observability platform and does not support cloud security management
Pricing
- Predictable pricing of $0.15/GB
CubeAPM Docker Monitoring Pricing at Scale
*All pricing comparisons are calculated using standardized Small/Medium/Large team profiles defined in our internal benchmarking sheet, based on fixed log, metrics, trace, and retention assumptions. Actual pricing may vary by usage, region, and plan structure. Please confirm current pricing with each vendor.
For a mid-sized SaaS company ingesting 45TB(~45,000) total monthly data ingestion and 45,000TB of observability data outcharged by the cloud provider, the total cost will be about ~$7200/month.
Tech Fit
CubeAPM is an excellent fit for organizations running large-scale Docker workloads that demand both cost control and compliance. Its self-hosting flexibility allows data to remain within enterprise boundaries, while its flat pricing ensures stable budgets even as telemetry grows. For teams standardizing on OpenTelemetry or seeking to escape the unpredictability of legacy pricing, CubeAPM offers a scalable, future-proof solution.
2. Datadog
Known for
Datadog is one of the most widely used observability platforms, recognized for its broad feature set and 900+ integrations. It is often chosen by enterprises for its ability to unify infrastructure monitoring, APM, log management, and security into a single solution.
Docker Monitoring Features
- Provides out-of-the-box Docker container monitoring with automatic discovery.
- Container-aware dashboards track CPU, memory, disk I/O, and network metrics.
- Integrates logs, traces, and metrics from containers for unified observability.
- Supports Docker Swarm and Kubernetes orchestration for containerized environments.
Key Features
- APM with distributed tracing and service maps.
- Log management with centralized aggregation and flexible retention.
- Infrastructure monitoring with 900+ built-in integrations.
- RUM and synthetic monitoring for end-user experience.
- Security monitoring for container and cloud workloads.
Pros
- Mature platform with wide adoption and strong enterprise credibility.
- Rich ecosystem of integrations across cloud, databases, and infrastructure.
- Provides deep visibility into Docker and Kubernetes workloads.
- Advanced features like anomaly detection and AI-driven alerts.
Cons
- Costs rise quickly with high data volumes and container scale.
- Complex, usage-based pricing model is hard to predict.
- Retention limits and add-on charges.
Pricing
Datadog pricing is modular and varies by product:
- APM (Pro Plan): $35/host/month
- Infra (Pro Plan): $15/host/month
- Ingested Logs: $0.10 per ingested or scanned GB per month
Datadog Docker Monitoring Pricing at Scale
For a mid-sized SaaS company operating 125 APM hosts, 40 profiled hosts, 100 profiled container hosts, 200 infrastructure hosts, 1.5 million container hours, 300,000 custom metrics, 500 million indexed spans, and 3,500 indexed logs, while ingesting approximately 10 TB (≈10,000 GB) of logs per month, the estimated monthly cost would be around $27,475.
Tech Fit
Datadog is best suited for large enterprises already invested in its ecosystem and willing to pay a premium for its broad feature set. It is a strong choice where integrations and feature depth outweigh cost concerns, but for container-heavy environments with high data ingestion, the unpredictability of pricing often becomes a major drawback.
3. New Relic
Known for
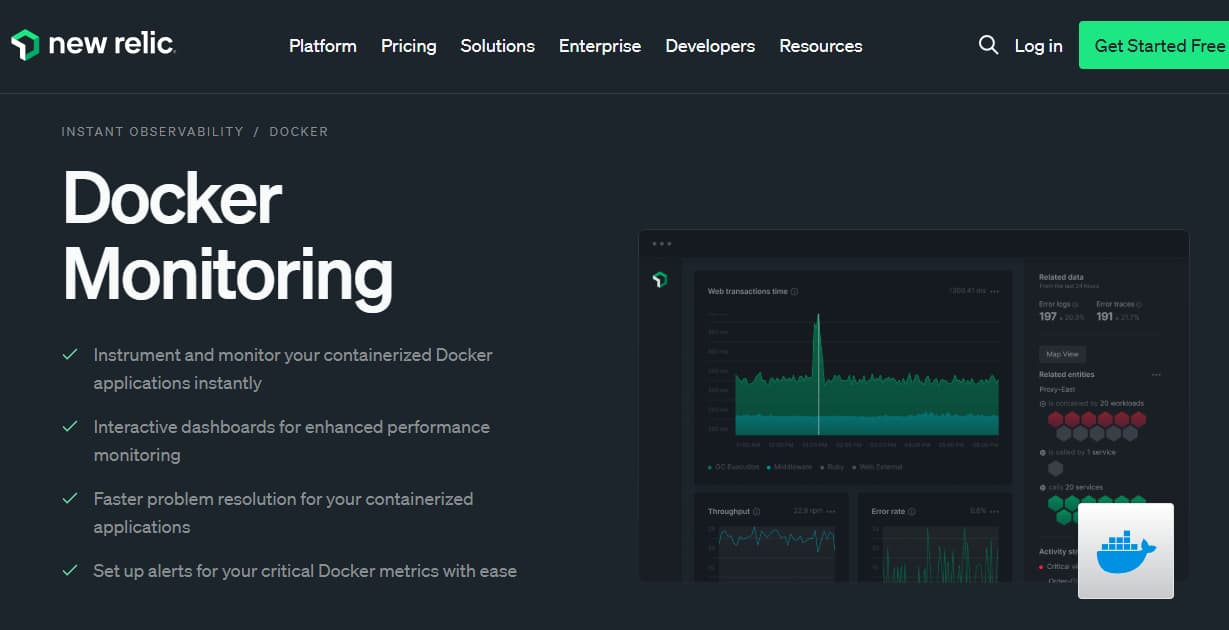
New Relic is a long-standing player in the observability market, known for unifying APM, infrastructure monitoring, logs, and digital experience monitoring into a single SaaS platform. Its modern interface, advanced analytics, and curated dashboards make it popular among DevOps and SRE teams.
Docker Monitoring Features
- Provides automatic container discovery and monitoring for Docker workloads.
- Tracks CPU, memory, disk, and network performance at the container level.
- Container Explorer allows real-time visibility into Dockerized services.
- Integrates logs, metrics, and traces from containerized microservices.
Key Features
- APM with distributed tracing and service maps.
- Log management with flexible retention policies.
- Infrastructure monitoring with deep container and Kubernetes visibility.
- Real User Monitoring and browser performance tracking.
- Synthetic monitoring for proactive testing.
Pros
- Modern, user-friendly interface with curated dashboards.
- Unified observability platform covering APM, infra, logs, and RUM.
- Strong ecosystem of integrations.
- Container Explorer designed specifically for Docker and Kubernetes.
Cons
- User-based pricing model can become expensive as teams grow.
- Additional fees for longer data retention and advanced analytics.
- Complex billing that is difficult to predict for high-ingestion workloads.
Pricing
New Relic pricing is largely based on users and data ingestion:
- Free Tier: 100GB/month ingested
- Data ingestion: $0.40 per GB depending on plan.
- Full platform users: $349/user/month (higher tiers for enterprises).
New Relic Docker Monitoring Pricing at Scale
A mid-sized SaaS company ingesting 45TB (~45,000 GB) of telemetry data per month and with 10 full users, the cost would come around ~$25,990/month.
Tech Fit
New Relic is well-suited for teams that want a polished, all-in-one observability solution with strong dashboards and container-specific features. It works best for enterprises that prioritize user experience and advanced analytics over strict cost control. However, for Docker-heavy environments generating terabytes of telemetry, its licensing and retention pricing can quickly outweigh the benefits.
4. Dynatrace
Known for
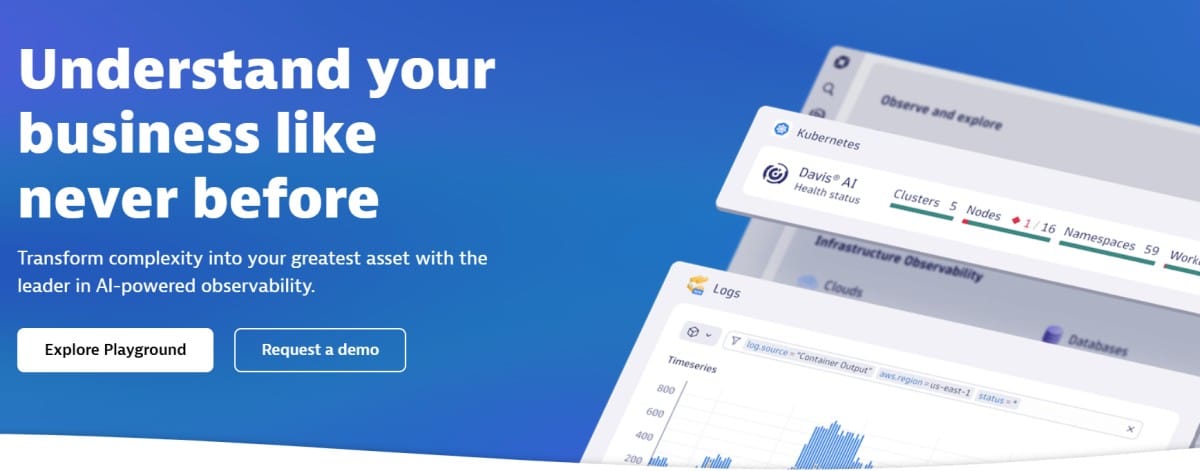
Dynatrace is recognized for its AI-driven observability and automation capabilities. Its Davis AI engine analyzes billions of dependencies to provide root-cause detection and predictive insights, which makes it popular with large enterprises running complex containerized workloads. For Docker monitoring, Dynatrace excels at auto-discovery and deep visibility into containers and microservices.
Docker Monitoring Features
- Automatic discovery and monitoring of Docker containers.
- Tracks CPU, memory, disk, and network usage for containerized workloads.
- Provides topology mapping and service flow visualization for Docker microservices.
- Correlates container events with traces and metrics using Davis AI for root-cause detection.
Key Features
- AI-driven root cause analysis with Davis AI.
- Full-stack APM with distributed tracing.
- Infrastructure and cloud monitoring with auto-discovery.
- Log management with centralized retention.
- Synthetic and real user monitoring.
Pros
- Advanced AI-driven insights reduce troubleshooting time.
- Automatic container and microservice discovery.
- Strong support for enterprise-scale environments.
- Rich feature set covering APM, infra, logs, and digital experience monitoring.
Cons
- Pricing model is complex and often unpredictable.
- Costs rise sharply at high data ingestion volumes.
- Onboarding and setup are more complex.
Pricing
- Infrastructure Monitoring: $29/month per host
- Full-Stack Monitoring: $58/month per 8 GiB host
Dynatrace Docker Monitoring Pricing at Scale
For a mid-sized SaaS company operating 125 APM hosts, 200 infrastructure hosts, ingesting approximately 10 TB (≈10,000 GB) of logs, generating 300,000 custom metrics, consuming 1.5 million container hours, and producing around 45,000 GB of observability data egress (charged by the cloud provider) would incur an estimated monthly cost of approximately $21,850.
Tech Fit
Dynatrace is best suited for large enterprises that value AI-driven insights and automation more than strict cost control. It’s a strong fit for organizations running thousands of containers across hybrid or multi-cloud environments where advanced root-cause detection is critical. However, for midsized teams looking for predictable pricing, Dynatrace’s complexity and higher costs may outweigh its advantages.
5. Prometheus + Grafana
Known for
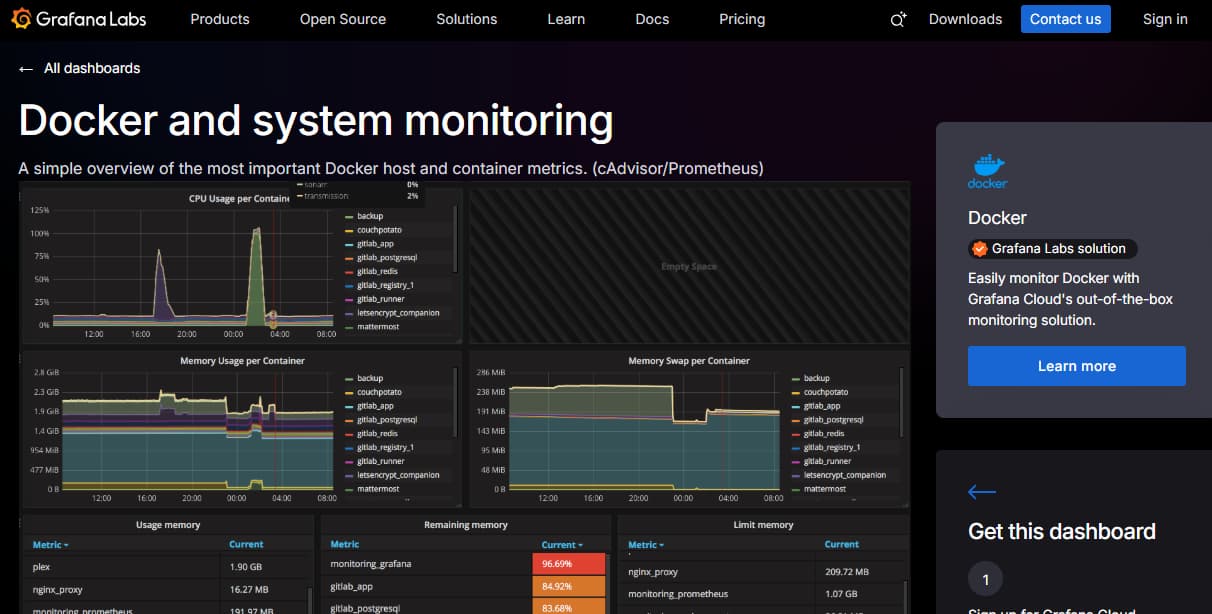
Prometheus and Grafana together form the most popular open-source monitoring stack for containerized environments. Prometheus handles metrics scraping and alerting, while Grafana provides rich visualization and dashboarding. Many organizations adopt this stack to monitor Docker and Kubernetes clusters without the licensing costs of commercial tools.
Docker Monitoring Features
- Prometheus scrapes metrics from Docker containers and hosts via exporters.
- Grafana provides dashboards for container metrics such as CPU, memory, and network usage.
- Integrates with cAdvisor and node exporters for Docker visibility.
- Supports alerting rules for container events and health thresholds.
Key Features
- Powerful metrics-based monitoring with PromQL queries.
- Flexible dashboards and visualization through Grafana.
- Alertmanager for notifications and automated responses.
- Large open-source community with many prebuilt exporters.
- Can integrate with logs/traces via additional tools (e.g., Loki, Tempo).
Pros
- Open-source, no direct licensing costs.
- Extremely flexible and customizable.
- Large ecosystem of exporters and community dashboards.
- Strong adoption across cloud-native environments.
Cons
- High operational overhead (scaling Prometheus requires sharding/federation).
- Long-term storage is challenging without third-party add-ons (e.g., Thanos, Cortex).
Pricing
- Prometheus + Grafana OSS: Free to use, but requires infrastructure and ops.
- Metrics: $0.05 per series/month.
- Logs: $0.50 per GB ingested.
- Traces: $0.50 per GB ingested.
Prometheus + Grafana Docker Monitoring Pricing at Scale
For a mid-sized company operating 125 APM hosts, 200 infra hosts, 10TB(~10,000 GB) of ingested logs, and 45,000GB of observability data out(charged by cloud provider), the cost would come around ~$11,875/month.
Tech Fit
Prometheus + Grafana is best suited for teams with strong DevOps expertise that value flexibility and control over turnkey simplicity. It’s an excellent fit for open-source adopters and organizations already invested in Kubernetes. However, the operational overhead makes it less ideal for midsized companies that want predictable costs and enterprise support.
6. SigNoz
Known for
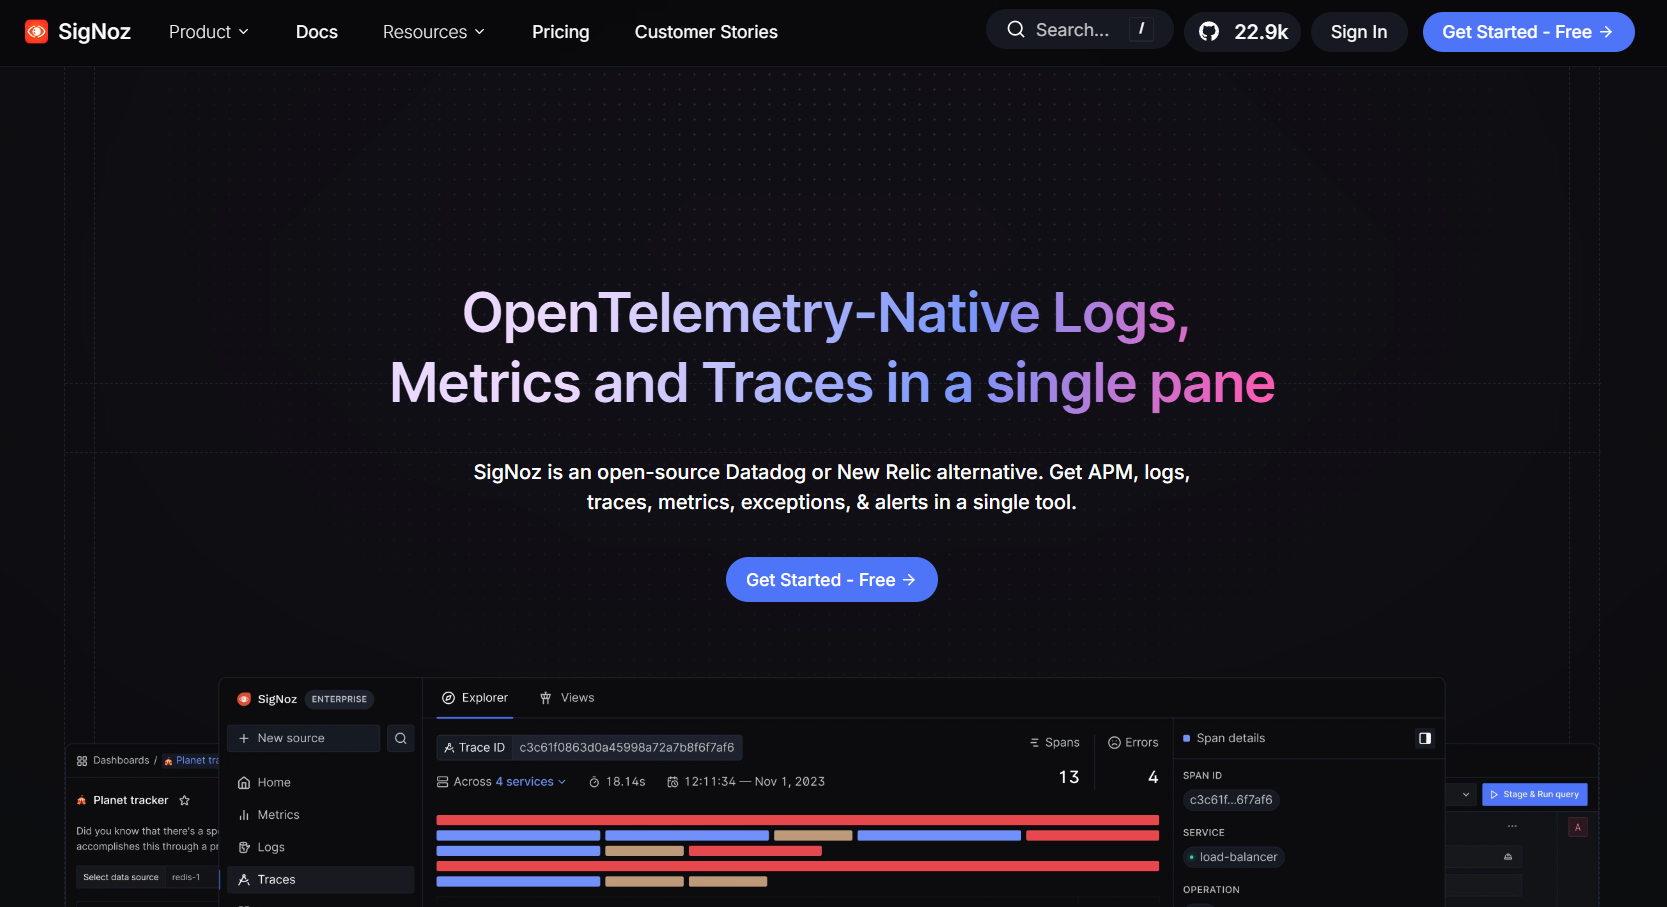
SigNoz is an open-source observability platform built on OpenTelemetry (OTEL). It’s designed as a self-hosted or managed alternative to Datadog and New Relic, offering logs, metrics, and traces in a single dashboard. For Docker environments, SigNoz offers container-level monitoring without vendor lock-in, making it attractive to engineering teams who prefer open-source flexibility with lower cost compared to incumbents.
Docker Monitoring Features
- Collects Docker container metrics through the OpenTelemetry Collector.
- Provides dashboards for container CPU, memory, and resource usage.
- Traces containerized microservices with OTEL-native support.
- Centralizes logs from Docker workloads with contextual correlation.
Key Features
- OTEL-native metrics, logs, and traces in one stack.
- Self-hosted or SaaS-based managed service.
- Service maps and distributed tracing for microservices.
- Dashboards and alerts for Docker/Kubernetes clusters.
- Community-driven open-source development.
Pros
- Transparent and lower pricing than most commercial tools.
- OpenTelemetry-native, no vendor lock-in.
- Self-hosted option supports compliance requirements.
- Active open-source community.
Cons
- Managing ClickHouse memory usage is time-consuming
- Operational complexity, especially for managing the stacks
- The UI, while functional, might feel cluttered
Pricing
SigNoz offers both self-hosted (free, infra costs only) and managed SaaS pricing:
- Logs: $0.3 per GB ingested.
- Traces: 0.3 per GB.
- Metrics:$0.1/mil samples
SigNoz Docker Monitoring Pricing at Scale
For a mid-sized SaaS company that ingests 25,000GB of data by APM hosts, 10,000GB of data by infra hosts, 10,000GB of data by log hosts, and 45,000GB of observability data out(charged by cloud provider), the cost would be around ~$16,000.
Tech Fit
SigNoz is best suited for engineering-driven teams that value open-source control, cost transparency, and OpenTelemetry-native design. It’s a strong fit for companies that want to self-host Docker monitoring while keeping budgets below commercial vendors. However, midsized enterprises seeking enterprise-ready support and predictable costs may still find CubeAPM more practical.
7. Sematext
Known for
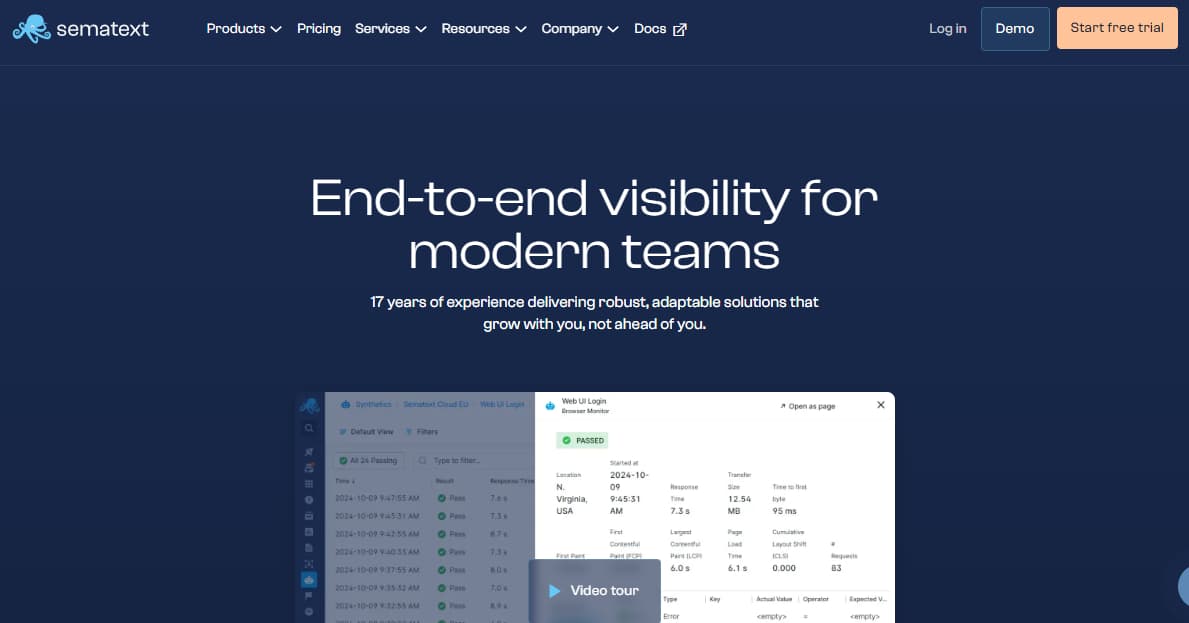
Sematext is known for being a developer-friendly observability platform that combines log management, infrastructure monitoring, real user monitoring, and synthetic testing in one SaaS product. It has a strong focus on ease of use and quick setup, making it attractive to small and midsized teams. For Docker, Sematext offers container-native visibility through lightweight agents and integrations, though costs can add up quickly due to per-GB pricing for logs and metrics.
Docker Monitoring Features
- Docker agent collects container metrics, logs, and events.
- Out-of-the-box dashboards for Docker CPU, memory, disk, and network usage.
- Log aggregation with contextual search and filtering for container logs.
- Alerting and anomaly detection on Docker events and metrics.
Key Features
- Centralized log management with full-text search.
- Infrastructure monitoring with Docker and Kubernetes support.
- Real User Monitoring (RUM) for frontend performance.
- Synthetic monitoring for uptime and availability checks.
- Integrated alerts with Slack, PagerDuty, and more.
Pros
- Easy to set up with minimal configuration.
- Unified platform covering logs, infra, RUM, and synthetics.
- Affordable entry pricing for small teams.
- Good out-of-the-box dashboards for containers.
Cons
- Per-GB log pricing becomes expensive at higher volumes.
- Retention and advanced features often locked behind higher tiers.
Pricing
From Sematext’s pricing model (Pro tier):
- Infrastructure Monitoring (Pro): $7.20 per host/month (30 days retention).
- Service Monitoring (Pro): $25.20 per agent/month (30 days retention).
- Log Management (Pro)
- Ingest: $0.10/GB
- Storage/Retention: $2.55/GB/month (30 days retention).
Sematext Docker Monitoring Pricing at Scale
For a midsized company ingesting 10 TB (10,000 GB) of Docker logs per month, Sematext Pro would cost about $1,000 for ingestion (10,000 × $0.10). If 20% of logs are stored with 30-day retention, that adds $5,100 (2,000 × $2.55). Infrastructure monitoring for 50 hosts adds $360, and service monitoring for 50 agents adds $1,260. Altogether, the monthly bill would land around $7,700.
Tech Fit
Sematext is best for small to midsized teams who want fast, out-of-the-box Docker monitoring and don’t mind paying more as their data volumes scale. It works well for startups and SaaS businesses that value quick onboarding and integrated RUM and synthetics, but its per-GB pricing makes it a costly option for teams handling large telemetry volumes from container-heavy environments.
8. Zabbix
Known for
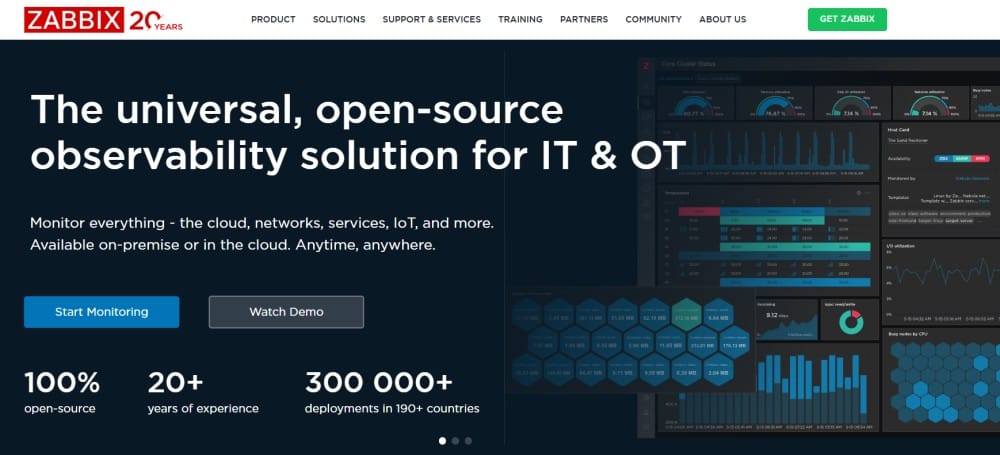
Zabbix is an established open-source infrastructure monitoring tool that has been around for over two decades. It is widely used for monitoring servers, networks, and applications across enterprise environments. With Docker, Zabbix provides official templates and integrations that make it possible to monitor container health, resource consumption, and events. While the software itself is free, the real cost comes from infrastructure, database storage, and staff time needed to manage and scale it.
Docker Monitoring Features
- Official Zabbix templates for Docker monitoring.
- Tracks container CPU, memory, disk, and network usage.
- Monitors Docker daemon, container states, and uptime.
- Provides alerts and notifications based on container metrics.
Key Features
- Agent-based and agentless monitoring.
- Dashboarding and alerting with flexible rules.
- SNMP, IPMI, JMX, and cloud monitoring integrations.
- Support for monitoring databases, VMs, and network devices.
- Strong community support and open-source ecosystem.
Pros
- 100% open source and free to use.
- Mature and stable with decades of development.
- Broad infrastructure monitoring capabilities.
- Active global community and templates.
Cons
- Steep learning curve with complex configuration.
- Scaling to thousands of containers adds a layer of complexity.
Pricing
- Software: Free and open source.
- Nano: $50/month (50 NVPS, 100 GB storage)
- Micro: $100/month
- Small: $250/month
- Medium: $750/month
- Large: $1,875/month
- XLarge: $2,500/month
- 2XLarge: $5,000/month
Zabbix Docker Monitoring Pricing at Scale
For a mid-sized company monitoring 250 Docker hosts with ~10 TB of telemetry per month, Zabbix Cloud pricing under the Nano plan comes to about $3,047/month. This includes a base compute cost of $50 and roughly $2,997 for 10 TB of storage.
Tech Fit
Zabbix is best suited for organizations that prioritize infrastructure monitoring and already have strong in-house expertise to manage the system. It works well in environments where Docker is part of a broader infrastructure stack, but may not meet the needs of teams looking for full observability across logs and traces.
Conclusion
Docker monitoring is no longer optional as containerized workloads scale across cloud and hybrid environments. Tools like Datadog, New Relic, Dynatrace, Grafana Cloud, SigNoz, Sematext, and Zabbix all offer different approaches, but their costs and complexity rise sharply when handling large telemetry volumes.
CubeAPM delivers a simpler alternative with flat $0.15/GB pricing that keeps costs predictable — just $1,500/month for 10 TB of data — while providing full MELT observability, OpenTelemetry-native ingestion, and Docker-native deployment. For teams seeking enterprise-grade visibility without runaway bills, CubeAPM is the most cost-efficient and future-proof choice for Docker monitoring.
Disclaimer: The information in this article reflects the latest details available at the time of publication and may change as technologies and products evolve.
FAQs
1. What are the best Docker monitoring tools?
CubeAPM is a leading choice thanks to flat pricing and Docker-native deployment. Other common picks include Grafana Cloud or Zabbix for open-source users.
2. Why is Docker monitoring important?
Docker containers are short-lived and highly dynamic, so monitoring ensures visibility into logs, metrics, and traces to prevent downtime and cost overruns.
3. Which Docker monitoring tool is most cost-effective?
CubeAPM offers flat $0.15/GB pricing — about $1,500/month for 10 TB — making it far more predictable and affordable than usage-based models.
4. Can open-source solutions monitor Docker effectively?
Yes, platforms like Zabbix can monitor Docker, but they require significant setup and infrastructure. CubeAPM delivers the same visibility with less effort.
5. What features should I look for in a Docker monitoring solution?
Look for container auto-discovery, real-time metrics, log aggregation, trace correlation, smart sampling, and predictable pricing to manage scale effectively.


