StackState is a modern observability platform that offers advanced features, such as real-time infrastructure monitoring and full MELT (Metrics, Events, Logs, Traces) support. Currently, it has acquired 0.1% of the share in the infrastructure monitoring market.
Yet, many teams report challenges scaling StackState in fast-moving, cloud-native environments. Its complexity, resource-heavy deployment, and less transparent pricing create friction for lean SRE and platform teams.
CubeAPM is the best StackState alternative that provides full OTEL and MELT support, smart sampling to optimize storage, and a lightweight, cost-efficient footprint. With simple pricing, self-hosting options, and fast, quality support, CubeAPM delivers modern observability without vendor lock-in or overhead.
In this article, we’ll cover the top 7 StackState alternatives across key criteria to help you choose the best tool for your observability needs.
Top 7 StackState Alternatives
- CubeAPM
- Datadog
- New Relic
- Dynatrace
- Splunk AppDynamics
- Sentry
- SolarWinds Observability
Why People Are Looking for StackState Alternatives
Pricing Complexity & Cost Escalation
StackState offers a tiered pricing structure, which is not transparent at scale. It’s also prone to a sudden jump in the cost as your deployments increase. The publicly listed rates show the Infrastructure Edition at $20 per node (up to 50 nodes) and the Application Edition at $35 per node (up to 100 nodes). Beyond these thresholds, pricing shifts to custom enterprise quotes, making budgeting unpredictable.
StackState Costing Example for a mid size team:
A mid-size deployment with 75 nodes on the Application Edition would cost:
75 × $35 = $2,625/month, or over $31,000 annually—and that’s before considering any premium features, add-ons, or potential enterprise markups.
The scaling penalty here is significant: crossing from 50 to 75 nodes triggers a 75% increase in per-node cost ($20 → $35), creating an abrupt jump in monthly spend. Combined with the lack of transparent pricing above 100 nodes, organizations face real challenges forecasting long-term observability costs with StackState.
Lack of Native Sampling Control
StackState has no built-in sampling mechanism for traces or metrics, relying entirely on upstream tools to manage data volume. This means teams must configure head-based or tail-based sampling at the collector or agent level, adding extra complexity and making it harder to optimize costs and storage without affecting visibility.
Limited Depth in RUM and Synthetic Monitoring
While StackState supports basic Real User Monitoring and synthetic checks, its capabilities in these areas are relatively shallow compared to specialized APM platforms. RUM is primarily used to feed frontend performance metrics into topology views, lacking advanced UX analytics, heatmaps, or detailed session insights. Synthetic monitoring focuses on simple availability and latency checks rather than complex multi-step transactions, making it less effective for teams needing rich end-user experience simulation.
High Deployment Complexity and Resource Burden
Users report that setting up and tuning numerous topology integrations—especially across hybrid and cloud-native environments—demands significant planning and governance around resource naming and configuration standards. Agile teams or organizations with limited bandwidth for DevOps may find it difficult to maintain StackState’s graph database. Its integration pipelines may also slow down rapid iteration.
Governance and Data Correlation Challenges
StackState combines data sources (metrics, traces, logs, events) into unified topology maps, but this requires disciplined governance. Inconsistent naming conventions across environments often produce misaligned maps or ineffective correlations, making it difficult to derive business context without significant upfront alignment (G2).
Criteria for Selecting StackState Alternatives
1. Transparent, Predictable Pricing
Modern APM platforms must offer clear, usage-based pricing that avoids surprises. StackState’s per-node billing can escalate quickly without easy cost control. Alternatives like CubeAPM offer flat or ingestion-based pricing, allowing teams to forecast and manage observability budgets more confidently.
2. Low Operational Overhead
Solutions that are easy to deploy and manage reduce the burden on DevOps and platform teams. StackState’s topology engine and graph models require custom configuration and maintenance. Simpler tools with plug-and-play OTEL support and auto-instrumentation save valuable engineering hours.
3. Full MELT & OTEL Support
Alternatives should support full MELT—Metrics, Events, Logs, and Traces—and be built around OpenTelemetry for maximum future flexibility. StackState offers MELT coverage, but its tight coupling with proprietary topology modeling can limit extensibility.
4. Smart Data Retention and Sampling
To control ingestion and storage costs, platforms must offer intelligent sampling and retention policies. CubeAPM, for example, uses smart sampling to retain only high-value traces, reducing storage needs by up to 70% without losing debugging insights.
5. Flexible Deployment
Compliance-heavy industries require options beyond SaaS. StackState supports hybrid models, but many users find self-hosting complex. Strong alternatives should offer hassle-free deployment across cloud, on-premises, or air-gapped environments.
6. Responsive, High-Quality Support
Vendor support is important for your observability needs. Tools with fast, knowledgeable support teams help teams resolve issues quickly. Users report that some StackState support responses can lag, making customer service a key factor in alternative selection.
StackState Overview
Known for
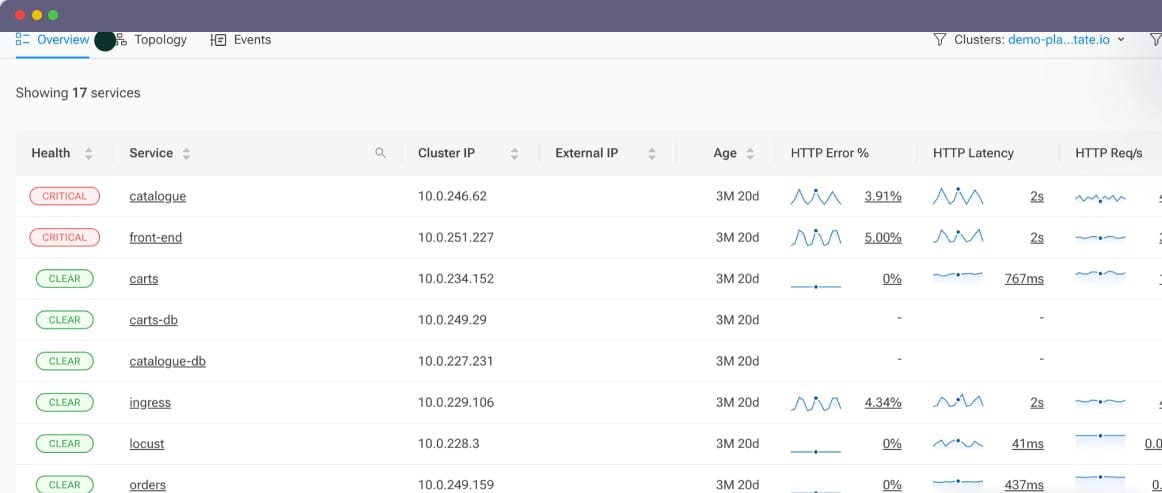
StackState is recognized for its topology-driven, full-stack observability platform that delivers dynamic dependency maps, real‑time change tracking, and unified MELT (Metrics, Events, Logs, Traces) visibility—ideal for organizations managing complex hybrid and cloud-native infrastructures.
Standout Features
- Real-time dependency maps: Auto-discover relationships among services and infrastructure components, mapped dynamically over time.
- Guided remediation: Built-in troubleshooting workflows and visual cues speed up root cause discovery.
- Historical data: View historical topology snapshots to analyze what changed before incidents occurred.
Key Features
- MELT support: Correlates metrics, logs, events, and traces into a single observability view.
- Out-of-the-box dashboards: Preconfigured dashboards and monitors enable rapid deployment and insights.
- Notifications & alerts: Integrates with Slack, Teams, PagerDuty, and others to reduce alert noise and improve response.
- Support for open standards: The platform supports OTEL, eBPF, and SOC, which means extensibility with security.
Pros
- Fast time-to-value via its smart interface
- Extensive integrations
- Powerful visual insights into complex environments through topology-based observability
- Strong customer support and responsiveness to feature requests, including rapid roadmap adjustments
Cons
- Pricing isn’t transparent; enterprise pricing requires contacting StackState sales
- Deployment complexity can be high—custom topology tuning and governance are needed for effective insights
Best for
Organizations managing dynamic, distributed systems across hybrid or cloud-native environments, particularly those needing high‑fidelity topology insights, guided remediation, and unified full-stack observability with an emphasis on context-aware troubleshooting.
Pricing & Customer Reviews
- APM: Starts $35/node
- Infra: Starts $20/node
- Enterprise: Custom
- G2 rating: 4.5/5 (28 reviews)
- Praised for: intuitive interfaces, fast integration, and deep hybrid topology visibility
- Criticized for: non-transparent pricing and complexity in deployment for broad-scale observability setups
Top 7 StackState Alternatives
1. CubeAPM
Known for
CubeAPM is an OpenTelemetry-native observability platform designed to provide deep MELT (Metrics, Events, Logs, Traces) insights with predictable costs and flexible deployment. It’s widely recognized for helping teams capture high-value telemetry efficiently while maintaining data control through SaaS, on-prem, or hybrid hosting.
Standout Features
- Context-Aware Smart Sampling: Intelligently retains only high-priority traces based on latency spikes, error rates, or unusual transaction patterns, cutting storage requirements without losing critical visibility.
- Multi-Mode Deployment: Offers SaaS, on-premises, or private cloud options to meet compliance, security, and data sovereignty needs.
- Rapid Rollout: Pre-configured integrations and dashboards enable teams to start monitoring within an hour, reducing time-to-value significantly.
- In-Platform Expert Support: Direct access to engineers via Slack or messaging ensures sub-minute responses during incidents.
Key Features
- Unified MELT Observability: Covers infrastructure, applications, databases, RUM, synthetics, and error tracking in one dashboard.
- Native OTEL Compatibility: Accepts telemetry directly over OTLP, ensuring vendor-neutral instrumentation and easier migration from other tools.
- Transparent Usage-Based Pricing: No per-host or per-module costs—billing is purely based on ingestion volume.
- Advanced Alerting: Supports rule-based, anomaly-driven, and webhook alerts for proactive incident management.
- Role-Based Access Control: Granular permissions and SSO integration ensure secure multi-team collaboration.
- Integration-Ready: Works seamlessly with popular CI/CD, alerting, and visualization tools.
Pros
- 100% OTEL-native ingestion with no vendor lock-in
- Smart sampling reduces data costs without losing key insights
- Multiple deployment models for regulatory compliance
- Predictable, transparent pricing model
- Rapid onboarding with minimal configuration
Cons
- An observability-focused platform with no cloud security management features
- Not suitable for companies looking for SaaS-only platforms
Best for
CubeAPM is ideal for DevOps, SRE, and platform teams operating large-scale, containerized applications or hybrid infrastructures. It’s particularly suited for organizations prioritizing open standards, flexible hosting, and cost efficiency without sacrificing observability depth.
Pricing & Customer Reviews
- Pricing: $0.15/GB of data ingested
- Score: 4.7/5
- Praised for: transparent pricing, fast deployment, and highly responsive Slack-based support
CubeAPM vs StackState
While StackState emphasizes topology mapping for infrastructure context, CubeAPM delivers a broader MELT stack with full OTEL compatibility, smart sampling, and flexible deployment options. It offers a simpler onboarding process and a transparent pricing model, making it easier to scale without unexpected costs.
2. Datadog
Known for
Datadog is a leading SaaS observability and security platform designed for organizations operating at cloud scale. It delivers full-stack visibility by unifying telemetry from infrastructure, applications, user experience, and security into a single analytics interface. Its extensive integration catalog makes it a top choice for teams using diverse tools and services.
Standout Features
- Extensive Integration Ecosystem: Offers over 700 prebuilt integrations covering cloud providers, orchestration platforms, databases, messaging systems, and CI/CD tools for fast onboarding.
- Collaborative RCA Workflows: Notebooks and shared dashboards allow teams to combine metrics, traces, and logs into context-rich investigation documents.
- Security Observability Convergence: Brings vulnerability scanning, runtime protection, and compliance insights into the same interface as performance monitoring.
- Frontend Insights with RUM & Replay: Captures user sessions to visually analyze performance issues and UI errors.
- Serverless Deep-Dive: Monitors serverless functions with latency, invocation counts, and cold start metrics.
Key Features
- Complete MELT Coverage: Correlates metrics, events, logs, traces, synthetics, and RUM for unified analysis.
- Auto-Instrumentation for Core Languages: Agents and libraries for Java, Python, Go, Node.js, .NET, and more allow fast telemetry capture without heavy code changes.
- Kubernetes & Cloud-Native Support: Native monitoring for containers, pods, and cloud services like AWS ECS, Azure Monitor, and GCP Stackdriver.
- Security Telemetry Integration: Links application and infrastructure performance data with vulnerability and threat detection.
- Deployment Tracking: Ties changes in performance directly to code commits, releases, or build pipelines.
- Customizable Dashboards: Flexible widget system for building tailored visualizations and KPIs.
Pros
- Wide integration coverage reduces setup time
- Offers security and performance monitoring both in one platform
- Rich RCA tooling with collaborative investigation features
- Strong support for serverless and containerized environments
- Machine learning-driven anomaly detection improves alert accuracy
Cons
- Ingestion-based billing can escalate costs unpredictably
- No self-hosted deployment option
- Proprietary agents limit OTEL-native adoption
- The default trace sampling may miss rare but important events
- Non-enterprise tiers may receive slower support
Best for
Datadog is best suited for large-scale, fast-growing organizations running microservices, containerized workloads, or serverless functions across AWS, GCP, and Azure. It’s especially valuable for DevOps and SecOps teams needing integrated security and observability, but budget-conscious teams should plan for potential cost fluctuations.
Pricing & Customer Reviews
- Pricing: Infra starts at $15 per host/month, APM at $31 per host/month, with logs starting at $0.10/GB ingestion. Extra charges for synthetics, RUM, and security features.
- G2 rating: 4.4/5
- Praised for: deep integration library, unified telemetry view, powerful dashboarding
- Criticized for: unpredictable pricing at scale, lack of OTEL-native ingestion, and no on-premises hosting
Datadog vs StackState
While StackState specializes in topology-based observability with strong dependency mapping, Datadog provides a broader set of integrations and combines performance with security telemetry. However, its reliance on proprietary instrumentation and high ingestion costs can make it less suitable for teams seeking open standards and predictable billing.
3. New Relic
Known for
New Relic is a cloud-based observability platform tailored for engineering teams seeking end-to-end visibility into applications, infrastructure, and user experience. It combines all MELT (Metrics, Events, Logs, Traces) telemetry within a single user interface, enabling faster troubleshooting and in-depth performance analysis.
Standout Features
- Explorer Service Mapping: Automatically visualizes services, dependencies, hosts, and containers, helping teams navigate complex distributed systems.
- NRQL-based Analytics: New Relic Query Language (NRQL) allows you to filter, aggregate, and visualize data precisely and in real time.
- Anomaly Detection Engine: Uses AI to learn baseline behaviors and flag deviations in throughput, latency, and error rates.
- Customizable Dashboards: Advanced layout options allow role-specific views and consolidated business-level summaries.
- CI/CD Release Tracking: Links telemetry data to deploy events for identifying performance regressions quickly.
Key Features
- Unified Telemetry Pipeline: Consolidates logs, traces, metrics, synthetics, and RUM into a single correlation model.
- Agent-Based Auto-Instrumentation: Supports languages like Java, Python, Go, .NET, Ruby, and Node.js for quick setup.
- Cloud & Kubernetes Monitoring: Deep integrations with AWS, Azure, GCP, and Kubernetes for resource, pod, and cluster insights.
- Synthetic and Real User Monitoring: Captures both real traffic and simulated tests to identify performance issues early.
- Behavior-Based Alerting: Dynamic thresholds adapt to normal usage patterns to reduce false alarms.
- Third-Party Integrations: Works with tools like Slack, Jira, GitHub, and PagerDuty for automated incident management.
Pros
- Flexible query engine for advanced telemetry analysis
- Wide language and framework support for instrumentation
- Highly customizable dashboards for various teams
- Seamless CI/CD awareness for release monitoring
- Fast time-to-value with intuitive SaaS onboarding
Cons
- SaaS-only model limits compliance flexibility for regulated sectors
- Costs can escalate with data ingestion and premium features
- Not fully OTEL-native—requires additional configuration for OTEL ingestion
- Head-based sampling may omit rare but critical events
- Support wait times may be longer for non-enterprise plans
Best for
New Relic is best for cloud-first teams, platform engineers, and SREs who prioritize rich visual telemetry, rapid deployment, and CI/CD integration. It’s ideal for organizations looking for a full-stack SaaS solution with deep analytics, but not for those needing self-hosting or strict OTEL-native pipelines.
Pricing & Customer Review
- Pricing: Ingestion-based pricing of $0.35/GB + $418/user/month for full access.
- G2 rating: 4.4/5
- Praised for: dashboard flexibility, powerful NRQL querying, quick setup
- Criticized for: no option for self-hosting, difficult to estimate cost as data grows, partial support for OTEL
New Relic vs StackState
StackState focuses heavily on topology mapping and infrastructure relationships, while New Relic delivers a broader MELT stack with rich analytics, release tracking, and customizable dashboards. However, its SaaS-only approach and higher ingestion costs may not suit compliance-sensitive or cost-conscious teams.
4. Dynatrace
Known for
Dynatrace is a famous, enterprise-grade observability solution that offers full-stack monitoring, AI-driven automation, and advanced features. It’s Davis® AI engine continuously analyzes application, infrastructure, and user performance data—automatically pinpointing root causes without manual rule-setting.
Standout Features
- Smartscape Topology Mapping: Generates live, dependency-aware visual maps of services, hosts, containers, and APIs to aid in troubleshooting.
- Davis® AI Root Cause Engine: Utilizes causality-aware AI to sift through MELT data (metrics, events, logs, traces) and identify critical issues instantly.
- Built-in App Security: Runtime protections and vulnerability checks operate alongside performance monitoring—no extra tools needed.
- AI Observability for GenAI Stacks: Extends monitoring to LLMs and AI workflows—tracking costs, hallucinations, compliance, and performance across the AI pipeline with unified insights.
Key Features
- All-in-One MELT Stack: Offers metrics, logs, events, traces, synthetic checks, and RUM in an integrated view.
- OneAgent Auto-Discovery: Installs autonomously to detect services, dependencies, and entry points without manual instrumentation.
- Kubernetes & Cloud Coverage: Includes visibility at the pod and node levels across complex cloud-native and multicloud setups.
Pros
- AI-powered automatic root-cause detection with minimal manual tuning
- Broad auto-instrumentation across modern and legacy environments
- Native application security integration without separate agents
- Live topology insights via Smartscape for dependency clarity
- GenAI observability capabilities for modern AI workloads
Cons
- Hourly billing complexity can make cost forecasting tricky in dynamic environments
- Closed architecture limits flexibility for OpenTelemetry purists
- Lacks complete self-hosting options—primarily SaaS-based
- Difficult for SMBs to learn it, particularly if they are not familiar with AIOps
Best for
Dynatrace suits large enterprises and operations centers needing advanced, automated observability and security, especially across multicloud, hybrid, and AI-native workloads. It excels when automated root-cause analysis, real-time topology, and comprehensive monitoring are business-critical.
Pricing & Customer Reviews
- Full-stack: $0.08/hour/8 GiB host
- Infra: $0.04/hour
- Application security: $0.018/hour
- G2 rating: 4.5/5
- Praised for: AI-driven diagnostics, infrastructure automation, and hybrid cloud support
- Criticized for: complex pricing model, limitations in OTEL compatibility, and enterprise-focused rollouts
Dynatrace vs StackState
StackState offers MELT coverage and topology visualization. But Dynatrace takes this forward with native security, AI analytics, and automated incident triaging. That said, teams that need support for open standards, deployment options, or transparent pricing can find StackState a more agile alternative.
5. Splunk AppDynamics
Known for
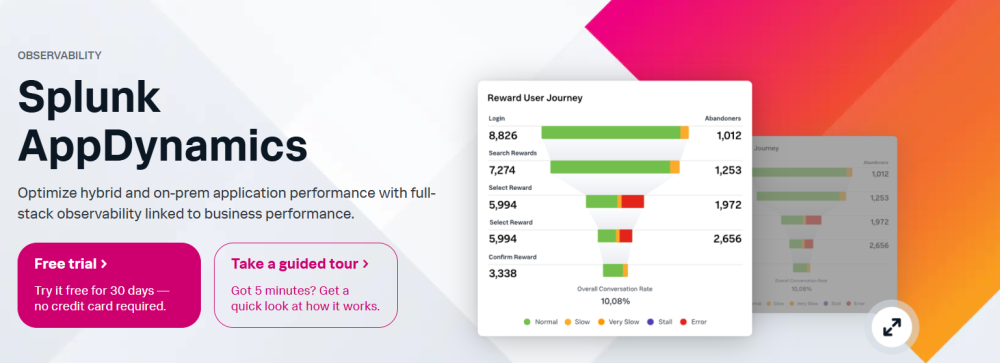
Splunk AppDynamics is a comprehensive APM platform under the Splunk Observability umbrella, designed to link application performance issues directly to business outcomes across hybrid and legacy architectures. It excels in tracing business transactions end-to-end—from frontend interactions to infrastructure and code-level diagnostics.
Standout Features
- Business Transaction Monitoring: Captures and visualizes critical workflows across services, enabling pinpoint diagnosis of bottlenecks.
- Live Application Topology Mapping: Continuously illustrates dependencies among services, databases, and external APIs with latency overlays.
- Deep Code Diagnostics: Allows developers to drill into method-level performance across Java, .NET, PHP, and other environments.
- Adaptive Anomaly Detection: Dynamically adjusts thresholds by learning normal behavior, reducing false alarms.
Key Features
- Full APM Coverage: Agents support foundational languages and frameworks to monitor metrics, traces, and code execution.
- Business Path Tagging: Tracks important workflows to tie performance back to SLAs and customer journeys.
- RUM & Synthetics: It can validate user experience with your applications via real-user monitoring (RUM) as well as synthetic checks.
- Hybrid & On-Prem Support: Compatible with cloud, on-prem, and legacy systems, with tailored insights across environments.
- Embedded App Security: Includes runtime security (via Cisco Secure Application) to identify vulnerabilities in context.
- CI/CD Traceability: Connects performance trends to deployments, enabling teams to catch regressions before impact.
Pros
- Business-centric observability aligned with key user workflows
- Precise code-level diagnostics aid fast debugging
- Flexible deployment options across hybrid infrastructures
- Integrated security adds context to performance insights
- Baseline-driven anomaly detection reduces alert fatigue
Cons
- Pricing tied to vCPU licensing, which can scale unpredictably
- Proprietary instrumentation, not OTEL-native, limits standardization
- All data passes through the platform, with potential egress and latency overhead
- Migration may involve full re-instrumentation and toolchain changes
- Support experiences can vary, especially via channel partners
Best for
Splunk AppDynamics is ideal for large enterprises managing SLA-critical applications across hybrid environments, where deep code visibility and business-transaction intelligence are essential. It’s most effective when business outcomes drive tooling decisions and teams can manage proprietary deployment models.
Pricing & Customer Reviews
- Pricing: ranges $6/month-$50/host/month, billed annually
- G2 rating: 4.3/5
- Praised for: deep diagnostics, visibility into transactions, support for hybrid infrastructure
- Criticized for: complex pricing, lack of OTEL-native support, inconsistent support responsiveness
Splunk AppDynamics vs StackState
StackState prioritizes observability and infrastructure topology. But AppDynamics is strong in code-level performance, user-focused workflows, and visibility into business transactions. However, AppDynamics’ proprietary agents and licensing structure may reduce flexibility for teams seeking OTEL-compliant tooling or transparent cost models.
6. Sentry
Known for
Sentry is a developer-focused monitoring tool famed for catching application errors, tracking performance regressions, and correlating issues back to code and releases. It’s particularly valued by teams working with frontend frameworks, mobile apps, and full-stack environments, where rapid feedback and actionable debugging insights drive quality.
Standout Features
- Intelligent Error Grouping: Automatically clusters similar exceptions, then enriches them with deep context like stack traces and environment metadata to speed up debugging.
- Code-Linked Issue Routing: Maps issues to relevant developers by correlating errors with commit history and source ownership.
- Frontend-to-Backend Performance Tracing: Tracks the journey from UI events into backend services, highlighting latency and failure points across layers.
- Visual Session Playback (Premium): Records and lets developers replay user interactions to understand the circumstances leading up to errors.
Key Features
- Comprehensive Crash Capture: Logs full error payloads, including breadcrumbs, version, and contextual data for each event.
- Distributed Transaction Tracing: Measures latency across multiple services and UI components to visualize bottlenecks.
- Release-aware Diagnostics: Links regressions to specific deployments or pull requests to pinpoint performance backslides.
- Developer Workflow Integrations: Triggers via Slack, Jira, GitHub, and workflow hooks help automate triage and assignment.
- Wide SDK Support: Offers client libraries for major platforms, including JavaScript, Python, Java, PHP, React Native, Flutter, iOS, and Android.
Pros
- Rich error context improves time to resolution
- Git-aware issue assignment streamlines team workflow
- Unified view of crashes, deployments, and performance in one UI
- Lightweight setup ideal for developer-first environments
- Broad integration ecosystem enhances flexibility
Cons
- No visibility into infrastructure, logs, or metrics
- Not OpenTelemetry-native, users have to rely on proprietary agents
- Sampling and filtering controls are limited compared to OTEL-native systems
- Advanced features like session replay require higher-tier plans
- Support may be slower for non-enterprise customers
Best for
Sentry is best suited to software development teams focused on identifying and resolving bugs quickly, especially in client-heavy (frontend or mobile) applications. It’s perfect for teams needing full-stack issue insight tied to code, but not for those seeking broad observability across infrastructure.
Pricing & Customer Reviews
- Pricing: Free tier; Team: $26/month; Business: $80/month
- G2 rating: 4.5/5
- Praised for: fast debugging, GitHub integration, clean UX
- Criticized for: missing infra observability, premium feature gating, non-OTEL design
Sentry vs StackState
StackState is strong in multi-layer observability and IT infrastructure topology visualization, while Sentry focuses on error detection down to the application level, tied to code and releases. Sentry’s lightweight, developer-friendly tools are excellent for debugging user-facing issues, but StackState (and alternatives like CubeAPM) provide broader system-wide insights necessary for infrastructure health and incident forecasting.
7. SolarWinds Observability
Known for
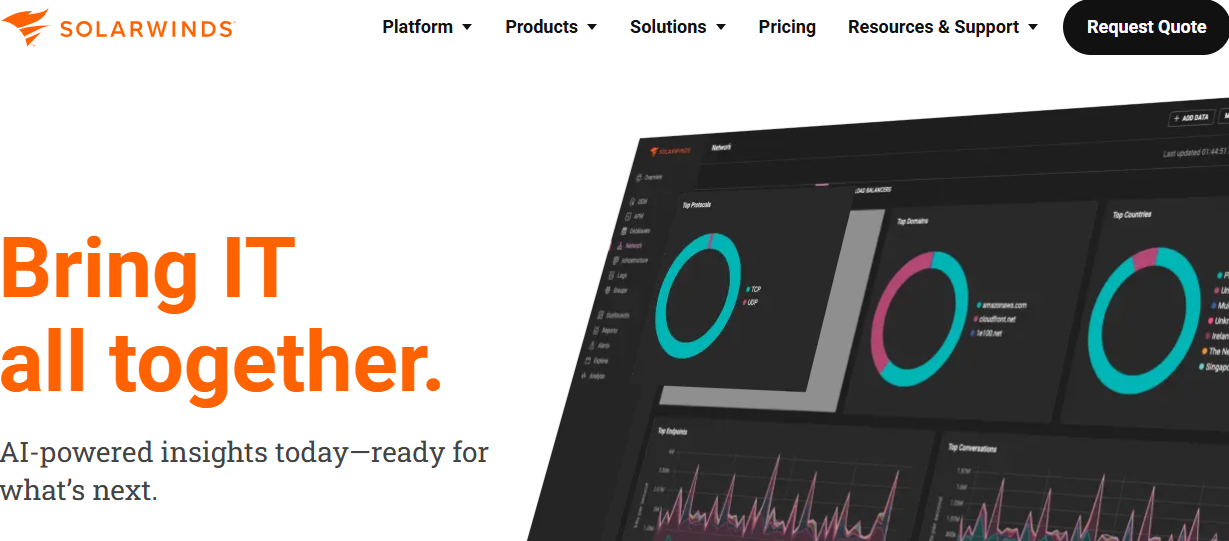
SolarWinds Observability is a hybrid-friendly observability suite built to unify visibility across infrastructure, applications, networks, databases, and user experience. Tailored for organizations with mixed environments, it simplifies performance monitoring and root cause analysis through AIOps-driven insights.
Standout Features
- Cross-Domain Hybrid Visibility: Centralizes telemetry from on-prem systems, cloud services, networks, and databases into a single pane.
- AI-Enhanced Anomaly Detection: Employs machine learning to surface performance anomalies, correlate events, and reduce alert fatigue.
- Dynamic Asset Navigator: Offers interactive dashboards and asset maps that let teams trace issues across services and hardware seamlessly.
- Modular Licensing Structure: Organizations can choose observability components—like app, infra, logs, or database monitoring—based on their needs.
Key Features
- Full MELT: The tool supports the full MELT stack – metrics, logs, traces, events, alongside RUM and synthetics.
- Hybrid Deployment Options: Supports both SaaS and on-prem/self-hosted deployment with per-node pricing.
- Contextual Dashboarding: Custom role-based views help different teams monitor what matters most.
- Full Infrastructure & Network Coverage: Extends monitoring to network devices, SD-WAN, Meraki, and virtual/cloud components.
- AIOps-Powered Intelligence: Bundles related alerts and highlights critical issues automatically.
Pros
- Consolidates diverse telemetry sources into unified dashboards
- AIOps-driven analytics reduce investigation time
- Strong support for legacy and hybrid environments
- Modular licensing enhances budget control
- Deep coverage of network and database layers
Cons
- Costs escalate as you enable more modules or manage more nodes
- Initial setup and tuning can be time-consuming
- Not designed with OpenTelemetry-native workflows in mind
- Dashboard UI can feel outdated for modern observability users
- Support response varies across regions and subscription levels
Best for
SolarWinds Observability is best suited for large enterprises or IT departments managing hybrid systems—like on-prem servers, network gear, cloud workloads, and databases—who need AI-assisted root cause detection and flexible licensing to monitor critical business services across disparate environments.
Pricing & Customer Reviews
- Monitoring and Observability: $ 6 per node/month;
- Database: $142 per database/ month;
- Service management: $39 per technician/month
- Incidence Response: $9 per user/month
- Self-hosted option: $7.42 per node/month (with volume discounts)
- G2 rating: 4.3/5
- Praised for: centralized cross-domain visibility, modular flexibility, and strong hybrid support
- Criticized for: escalating licensing costs, initial configuration complexity, and inconsistent support delivery
SolarWinds Observability vs StackState
While both platforms offer topology-aware observability, SolarWinds leans into AI-assisted hybrid monitoring and extensive domain coverage—from networks to RUM—across multiple environments. In contrast, StackState offers dependency mapping at the infrastructure level and MELT correlation. Teams requiring modular deployment across legacy and cloud systems may appreciate SolarWinds’ breadth, but for organizations favoring OTEL-native instrumentation and transparent pricing, CubeAPM or StackState may offer better alignment.
Conclusion: What’s the Best StackState Alternative
StackState offers strong topology-based insights and real-time MELT correlation, but its steep learning curve, rigid architecture, and escalating costs often push teams to explore better options.
This is where CubeAPM stands out as the best StackState alternative, offering full OpenTelemetry-native observability, smart sampling to reduce costs, self-hosting, MELT coverage, and transparent pricing. CubeAPM delivers all the insights of an enterprise APM tool, without the vendor lock-in or operational burden.
Ready to upgrade your observability stack? Try CubeAPM today and experience powerful, efficient, and affordable full-stack monitoring built for modern teams.
Disclaimer: The information in this article reflects the latest details available at the time of publication and may change as technologies and products evolve.
FAQs
1. Why are teams looking for alternatives to StackState?
Teams often seek alternatives due to StackState’s complex setup, high resource requirements, proprietary architecture, and lack of transparent pricing. As cloud-native and OpenTelemetry adoption grows, many organizations prefer tools that are easier to scale, manage, and integrate with existing pipelines.
2. What features should I look for in a StackState alternative?
Key features include native OpenTelemetry support, full MELT observability (Metrics, Events, Logs, Traces), smart sampling to control cost, flexible deployment options (SaaS, on-prem, hybrid), intuitive dashboards, and transparent usage-based pricing.
3. Is CubeAPM a good replacement for StackState?
Yes, CubeAPM is one of the best alternatives to StackState. It offers OTEL-native observability, real-time MELT insights, self-hosting options, and aggressive cost savings through smart sampling, making it ideal for modern DevOps, SRE, and platform teams.
4. How does StackState compare to tools like Datadog or Dynatrace?
While StackState focuses on topology and versioned time-travel maps, tools like Datadog and Dynatrace offer broader integrations and stronger cloud-native automation. However, both can be more expensive and less flexible in terms of data control and hosting.
5. Which StackState alternative is best for regulated industries?
CubeAPM is especially suited for regulated environments due to its support for on-premise and air-gapped deployments, OTEL-native telemetry, and compliance-friendly features like RBAC, audit logs, and data localization controls.


