GlitchTip is an open-source, Sentry-compatible error monitoring tool designed for simplicity, privacy, and affordability. Developers seeking a lightweight, self-hosted error-tracking solution are its major users. However, GlitchTip focuses more on error and uptime monitoring, not full-stack observability.
If you’re looking for a full-stack observability solution, CubeAPM is the best GlitchTip alternative. It delivers full MELT observability, native OpenTelemetry support, smart sampling, full self-hosting, and highly cost-effective pricing. In this article, we’re going to cover the best alternative to GlitchTip, comparing each across features, pricing, deployment, and more.
Top 7 GlitchTip Alternatives
- CubeAPM
- Datadog
- New Relic
- Dynatrace
- Sentry
- SigNoz
- Raygun
Why Are People Looking for GlitchTip Alternatives?
Pricing Predictability Challenges
GlitchTip’s hosted pricing follows a monthly event cap model – $15 for 100k events, $50 for 500k events, and $250 for up to 3 million events. While this is straightforward for steady workloads, it can spike during traffic surges or incidents. Also, many teams may have larger event requirements than what’s permitted in the first or second tier. So, pricing can become costly at scale.
Limited Observability
GlitchTip is strong at error tracking and also offers uptime monitoring (pinging or heartbeat checks with alerts) and APM (simple APM to find slow requests and transactions).
However, GlitchTip does not describe itself as a full-stack observability platform on the official site or in the documentation (e.g., there is no mention of rich logs aggregation, distributed tracing across services, infrastructure metrics, or other comprehensive telemetry commonly associated with full-stack observability).
Self-Hosting Complexity
GlitchTip’s self-hosting can cut licensing costs but can add operational overhead. Deployments require PostgreSQL, Redis (or Valkey), worker and web services, and often load balancers. Scaling for high volumes needs tuning, storage, and orchestration tools, while updates risk halting event processing. Without dedicated expertise, smaller teams may face issues. (GitHub, DevOps.dev)
Criteria for Selecting GlitchTip Alternatives
Full MELT Observability
A strong alternative should provide integrated Metrics, Events, Logs, and Traces, allowing engineers to connect issues across layers in one place. This eliminates the need for juggling multiple tools and speeds up root-cause analysis during incidents.
OpenTelemetry (OTEL) Support
Native support for OTel means compatibility with many SDKs and exporters, preventing vendor lock-in. This is essential for future-proofing your observability stack and unifying telemetry collection across all services.
Transparent and Predictable Pricing
Look for a model that scales linearly with actual usage—whether based on data volume or resource count—so teams avoid sudden jumps in cost during traffic spikes. This helps with budgeting and long-term cost control.
Deployment Flexibility
A good tool should support SaaS, self-hosted, or hybrid setups to match your compliance and infrastructure needs. Self-hosting is especially important for organizations with strict data residency requirements.
Advanced Sampling and Retention Controls
Intelligent sampling (head/tail/context-aware) and customizable data retention help keep storage costs manageable while retaining valuable telemetry for analysis. This is key in high-throughput environments.
Broad Integration Ecosystem
Pre-built connectors for CI/CD tools, cloud services, alerting systems, and ticketing platforms reduce setup time and ensure smooth integration into existing workflows.
Quality Support and SLAs
Fast, reliable support—via chat, email, or dedicated channels—can drastically reduce downtime during issues. Clear SLAs boost team confidence in choosing a vendor based on how responsive they are.
GlitchTip Overview
Known for
GlitchTip is an open-source error monitoring tool compatible with Sentry and offers error tracking, basic performance monitoring, and uptime alerts. It supports both hosted and self-hosted deployments, making it a popular lightweight option for teams seeking control and affordability. It’s ideal for teams that need monitoring but without the complexities of full APM tools.
Standout Features
- Error Tracking & APM: Captures exceptions and slow transactions with minimal setup.
- Uptime Monitoring: Built-in health checks with alerts via email or webhook.
- Sentry SDK Compatibility: Works with existing Sentry clients for an easier migration path.
Key Features
- Error Tracking: Aggregates exceptions, logs, and environment metadata in real time.
- App Performance Monitoring: Detects slow web requests and database operations without complex dashboards.
- Uptime Monitoring: Schedules endpoint checks and sends alerts if services go down.
- Hosted & Self-Hosted Deployment: Available as SaaS or self-hosted via Docker Compose or Kubernetes Helm.
- Notification Channels: Supports email and webhook alerts.
- Project Management: It helps you manage multiple projects and track their status.
Pros
- Open-source and Sentry-compatible, making migration easier
- Lightweight and simpler to deploy than full Sentry
- Combines errors, performance, and uptime monitoring in one tool
- Transparent pricing with a free tier and affordable paid plans
Cons
- Self-hosting can be complex for smaller teams
- Not a full-stack observability solution
Best for
Teams wanting a cost-effective, open-source alternative to Sentry for essential error tracking, basic performance insights, and uptime monitoring—particularly where self-hosting or simplicity is a priority.
Pricing & Customer Reviews
- Pricing: Free tier (1,000 events/month), Paid: $15/month for 100k events, $50 for 500k, $250 for up to 3M events.
- GitHub stars: 87
- Praised for: Lightweight, easy to self-host, and straightforward to set up.
- Criticized for: Fewer observability features
Top 7 GlitchTip Alternatives
1. CubeAPM

Known for
CubeAPM delivers enterprise-grade, full-stack observability that offers metrics, logs, traces, real user monitoring (RUM), synthetics, database monitoring, infrastructure insights, and error tracking. It replaces the need for multiple disconnected tools, helping teams reduce complexity while improving visibility and control. Known for its cost efficiency, OTEL-native architecture, and compliance-ready deployment options, CubeAPM enables organizations to monitor at scale without vendor lock-in or budget overruns.
Standout Features
- Full MELT Coverage: A complete observability stack including distributed tracing, logs, error inbox, RUM, synthetics, infra metrics, service graphs, custom metrics, dashboards, SLOs, alerts, and exception stack traces
- Smart Sampling: Context-aware sampling that prioritizes high-value telemetry such as error events and latency anomalies, cutting ingestion costs significantly without losing key insights
- Data Security & Compliance: Option to store all data in your own cloud or geographic region to meet GDPR, HIPAA, and enterprise compliance requirements
- Pre-Built Dashboards & Intuitive UX: Ready-to-use dashboards with a clean, fast interface for rapid onboarding and monitoring
Key Features
- OpenTelemetry Native: Ingests and exports OTEL data for seamless interoperability and vendor-neutral monitoring
- Full Observability Stack: Combines APM, logs, metrics, RUM, synthetics, and alerts into one integrated platform.
- Simple Pricing: Flat-rate ingestion and transfer model with no per-user or per-feature charges
- Enterprise Features: Role-based access control (RBAC), single sign-on (SSO), MFA, audit logging, high-availability clustering, and extended retention options
Pros
- Supports 800+ integrations across tools and services
- Consolidates multiple observability tools into one
- OTEL-native, avoiding vendor lock-in
- Smart sampling significantly reduces costs
- No egress charges
- Enterprise-ready with advanced access control and security
Cons
- Observability-focused platform; doesn’t provide cloud security management capabilities
- May not suit teams looking for SaaS-only platforms
Best for
Organizations of all sizes, particularly SaaS providers, fintechs, healthcare firms, and large enterprises, need a unified, cost-efficient observability platform with flexible deployment options and strong compliance features. Ideal for teams replacing multiple tools with one integrated system that scales predictably.
Pricing & Customer Reviews
- Pricing: Starts at $0.15/GB of data ingested
- G2 Score: 4.7/5
- Praised for: Smart sampling, full-stack MELT coverage, ease of migration, transparent pricing, and responsive support
CubeAPM vs GlitchTip
GlitchTip focuses on error tracking and offers basic APM and uptime monitoring, but doesn’t offer the full MELT stack and advanced cost-optimization features. CubeAPM provides all telemetry types, OTEL-native flexibility, smart sampling, and full self-hosting deployment in a single platform with simple $0.15/GB pricing.
2. Datadog
Known for
Datadog is a cloud-native observability and security platform, offering metrics, logs, traces, RUM, synthetics, application performance, infrastructure monitoring, and security—all in a single, cohesive service. It excels at rapid deployment across complex environments and offers powerful dashboards, AI-driven anomaly detection, and vendor-backed integrations. Ideal for teams prioritizing full-stack visibility, rich context, and scalability.
Standout Features
- End-to-End Observability: Full visibility into infrastructure, applications, logs, traces, RUM, synthetics, and security from one platform
- AI-Powered Detection (Watchdog): Automated anomaly detection that identifies and surfaces unusual patterns and incidents proactively
- 900+ Integrations: Extensive vendor-backed integrations, especially strong in cloud providers, databases, and middleware
- LLM & AI Observability: Innovative support for tracing and securing LLM-driven workflows, with insights into token usage, latency, and error flows
Key Features
- Infrastructure & APM Monitoring: Monitors hosts, containers, serverless, and services—capturing metrics, events, logs, and traces
- Fine-Grained Sampling Controls: Configure trace sampling at the host, service, or endpoint level directly from the UI for cost-performance tuning
- OpenTelemetry Support: Supports both native and hybrid OTEL setups for vendor-neutral data collection
- Custom Alerts & Dashboards: Build trigger-based alerts across any metric or log, and design intuitive dashboards with synchronized views
- Security & Compliance Suite: Includes SIEM, workload protection, sensitive data scanning, and audit trails for unified observability and security
Pros
- Extremely rich feature set across observability and security
- Exceptional integration breadth across technologies
- AI-powered detection enhances proactive monitoring
- Mature, battle-tested SaaS solution with global scalability
Cons
- Can be expensive for smaller teams
- SaaS-only; no self-hosting
Best for
It’s best suited for large or fast-growing organizations, especially cloud-native enterprises, MSPs, and teams managing microservices, looking for a consolidated, feature-rich observability and security platform with extensive integrations and AI-driven insights..
Pricing & Customer Reviews
- Pricing Model: Infrastructure monitoring starts at ~$15 per host/month; APM adds ~$31/host; log management is ~$0.10 per GB; synthetic monitoring ranges per test type
- G2 rating: 4.4/5
- Praised for: Unified visibility across stacks, seamless integrations, and automated detection capabilities
- Criticized for: High cost, SaaS-only
Datadog vs GlitchTip
GlitchTip offers lightweight, open-source error tracking with basic performance metrics—ideal for low-cost, simplistic setups. In contrast, Datadog delivers full-stack observability, AI-driven insights, real user and synthetic monitoring, and enterprise-level integrations and security features. While powerful, Datadog comes with a higher cost, making it suitable for teams that need deep, scalable visibility and are willing to invest in a pure SaaS platform.
3. New Relic
Known for
New Relic is a fully integrated, cloud-native observability and intelligence platform that provides APM, infrastructure, logs, traces, RUM, synthetics, security, and business observability. It also offers advanced AI/LLM-powered insights and deep instrumentation capabilities. It focuses on visibility across complex stacks and easy onboarding.
Standout Features
- Observability Across 50+ Capabilities: Covers APM, infrastructure, logs, distributed tracing, mobile/browser RUM, synthetics, error inbox, dashboards, alerting, change tracking, and more
- New Relic AI & LLM Assistants: Offer natural-language insights, health reporting, alert gap analysis, and AI-powered troubleshooting workflows
- Plenty of Integrations: Connects to 780+ built-in integrations across clouds, stack components, frameworks, and DevOps tools
- Custom Query Language (NRQL): Powerful, SQL-like query language to slice and analyze telemetry data across your stack in real time
Key Features
- APM & Infrastructure Monitoring: Real-time insights into services, hosts, containers, serverless, and networks
- Log Management: Free tier with 100 GB/month of log ingestion; intuitive, contextual log analysis integrated with trace and metric views
- Synthetic & RUM Monitoring: Simulates user paths with synthetic tests and monitors real user behavior directly in browser/mobile apps
- Alerting & Dashboards: Flexible rule-based alerts, incident correlation, and highly customizable dashboards for observability workflows
- Business Observability & Security: Includes vulnerability detection, SAP monitoring, cost intelligence, and customer journey mapping tools
Pros
- Deep, real-time visibility across services, infrastructure, user experience, and security
- Highly intuitive dashboards and dashboards with advanced monitoring controls
- Strong AI and LLM features that assist with diagnostics and alert insights
- Generous free tier with broad feature access and usage-based pricing
Cons
- High pricing, especially with host and data-based charges
- SaaS-only; no self-hosting
Best for
Mid-to-large organizations—especially SaaS businesses, enterprises, and teams managing complex or hybrid architectures—seeking deep, unified observability, AI-driven insights, and highly flexible monitoring tools, and who are willing to invest in a comprehensive, premium-grade platform.
Pricing & Customer Reviews
- Pricing Model: Free tier includes 100 GB/month log ingestion and core usage. Ingestion-based pricing of $0.40/GB and $418/user/month for full access.
- G2 rating: 4.4/5
- Praised for: Rich, contextual visibility, real-time diagnostic tools, powerful AI features, and unified cross-stack monitoring
- Criticized for: Cost, no self-hosting
New Relic vs GlitchTip
GlitchTip excels at open-source, straightforward error tracking and basic performance monitoring with minimal fuss and cost. In contrast, New Relic offers full-spectrum observability, including diagnostics across RUM, logs, metrics, alerts, and AI-driven insights in a polished SaaS platform, but at a high price.
4. Dynatrace
Known for
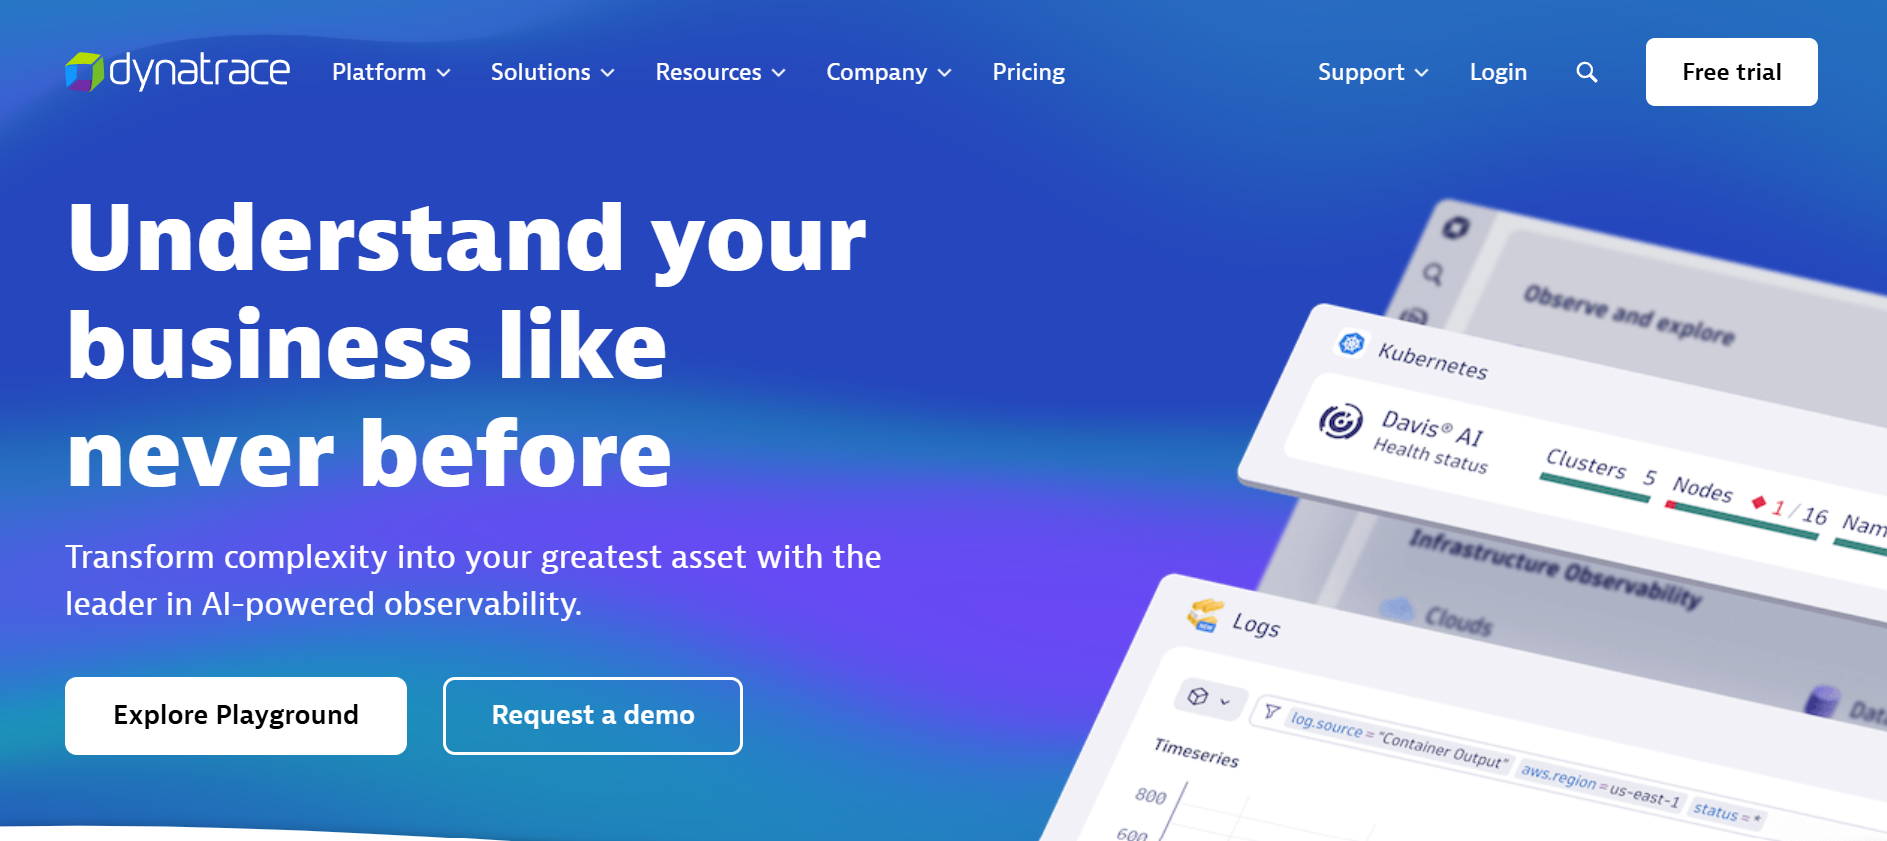
Dynatrace is a powerful, AI-driven observability and security platform designed to automatically map and monitor complex cloud-native environments, from applications and infrastructure to real user interactions and threat detection. It’s strong in contextual analytics, automated RCA, and business-level insights that modern DevSecOps crave.
Standout Features
- Davis AI: It uses Davis AI, a generative AI, to automatically detect anomalies, pinpoint root causes, and recommend remediation.
- Smart Real-Time Topology (Smartscape): Auto-discovers and maps all services and infrastructure components, keeping real-time visibility and relationships updated
- Automation & Analytics Engine: Includes AppEngine for building custom observability apps and AutomationEngine for event-driven workflows
- Security: Combines full-stack monitoring with application security, threat detection, business analytics, and software delivery insights
Key Features
- Full-Stack Monitoring: Covers infrastructure, applications, logs, traces, digital experience (RUM, synthetics), security, and business analytics
- Built-In AI/ML Observability: Automatically surfaces baseline deviations, anomalies, business-impacting events, and recommendations for faster remediation
- Scalable Cloud-Native Architecture: Designed to handle global, hyperscale environments with flexible hourly pricing and no hidden fees
- Extensive Integrations & Platform Toolkit: Supports cloud-native platforms, custom extensions via Dynatrace Hub, and automation via OpenPipeline and Grail data lake
Pros
- Best-in-class AI-powered diagnostics reduces MTTR significantly
- Rich, automated topology mapping minimizes manual instrumentation
- Comprehensive visibility across observability, security, and business metrics
- Flexible, hourly-based pricing with transparent cost structure
Cons
- Steep learning curve due to its extensive feature set
- Cost can escalate in large-scale or highly dynamic environments
Best for
Large enterprises, cloud-first organizations, SRE teams, and regulated industries seeking proactive, automated observability and security at scale—with top-tier AI-driven diagnostics, rich contextual mapping, and support for DevSecOps workflows.
Pricing & Customer Reviews
- Pricing Model: $0.08/hour/8 GiB host for full-stack monitoring.
- G2 rating: 4.5/5
- Praised for: AI-assisted root-cause analysis, visually rich topology mapping, and scalability for hybrid-cloud environments
- Criticized for: cost and learning curve
Dynatrace vs GlitchTip
GlitchTip delivers simple error tracking and basic performance monitoring in an open-source package. Dynatrace, by contrast, gives teams a full-spectrum observability and security suite—reinforced by AI—built for massive scale and automation. GlitchTip provides basic capabilities; Dynatrace offers deep context, quick resolution, and operational intelligence.
5. Sentry
Known for
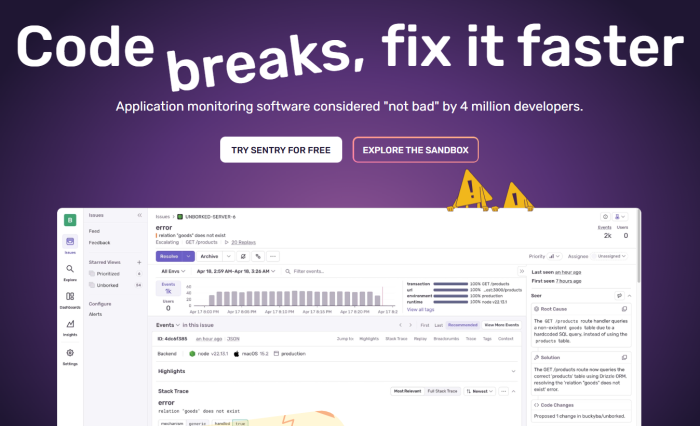
Sentry is a developer-first observability platform renowned for its powerful error tracking, performance monitoring, and deep code-level insights across both frontend and backend environments. It excels at grouping recurring issues, tracing errors to specific code commits or lines, and supporting session replay for visual context—all designed to help developers diagnose and resolve issues faster and more efficiently.
Standout Features
- Error Monitoring: Captures and groups exceptions with detailed metadata—stack traces, environment, commit context, and affected users.
- Distributed Tracing & Performance Monitoring: Enables end-to-end tracing of slow transactions and API calls to pinpoint bottlenecks.
- Session Replay: Visualizes user sessions—DOM, network activity, and console logs—for intuitive presentation of bugs.
- Release Health Tracking: Tracks crash-free sessions, error rates by release, and integrates with version control to trace regressions and deployment impact.
Key Features
- Error Grouping and Prioritization: Automatically groups similar errors into issues and surfaces the most critical ones.
- Rich Contextual Insights: Provides breadcrumbs, user environment, and commit details to accelerate debugging.
- Language & Framework Support: Broad SDK support across JavaScript, Python, Java, .NET, PHP, mobile SDKs, and more.
- Alerts & Integrations: Real-time notifications via Slack, email, and bi-directional issue sync with tools like Jira.
- Query & Dashboarding (Discover): Search and filter traces, metrics, and events using flexible queries and dashboards.
Pros
- Deep, contextual insights that accelerate error diagnosis
- Built-in session replay delivers front-end visibility into user behavior
- Strong SDK coverage across languages and frameworks
- Tight DevOps integration through alerting and issue tracking workflows
Cons
- Can be cotly for small teams
- Possible error reporting delays
Best for
Engineering teams looking for a developer-friendly, open-source-compatible solution that offers deep error diagnostics, release insight, and user-level visibility with minimal setup.
Pricing & Customer Reviews
- Pricing Model: Free tier available; Paid → Team: $26/month, Business: $80/month, Enterprise: custom
- G2 rating: 4.5/5
- Praised for: Comprehensive error context, ease of use, detailed diagnostics, and excellent session replay UX
- Criticized for: error reporting issues
Sentry vs GlitchTip
GlitchTip focuses on lightweight, open-source error tracking with basic performance metrics, ideal for small or cost-conscious teams. Sentry elevates this with richer context, session replays, distributed tracing, and release health monitoring—all in one polished tool. GlitchTip benefits you with simplicity and cost-effectiveness, but Sentry offers deeper observability and developer experience.
6. SigNoz

Known for
SigNoz is an open-source, OpenTelemetry-native observability platform offering metrics, logs, traces, error monitoring, and alerts within an intuitive interface. Built on a powerful ClickHouse backend, it’s designed for high-volume workloads per day—while offering transparent usage-based pricing and flexible deployment options (self-hosted or cloud).
Standout Features
- MELT: Metrics, logs, traces, dashboards, exceptions, and alerts—all accessible in the dashboard.
- OpenTelemetry-Native Architecture: Seamlessly supports OTEL across languages and frameworks without requiring proprietary agents
- ClickHouse Backend: High-performance, columnar storage engine optimized for petabyte-scale observability analytics
- Flexible Deployment & Simple Pricing: Self-host (free) or cloud deployment with transparent usage pricing ($0.10 per million metric samples, $0.30/GB for logs/traces)
Key Features
- Application Performance Monitoring: Out-of-the-box charts for p99 latency, error rate, Apdex, external call tracing, and DB monitoring
- Distributed Tracing: Rich trace visualization with flame graphs and Gantt charts for pinpointing request bottlenecks
- Logs Management: Full-text log search, powerful query builder, dashboards, and context for correlated debugging
- Metrics & Dashboards: Flexible query builder, formula-based charts, and customizable dashboards using multiple panel types
- Alerts: Threshold-based and anomaly detection alerts, with notification routing to preferred channels
- Infrastructure Monitoring: Built-in host and Kubernetes monitoring correlated with logs, metrics, and traces
Pros
- Open-source and OTEL-native—no vendor lock-in
- Handles high ingestion volumes at competitive cost
- Correlates metrics, logs, and traces efficiently
- Transparent, usage-based pricing with no seat-based costs
Cons
- Advanced features ( e.g., SSO and anomaly detection) and dedicated support are limited to paid plans
Best for
Organizations—from early-stage startups to large engineering teams—that want a self-hosted or cloud-based observability platform providing full telemetry correlation, high ingestion scalability, and transparent billing, particularly those committed to vendor-neutral, OpenTelemetry-native tooling.
Pricing & Customer Reviews
- Pricing Model: Free tier; Logs & Traces: $0.30 per GB ingested; SigNoz Cloud Teams plan recently started at $49/month (no feature gates, unlimited users/hosts).
- G2 rating: 4.6/5
- Praised for: Open-source flexibility, high-performance analytics with ClickHouse, OTEL-native model, and cost transparency
- Criticized for: Limited features in community edition
SigNoz vs GlitchTip
GlitchTip specializes in open-source error tracking and simple uptime/performance monitoring, but lacks full observability and scalable architecture. SigNoz, in contrast, delivers integrated logs, metrics, distributed tracing, alerting, and infrastructure monitoring at scale, all built on a robust, OTEL-native backend—making it a significantly stronger solution for teams needing comprehensive, scalable observability without vendor lock-in.
7. Raygun
Known for
Raygun is a developer-centric monitoring platform focused on delivering deep insights into application health and end-user experience. It’s especially known for its robust Crash Reporting, Real User Monitoring (RUM), and Application Performance Monitoring (APM) capabilities—built to help teams detect, diagnose, and resolve issues impacting user experience quickly.
Standout Features
- Crash Reporting: To speed up debugging, Raygun captures exceptions and aggregates them with detailed context, such as stack traces, user environment, session info, etc.
- Real User Monitoring (RUM): Tracks front-end performance metrics like Core Web Vitals, load times, and errors, offering insight into 실제 user experiences.
- Application Performance Monitoring (APM): Provides server-side insights into transaction latencies, throughput, and performance bottlenecks.
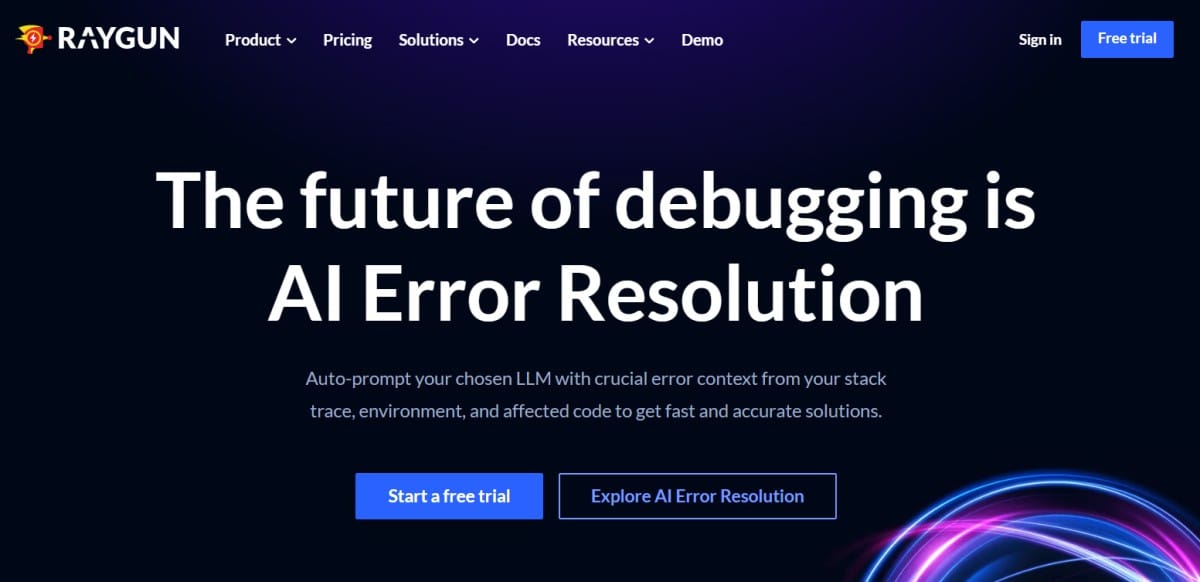
- AI Error Resolution: Integrates AI to auto-compose queries to your preferred LLM, delivering accelerated, accurate diagnostic suggestions based on trace and environment context.
Key Features
- Crash Reporting: Seamless integration across multiple platforms and deep-issue aggregation to prioritize fixes.
- RUM: Monitors client-side experiences in real-time—critical for performance-conscious teams.
- APM: Delivers end-to-end transaction visibility on the server, pinpointing slow operations.
- Integrations & Dashboards: Pre-built widgets and integrations connect errors and performance metrics into your preferred toolchain, with out-of-the-box visualization.
Pros
- User-centric visibility with powerful crash and front-end monitoring
- AI-powered diagnostics accelerate troubleshooting workflows
- Offers error and performance insights in client/server contexts
- Easy onboarding with multi-platform support (for web, server, and mobile)
Cons
- Not a full-stack observability solution (logs and infrastructure monitoring missing)
- SaaS-only no self-hosting
- Error handling issues
Best for:
Development and product teams that prioritize user experience and rapid debugging—especially those managing web and mobile apps—who need precise crash analytics, real user metrics, and fast root-cause resolution powered by AI.
Pricing & Customer Reviews
- Pricing Model: RUM: $80/100k/month; APM: $80/100k/month; Crash Reporting: $40/100k/month
- G2 rating: 4.3/5
- Praised for: Clean UI, strong crash visibility, session-level diagnostics, and intuitive performance tracking
- Criticized for: Limited observability features, error handling issues
Raygun vs GlitchTip
GlitchTip delivers a lightweight, open-source solution focused primarily on error tracking and light performance metrics. Raygun brings richer user-level insights—leveraging crash analytics, front-end performance monitoring, and AI-assisted diagnostics in a polished commercial experience. While GlitchTip works well for simple setups, Raygun arms teams with deeper, user-centric observability—especially in client-heavy, performance-driven applications.
Conclusion: Which Is the Best GlitchTip Alternative
GlitchTip delivers straightforward error tracking and basic uptime and performance monitoring. But it offers limited observability features, and self-hosting can be complex to set up, especially for smaller teams.
CubeAPM solves these challenges with full-stack observability, OpenTelemetry-native architecture, smart sampling, flexible self-hosting, and enterprise-grade integrations. Its intuitive dashboards, responsive support, and cost-effectiveness ($0.15/GB of ingested data) make it ideal for organizations seeking both depth and affordability.
Start your free trial with CubeAPM today.
Disclaimer: The information in this article reflects the latest details available at the time of publication and may change as technologies and products evolve.
FAQs
1. What is the best alternative to GlitchTip for full-stack observability?
While GlitchTip is strong in error tracking, CubeAPM stands out as the best alternative for full-stack observability. It offers complete MELT coverage, OpenTelemetry-native support, smart sampling, pure self-hosting, and cost-efficiency.
2. How does CubeAPM compare to GlitchTip in terms of pricing?
GlitchTip’s pricing can scale up with higher event volumes, whereas CubeAPM offers predictable, competitive rates for large-scale telemetry ingestion. This makes CubeAPM cost-effective for teams handling millions of events per month with just $0.15/GB of ingested data.
3. Does CubeAPM offer both infrastructure and app monitoring?
Yes. CubeAPM provides unified monitoring for applications, infrastructure, logs, traces, metrics, and events, ensuring seamless correlation across the entire stack.
4. Which GlitchTip alternative offers the most integrations?
CubeAPM supports 800+ integrations, covering cloud services, CI/CD pipelines, collaboration tools, and alerting platforms.
5. Is CubeAPM suitable for compliance-heavy industries?
Absolutely. CubeAPM allows data storage in your own cloud or on-premise, supporting compliance with regulatory standards.


