Even a moment of downtime can be devastating— a single hour of downtime costs over $100,000 annually, according to Gartner’s widely-cited analysis. Traditional error-tracking tools often fall short: they generate noisy alerts without intelligent grouping, charge per-error fees that scale unpredictably.
CubeAPM brings error monitoring into focus with Smart Sampling that cuts noisy alerts, error grouping and prioritization, and one-click correlation of errors with traces and logs for instant root cause analysis. Teams get unlimited retention at no extra cost, on-prem deployment for compliance, and fast Slack/WhatsApp support in minutes—all bundled into its flat $0.15/GB pricing with error tracking included free.
In this guide, we’ll review the top error tracking tools, compare their features, pricing, and pros and cons — and show why CubeAPM stands out as the most cost-effective, compliance-ready alternative.
Top 8 Error Tracking Tools
- CubeAPM
- Datadog
- New Relic
- Dynatrace
- Sentry
- Rollbar
- Raygun
- Better Stack
What Is Error Monitoring & Why It Matters
![]()
Error monitoring is the continuous process of tracking, detecting, and analyzing application errors in real time to ensure software reliability and a seamless user experience. Unlike traditional logging, which requires engineers to sift through raw log files, error monitoring tools automatically capture exceptions, stack traces, context (such as environment, device, and user actions), and frequency trends.
By integrating error monitoring into the development and production lifecycle, teams can:
- Detect issues early before customers report them.
- Prioritize fixes based on severity, user impact, and business context.
- Correlate errors with releases to spot regressions introduced by new deployments.
- Accelerate root cause analysis, reducing mean time to resolution (MTTR).
In short, error monitoring is not just about finding bugs—it’s about protecting application reliability, user satisfaction, and business continuity.
How CubeAPM Handles Error Monitoring
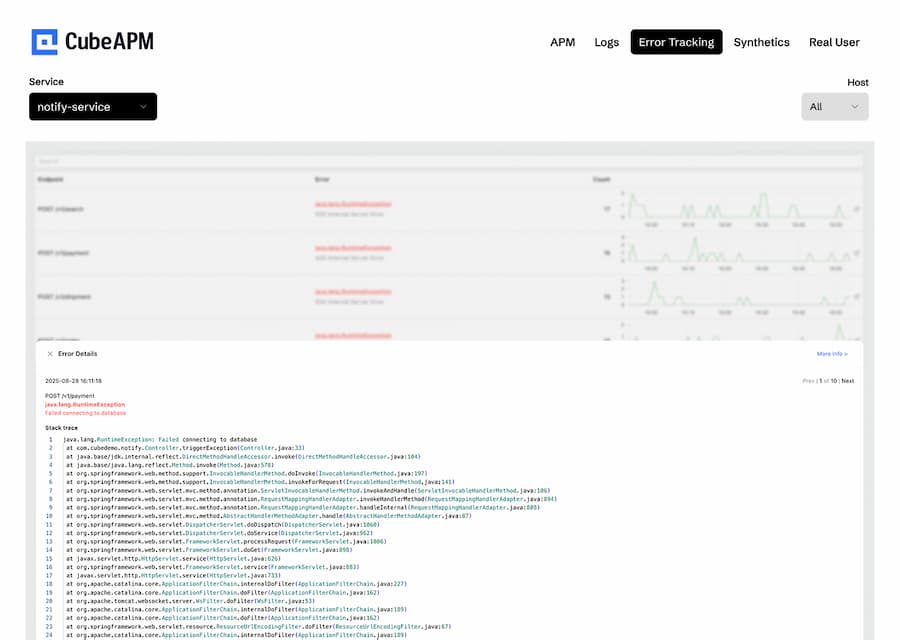
In CubeAPM’s APM dashboard, errors are surfaced directly inside the trace graph view. When a request fails, the affected span is highlighted, showing exactly where in the service flow the error occurred. Developers can drill down to:
- Trace-level context: See the exact span that threw the error, its latency, and related dependencies.
- Log correlation: One click from the error span opens the relevant logs for full stack trace details.
- Error grouping: Recurring exceptions are grouped together, so engineers see patterns instead of duplicates.
- Impact analysis: Errors are tied to user sessions and upstream latency, showing how failures affect the end-user experience.
Why Look for Error Tracking Tools?
Even though error tracking is essential, many existing tools fall short in critical areas. Here are the real, pain-point reasons teams seek better solutions:
1. Improving Customer Experience
End users rarely take the time to report bugs, which means teams need proactive systems to detect errors before they snowball. Modern error tracking tools capture not only stack traces but also session data and performance metrics, ensuring developers can spot failures in real time. When paired with APM and distributed tracing, teams can connect user-visible issues with backend bottlenecks—keeping digital experiences smooth and customer trust intact.
2. Reducing Revenue Loss
Uncaught errors in checkout flows, payment gateways, or high-traffic APIs directly translate into lost revenue. Error tracking prevents this by flagging critical incidents early, before they impact conversions. With enterprise-grade monitoring, teams can correlate errors with business KPIs and take action faster, ensuring reliability in revenue-critical systems like e-commerce, fintech, or SaaS platforms.
3. Boosting Developer Productivity
Without dedicated monitoring, engineers often spend hours sifting through log files just to isolate a single bug. Modern error monitoring tools centralize logs, errors, and traces in one view, drastically cutting down investigation time. By combining error data with APM metrics, teams can see whether an incident stems from infrastructure, a database, or application code—freeing developers to focus on building features instead of firefighting.
4. Keeping Release Velocity High
For teams practicing CI/CD, shipping fast is a competitive edge. But rapid releases increase the risk of introducing regressions. Error tracking tools act as a safety net for high-velocity pipelines, automatically flagging issues tied to specific builds or commits. When combined with distributed tracing and release metadata, this allows developers to roll forward confidently, knowing any issue can be traced back to its source and fixed quickly.
5. Supporting Compliance & Reliability
Industries like healthcare, finance, and government face strict compliance and uptime requirements. Error tracking provides a system of record for failures, ensuring incidents are logged, assigned, and remediated in line with audit requirements. When integrated with enterprise monitoring platforms, these tools support SLA reporting, improve accountability, and help organizations prove reliability during audits.
6. Accelerated Root-Cause Analysis
The faster teams can pinpoint why something broke, the less impact it has on customers and revenue. Error tracking tools enrich errors with stack traces, user context, and environment details, making it easier to diagnose problems. Combined with distributed tracing, teams can follow the entire request path across microservices to see exactly where a breakdown occurred—cutting root-cause analysis from days to minutes.
Top Error Tracking Tools
1. CubeAPM

Known For
An OpenTelemetry-native full-stack observability platform offering error tracking, logs, metrics, traces, RUM, and synthetics in one stack.
Key Features
- Distributed tracing across microservices
- Infrastructure and database monitoring
- Real User Monitoring (RUM) + synthetic checks
- Unified MELT (Metrics, Events, Logs, Traces) coverage
Error-Tracking Specific Features
- Error Inbox with grouping and prioritization
- Smart Sampling that retains high-value errors while cutting noise
- Correlation: One-click pivot between error → trace → logs → metrics.
- Unlimited Retention: Error history stored without extra fee
- Unlimited retention at no extra cost
- Correlation of errors with logs and traces for full root-cause visibility
Pros
- 60–80% lower cost than incumbents
- Self-hosted/on-prem option for compliance (GDPR, HIPAA, SOC 2)
Cons
- Not suited for teams looking for off-prem solutions
- Strictly an observability platform and does not support cloud security management
Pricing
- Flat pricing of $0.15/GB ingestion
CubeAPM Error Tracking Pricing at Scale
*All pricing comparisons are calculated using standardized Small/Medium/Large team profiles defined in our internal benchmarking sheet, based on fixed log, metrics, trace, and retention assumptions. Actual pricing may vary by usage, region, and plan structure. Please confirm current pricing with each vendor.
For a mid-sized SaaS company ingesting 45TB(~45,000) total monthly data ingestion and 45,000TB of observability data outcharged by the cloud provider, the total cost will be about ~$7200/month.
Tech Fit
Best for mid-size to enterprise teams that need compliance, predictable costs, and deep OTEL integration.
2. Datadog
Known For
Datadog is a leading enterprise SaaS observability platform, covering infrastructure, APM, logs, and error tracking with broad integrations.
Key Features
- Over 900+ out-of-the-box integrations
- Infrastructure & application performance monitoring
- Log management, security monitoring, and synthetics
- Centralized dashboards for DevOps and SRE teams
Error-Tracking Specific Features
- Error monitoring bundled into APM and Logs
- Grouping of exceptions with stack traces and context
- Correlation between errors and traces for debugging
- Alerting with anomaly detection
Pros
- Huge ecosystem with integrations across cloud providers and frameworks
- Strong visualization and customizable dashboards
- Reliable SaaS model with global availability
Cons
- Expensive at scale.
- Initial setup is complex, requiring expertise.
- Smaller teams often feel overwhelmed by its breadth.
Pricing
- APM (Pro Plan): $35/host/month
- Infra (Pro Plan): $15/host/month
- Ingested Logs: $0.10 per ingested or scanned GB per month
Datadog Error Tracking Pricing At Scale
For a mid-sized SaaS company operating 125 APM hosts, 40 profiled hosts, 100 profiled container hosts, 500,000,000 indexed spans, 200 infra hosts, 1,500,000 container hours, 300,000 custom metrics, and ingesting around 10TB(~10,000 GB) of logs per month with 3500 indexed logs, the monthly cost would be around ~$27,475/month.
Tech Fit
Best for large enterprises with complex environments and budgets to match, especially those already invested in Datadog’s ecosystem.
3. New Relic
Known For
New Relic is one of the oldest APM and observability platforms, offering broad application monitoring, error tracking, and performance insights.
Key Features
- Full-stack monitoring: APM, logs, infrastructure, synthetics, and RUM
- Advanced visualization and query language (NRQL)
- Cloud-native integrations across AWS, GCP, and Azure
- Alerting and anomaly detection
Error-Tracking Specific Features
- Error analytics dashboard for tracing issues to code-level detail
- Stack trace capture for unhandled exceptions
- Error grouping to reduce alert noise
- Correlation of errors with transactions and user sessions
Pros
- Mature ecosystem with deep integrations
- Long history in APM with strong dashboards
- Enterprise-ready features like SSO and compliance add-ons
Cons
- High costs due to per-user and data retention pricing.
- Complex initial setup
- Overwhelming UI, especially for beginners
Pricing
- Free Tier: 100GB/month ingested
- Pro plan: $0.40/GB ingested beyond the free 100GB limit
- Pro Plan: $349/user for full platform user
New Reclic Error Tracking Pricing At Scale
A mid-sized SaaS company ingesting 45TB (~45,000 GB) of telemetry data per month and with 10 full users, the cost would come around ~$25,990/month.
Tech Fit
Best suited for enterprises already invested in New Relic’s ecosystem who prioritize visualization depth and don’t mind higher licensing costs.
4. Dynatrace
Known For
Dynatrace is an AI-driven observability platform with deep automation, popular among large enterprises for cloud and hybrid infrastructure monitoring.
Key Features
- OneAgent auto-discovery for apps and infra
- AI engine (Davis AI) for anomaly detection and root-cause analysis
- Application performance monitoring (APM) with distributed tracing
- Infrastructure, network, and security monitoring
- Strong dashboards with real-time analytics
Error-Tracking Specific Features
- Automatic error detection and classification across services
- Root-cause analysis powered by Davis AI
- Error dashboards linking application, user, and infra impact
- Release tracking with error correlation to deployments
Pros
- Market-leading automation with minimal manual setup
- Strong at correlating errors to business KPIs
- Powerful for large, complex enterprise environments
Cons
- High cost and complex licensing; pricing is rarely transparent
- Steep learning curve with advanced configuration needs
Pricing
- Infrastructure Monitoring: $29/mo/host
- Full-Stack Monitoring: $58/mo/8 GiB host
Dynatrace Error Tracking Pricing At Scale
A midsized SaaS company operating 125 APM hosts, 200 infra hosts, 10TB(~10,000 GB) of ingested logs, 300,000 custom metrics, 1,500,000 container hours, and 45,000GB of observability data out(charged by cloud provider), the cost would come around ~$21,850/month.
Tech Fit
Best for large enterprises with complex hybrid/multi-cloud environments that need AI-driven automation and are comfortable with premium pricing.
5. Sentry
Known For
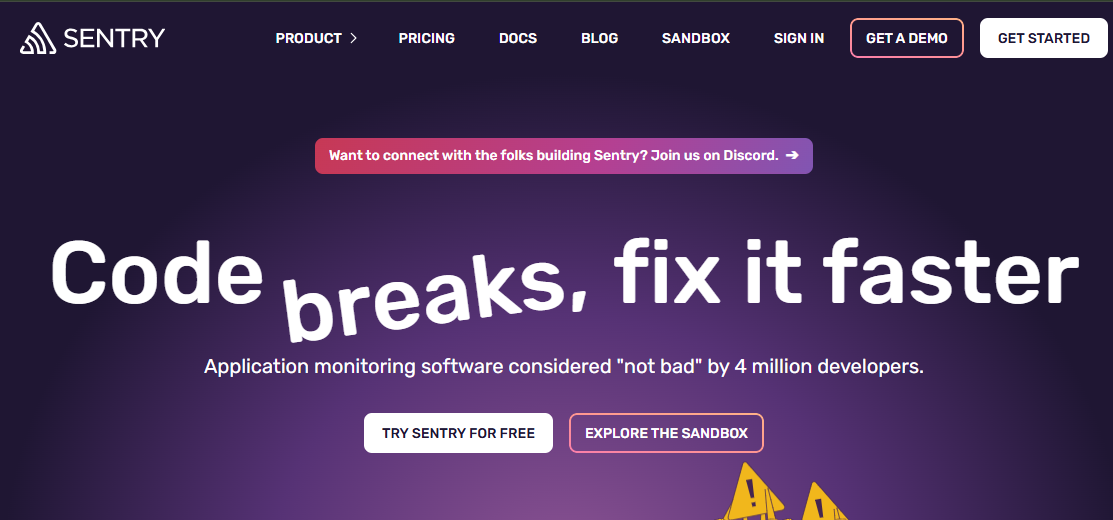
Sentry is the most popular standalone error tracking tool, widely adopted by developers for its language SDKs and simplicity.
Key Features
- Broad SDK support (JavaScript, Python, Java, Go, PHP, mobile)
- Application performance monitoring (basic APM add-on)
- Dashboards and release tracking
- Issue assignment and workflow integrations (Jira, Slack, GitHub)
Error-Tracking Specific Features
- Real-time error and exception capture
- Rich context: stack traces, environment data, and breadcrumbs
- Error grouping to reduce duplicates
- Release tracking to connect errors with specific deployments
Pros
- Excellent developer adoption and ecosystem
- Easy setup with client SDKs
- Active open-source base and community edition
- Strong integrations with CI/CD workflows
Cons
- Costs scale sharply with event volume
- No native support for infrastructure metrics, logs
- Complex configuration setup
- Expensive at scale
- Delays in error reporting, alerts, and display
Pricing
- Developer: free includes 1 user, error monitoring and tracing.
- Team: $26/month includes everything in developer + unlimited users, third-party integrations.
- Business: $80/month includes everything in team + insights (90-day lookback), unlimited custom dashboards
Sentry Error Tracking Pricing At Scale
For a mid-sized SaaS company ingesting 10,000 TB (~10,000GB) of logs, 500,000,000 indexed spans, and 45,000GB of observability data (charged by the cloud provider), the cost would come around $12,100/month.
Tech Fit
Best for developer-heavy teams and startups needing simple, code-level error monitoring without heavy observability overhead.
6. Rollbar
Known For
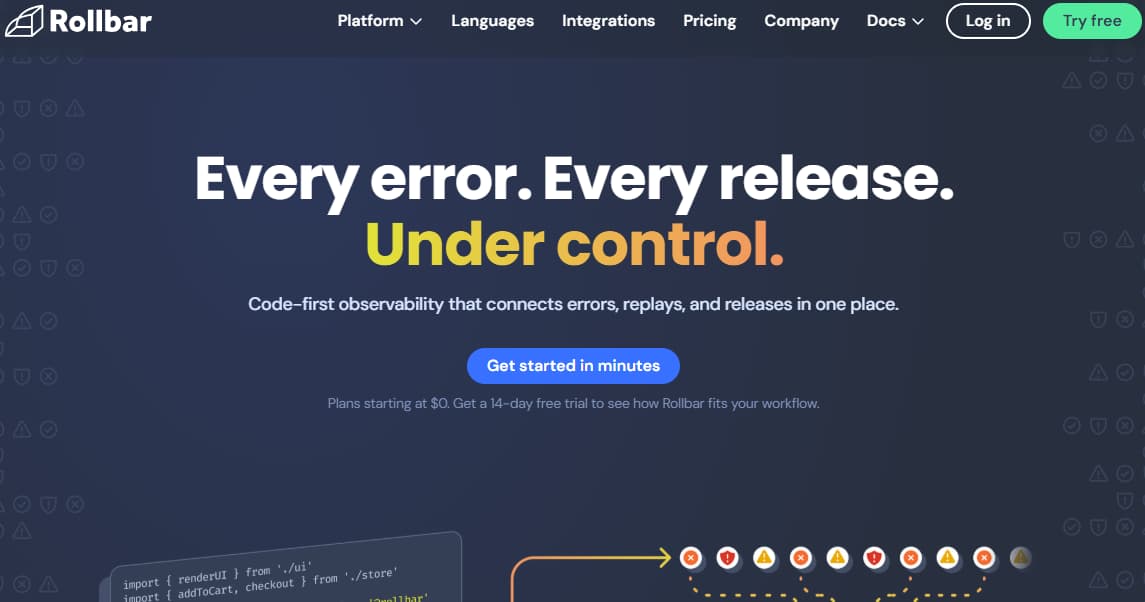
A continuous error monitoring tool focused on intelligent grouping and real-time insights for developers.
Key Features
- Wide SDK support for backend and frontend apps
- Machine learning–driven error grouping
- Workflow integrations with Jira, GitHub, PagerDuty
- Release tracking and deployment insights
Error-Tracking Specific Features
- Continuous error collection with ML-based deduplication
- Root cause hints with stack traces and payloads
- Context-rich error dashboard
- Custom fingerprinting for error classification
Pros
- Reduces noise with smart grouping
- Lightweight and fast integration for dev teams
- Good developer-centric features like release impact
Cons
- Scaling costs rise quickly with large error volumes
- Steep learning curve for new users
Pricing
- Free: 25K error events/month
- Essentials: starts at $21/month (100K error events)
- Advanced: around $125/month (1M error events)
- Enterprise: custom pricing for higher volumes
Rollbar Error Tracking Pricing At Scale
For a midsized company logging 10M errors/month, Rollbar’s Enterprise pricing starts around $2,083/month ($25K ÷ 12). With additional charges for higher event volumes, data retention, and SLAs, real-world costs often exceed $3K/month.
Tech Fit
Ideal for small to mid-sized dev teams that want affordable error monitoring without needing full APM.
7. Raygun
Known For
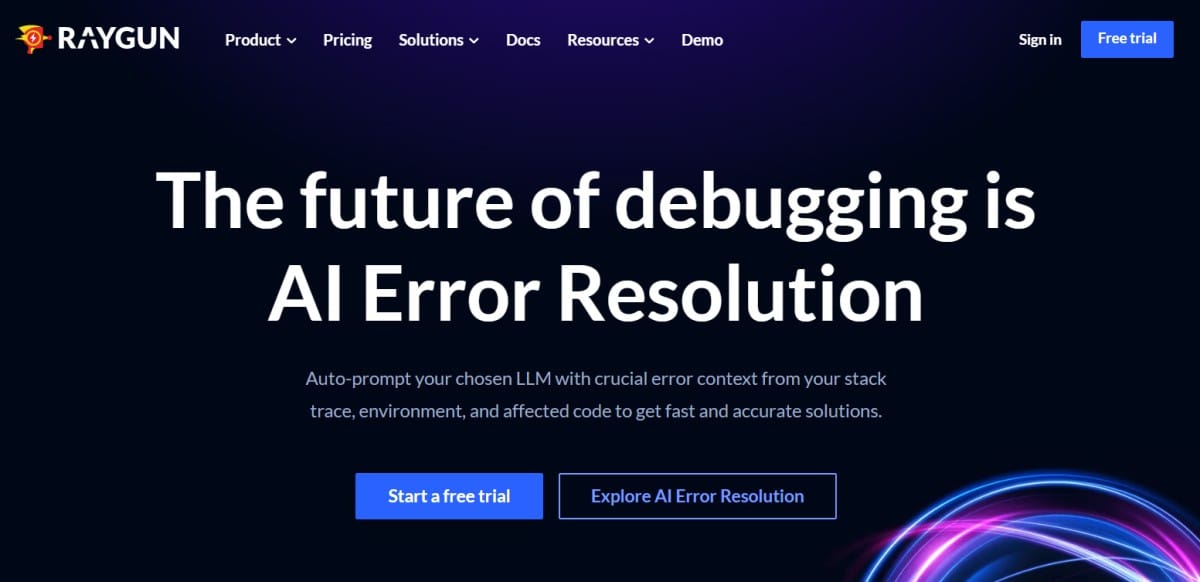
A developer-focused error tracking and crash reporting tool that also includes Real User Monitoring (RUM) and APM features.
Key Features
- Crash reporting for web, mobile, and desktop apps
- RUM for user session insights
- Lightweight APM with traces and performance monitoring
- Integrations with Slack, Jira, GitHub, and CI/CD pipelines
Error-Tracking Specific Features
- Real-time error and crash detection
- Detailed stack traces with environment data and breadcrumbs
- Error grouping and prioritization for faster triage
- Deployment tracking to connect errors with releases
- Crash reporting for mobile apps (iOS, Android)
Pros
- Strong mobile and front-end error monitoring support
- Combines error tracking with RUM for end-to-end user visibility
- Easy to set up with developer-friendly SDKs
- Good mid-market adoption
Cons
- Costs can scale quickly as usage grows
- Overwhelming UI limits usability
Pricing
- APM: starts $80/100k/month
- RUM: starts $80/100k/month
- Crash Reporting: starts $40/100k/month
- SAML SSO (add-on): $50/month
- Usage capping (add-on): $40/month
Raygun Error Tracking Pricing at Scale
For a midsized company handling 10M errors/month, 1M RUM sessions, and 1M traces, Raygun’s costs add up quickly. Crash Reporting at $40/100K (10M ÷ 100K × $40 = $4,000), RUM at $80/100K (1M ÷ 100K × $80 = $800), and APM at $80/100K (1M ÷ 100K × $80 = $800) total $5,600/month, plus SAML SSO ($50) and usage capping ($40), bringing it to about $5,690/month.
Tech Fit
Best for SaaS and consumer app teams needing strong mobile + front-end error monitoring along with RUM, without going full enterprise APM.
8. Better Stack
Known For
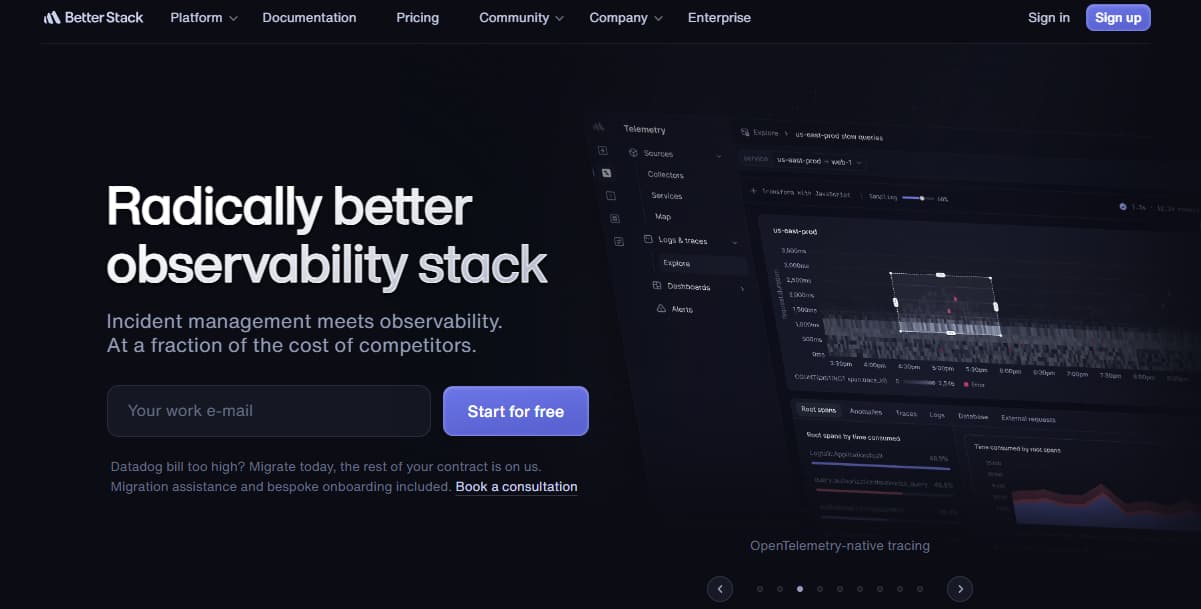
A modern logging and monitoring platform that combines uptime monitoring, log management, and error tracking with a clean developer-friendly UI.
Key Features
- Log management with SQL-like queries
- Uptime & incident monitoring with status pages
- Team collaboration features (Slack, Discord, PagerDuty)
- Dashboards for application and service health
Error-Tracking Specific Features
- Error log aggregation and search across services
- Real-time alerts on critical exceptions
- Error correlation with uptime incidents and logs
- Grouping to cut duplicate error noise
Pros
- Transparent pricing compared to incumbents
- Strong collaboration features for DevOps/SRE teams
- Clean UI and quick setup
- Combines uptime + logs + errors in one platform
Cons
- Expensive when scaling operations.
- Users report missing features like outgoing webhooks that limit usability.
- Steep learning curve.
- Complex initial setup and configuration.
Pricing
- Free tier available for personal projects
- Logs: $0.15/GB
- Metrics: $7.50, 2TB included
- Errors: $0.000075/exception
Better Stack Error Tracking Pricing At Scale
For a mid-sized SaaS company operating 125 APM hosts, ingesting 25TB(~25, OOOGB) of data by APM hosts, 10TB (~10,000GB) of logs, 10TB (~10,000GB) of infra hosts, and 45,000GB of observability data (charged by the cloud provider), the cost would come around $20,550/month.
Tech Fit
Best for startups and mid-sized SaaS teams that want affordable logging and error tracking with strong uptime monitoring, without needing full enterprise-grade observability.
Conclusion
Error tracking has become a cornerstone of modern observability. While tools like Sentry, Rollbar and Raygun provide strong developer-focused monitoring, and platforms like Datadog, New Relic, and Dynatrace deliver enterprise coverage, they often come with hidden costs, alert fatigue, and compliance gaps.
CubeAPM solves these challenges with an OpenTelemetry-native platform that unifies error tracking, logs, metrics, traces, and RUM. With 60–80% lower costs, smart sampling to reduce noise, and on-premise options for compliance, it gives teams the visibility they need without runaway bills.
If you’re looking for the most cost-effective, compliance-ready, and developer-friendly error tracking tool, CubeAPM is the clear choice.
Disclaimer: The information in this article reflects the latest details available at the time of publication and may change as technologies and products evolve.
FAQs
1. Which error tracking tool offers the best value for money?
Most legacy platforms like Datadog and New Relic charge per user or per error, driving costs up at scale. CubeAPM provides error tracking free with its $0.15/GB ingestion model.
2. What is the most compliance-friendly error tracking tool?
For industries under GDPR, HIPAA, or SOC 2, compliance is critical. CubeAPM supports on-prem and self-hosted deployments, ensuring data residency and full control, unlike SaaS-only vendors that store data outside local regions.
3. Which tool reduces alert fatigue and error noise the best?
CubeAPM uses Smart Sampling that prioritizes errors based on context (latency, impact, severity), keeping only high-value events. This cuts alert noise dramatically compared to probabilistic sampling used by older tools.
4. What is the best error tracking tool for full-stack observability?
Unlike standalone trackers like Sentry or Rollbar, CubeAPM unifies error tracking with logs, metrics, traces, RUM, and synthetics. This gives developers complete visibility into how errors affect the entire stack.
5. Which error tracking tool provides the fastest support?
Most vendors rely on ticketing systems with multi-day response times. CubeAPM offers Slack and WhatsApp support directly with core engineers, with a turnaround time of minutes, not days.


