Sentry has earned its place as a leading application monitoring tool, known for its real-time error tracking, release health insights, and tight integration with Git-based developer workflows. However, Sentry’s developer-centric focus becomes a limitation as it lacks comprehensive observability features like infrastructure metrics.
CubeAPM is the best alternative to Sentry as it provides full infrastructure monitoring out of the box. CubeAPM provides real-time visibility into hosts, containers, Kubernetes workloads, and cloud resources. This provides teams with true full-stack observability, making CubeAPM a significantly more comprehensive solution for modern distributed systems.
In this article, we’ll explore why teams are moving away from Sentry and evaluate the top 7 Sentry alternatives in 2025, comparing observability depth, pricing models, deployment flexibility, and OpenTelemetry readiness
Top 7 Sentry Alternatives
- CubeAPM
- Datadog
- Dynatrace
- Splunk AppDynamics
- Grafana
- Coralogix
- New Relic
APM Tools Comparison: Sentry vs CubeAPM vs Others (2025)
| Tool | *Pricing (Small, Mid, Large) | OTEL Native | Support TAT | Deployment Option |
| CubeAPM | Small: $2,080 Mid: $7,200 Large: $15,200 | Yes | Within minutes | Self-hosted |
| Sentry | Small: $3,560 Mid: $12,100 Large: $32,400 | No | hrs to days | SaaS and Self-hosted |
| Datadog | Small: $8,185 Mid: $27,475 Large: $59,050 | No | 2hrs to 2 business days | SaaS only |
| Dynatrace | Small: $7,740 Mid: $21,850 Large: $46,000 | No | 4hrs to 4 business days | SaaS and Self-hosted |
| Splunk AppDynamics | Small: $2,650 Mid: $9,825 Large: $20,150 | No | 2hrs to days | SaaS and Self-hosted |
| Grafana | Small: $3,870 Mid: $11,875 Large: $26,750 | Yes | 2hrs to 6hrs | SaaS and Self-hosted |
| Coralogix | Small: $4,090 Mid: $13,200 Large: $29,000 | Yes | Within minutes | SaaS only |
| New Relic | Small: $9,366 Mid: $32,115 Large: $70,220 | No | 1hr to 2 business days | SaaS only |
*All pricing comparisons are calculated using standardized Small/Medium/Large team profiles defined in our internal benchmarking sheet, based on fixed log, metrics, trace, and retention assumptions. Actual pricing may vary by usage, region, and plan structure. Please confirm current pricing with each vendor.
*OTEL Sources: Datadog uses proprietary SDKs; Dynatrace uses collectors; Splunk AppDynamics uses collectors
Why Look for Sentry Alternatives?
Teams are increasingly seeking Sentry alternatives due to the following growing pain points:
1. Limited Scope Beyond Errors
Sentry excels at code-linked error tracking, offering detailed stack traces and developer-friendly diagnostics. However, it lacks support for infrastructure logs, critical for holistic observability in microservices. Teams must integrate additional tools like Datadog for APM or Grafana for metrics, creating fragmented workflows. This increases complexity, slows debugging, and raises costs, as Sentry alone can’t monitor infrastructure health or service dependencies.
2. Lacks Native OpenTelemetry Support
Modern observability relies on OpenTelemetry for vendor-neutral instrumentation. Sentry’s OTel support is limited, acting as a consumer rather than a native producer, and requires its SDK for full functionality, complicating integration.
Alternatives like CubeAPM offer native OTel support, enabling flexible, standardized telemetry collection across diverse systems without proprietary constraints, ensuring scalability and interoperability for microservices teams aiming to future-proof their observability stack.
3. No Infrastructure Visibility
Sentry focuses on application-level error tracking, lacking native infrastructure or backend visibility like Kubernetes node metrics or service dependency monitoring. This leaves SREs blind to underlying system health, forcing reliance on tools like Prometheus or Datadog for container orchestration or network insights.
For microservices, where infrastructure issues often cause application errors, this gap slows root-cause analysis. Alternatives like Dynatrace or Splunk AppDynamics offer comprehensive infrastructure monitoring alongside APM, providing end-to-end visibility and enabling faster, more informed debugging for platform teams managing complex systems.
4. Delays in Error Reporting
Some end-users find that Sentry doesn’t always display new errors in real time, especially during traffic spikes or high event volume. Because Sentry processes events asynchronously, issues can appear seconds or minutes late, which slows down on-call response and makes real-time incident visibility harder at scale.
5. Complex Configuration
While Sentry is easy to start with, configuring it for larger, distributed systems can become complex. Setting up advanced alert rules, tuning performance monitoring, managing multiple environments, and integrating custom traces often requires significant manual work and ongoing adjustments. As applications scale, this configuration overhead grows, pushing some teams to look for tools with simpler, more automated setup.
Criteria for Suggesting Sentry Alternatives
We evaluated Sentry alternatives based on the growing needs of modern observability teams—balancing depth, flexibility, and operational control:
1. Full MELT Observability (Metrics, Events, Logs, Traces)
A top criterion is full MELT stack support; metrics, events, logs, and traces should be unified out of the box. Sentry’s error-focused approach leaves gaps in metrics and distributed tracing, forcing teams to stitch together tools like Prometheus or ELK, slowing incident response. The APM tool should integrate all MELT pillars, offering a single platform for correlating errors with infrastructure, enhancing visibility across microservices. This reduces interconnecting too many tools, boosts efficiency, and meets the demand for end-to-end observability in dynamic environments.
2. Native OpenTelemetry & Prometheus Support
Native OpenTelemetry (OTEL) and Prometheus support is vital for modern platforms, ensuring portable, scalable instrumentation across services. Sentry’s partial OTEL consumption lacks native production, making integration challenging. Alternatives should provide seamless native OTEL support, enabling vendor-neutral telemetry collection. This flexibility avoids vendor lock-in, supports multi-cloud setups, and aligns with industry shifts toward open standards, critical for teams managing diverse, evolving microservices architectures.
3. Cross-Team Usability
Best-in-class tools should serve developers, DevOps, SREs, and platform teams with tailored workflows like service maps, error inboxes, and trace views.
Cross-team usability is a necessity. The best tools should serve developers, DevOps, SREs, and platform teams with tailored workflows. Sentry’s developer-centric error inboxes fall short for SREs who need service maps or platform teams requiring trace views.
Top alternatives should offer role-specific dashboards, including error tracking for devs, infrastructure maps for SREs, thus enhancing collaboration. This unified experience reduces huge data silos, speeds up debugging across microservices, and supports diverse team needs, from code-level insights to system-wide performance, making it essential for agile, multi-disciplinary operations.
4. Smarter Alerting & RCA Tools
Smarter alerting and root cause analysis (RCA) tools are prioritized to cut mean time to resolution (MTTR). Sentry’s basic alert rules lack anomaly detection or dynamic thresholds, often making teams focus on less important issues and not the real signals. Alternatives should leverage AI for anomaly spotting and automated RCA, pinpointing issues like latency spikes in real-time. This proactive approach reduces manual effort, enhances incident response, and ensures uptime in high-stakes microservices, where rapid problem-solving is non-negotiable for DevOps teams managing complex, distributed systems.
5. Predictable, Scalable Pricing Models
Predictable, scalable pricing is crucial, as event-based models like Sentry’s penalize growth with overages. Teams need transparent costs that scale with usage without surprises. Alternatives like CubeAPM offer ingestion-based pricing, while Grafana provides flat-rate or open-source options, aligning with microservices’ dynamic workloads. This stability supports budgeting for scaling teams, avoiding Sentry’s unpredictable spikes during traffic surges, and ensures cost-effective observability as infrastructure and data volumes grow, a key factor for long-term operational planning.
6. Smart Sampling or Tail-Based Sampling
Smart sampling is a must for high-volume applications, as telemetry generates massive data. Sentry employs random edge sampling, losing critical insights. CubeAPM’s smart sampling uses deep context, like comparing current API latency to usual rates to prioritize key data, boosting signal-to-noise ratio. This handles heavy traffic efficiently with fewer resources, unlike Sentry’s head-based approach, which risks missing vital traces. For microservices teams needing precise, cost-effective observability, this scalability and accuracy make smart sampling a top criterion, driving demand for CubeAPM over Sentry’s less adaptive method.
7. Ease of Use
Ease of use is a critical criterion for Sentry alternatives, enabling rapid adoption across diverse teams. Sentry’s developer-centric interface can overwhelm non-technical users with complex configurations. Top alternatives, like CubeAPM, offer intuitive dashboards and streamlined onboarding, requiring minimal setup for monitoring microservices.
8. Integrations
Robust integrations are vital for Sentry alternatives, ensuring seamless connectivity with existing tech stacks. Sentry’s integration ecosystem, while broad, lacks deep compatibility with some modern tools like Kubernetes.
This connectivity bridges observability with operational workflows, enabling end-to-end visibility across microservices and third-party services. For teams relying on diverse platforms, strong integrations reduce silos, accelerate incident response, and align with DevOps practices, making them a cornerstone for scalable, integrated observability solutions.
Sentry Overview
Known for:
Sentry is known as a developer-first application monitoring tool specializing in real-time error tracking, release health monitoring, and Git-integrated debugging workflows. It’s a favorite among frontend and backend teams who want visibility into app crashes, unhandled exceptions, and performance bottlenecks tied directly to code changes.
Standout Features
- Code-linked stack traces for rapid debugging
- Release health dashboards showing crash-free sessions and adoption
- Deep GitHub/GitLab integration for commit-level issue resolution
Key Features
- Error and Exception Monitoring: Sentry captures unhandled exceptions, crashes, and performance slowdowns across web, mobile, and backend apps automatically.
- Release Tracking: Tracks errors and stability across application versions. Developers can monitor adoption, crash-free rates, and issue regressions tied to specific releases.
- Frontend + Backend Tracing: Supports distributed tracing between frontend events and backend API calls. Developers can view span performance and bottlenecks.
- Source Code Context: Stack traces link directly to source code files and commits, helping teams identify the root cause and the responsible author.
Pros
- Developer-focused UX and workflows
- Git-based release tracking with code-linked stack traces
- Easy setup for JavaScript, Python, Node.js, and mobile SDKs
- Offers both SaaS and self-hosted options
- Lightweight and fast for small teams and rapid CI/CD environments
Cons
- No native support for infrastructure metrics, logs
- Complex configuration setup
- Expensive at scale
- Delays in error reporting, alerts and display
Best For
Product engineering teams that want fast error tracking, release health analytics, and code-centric debugging—without managing full observability complexity.
Pricing & Customer Reviews
- Free: Developer Plan for Solo Devs with limited features
- Paid: Starts at $26/month, depending on event volume
- G2 Rating: 4.6/5
- Customer sentiment: Praised for developer experience and stack trace depth, but often criticized for limited observability and infrastructure blind spots.
Top 7 Sentry Alternatives
1. CubeAPM Overview

Known For
CubeAPM is known for being a modern, OpenTelemetry-native observability platform designed to deliver full MELT stack coverage (Metrics, Events, Logs, Traces) with cost efficiency, smart sampling, and flexible on-prem or SaaS deployment. It is engineered to serve high-scale DevOps, SRE, and platform teams who need reliable, vendor-neutral observability without the complexity or runaway cost of legacy APM tools.
Standout Features
- Smart Sampling Engine with Cost Predictability: CubeAPM’s built-in smart sampling analyzes and drops low-value telemetry at ingest, resulting in up to 80% lower costs compared to event- or span-based billing models like Sentry’s or Datadog’s. This means teams don’t need to reduce visibility to control costs.
- Native OpenTelemetry Architecture: Unlike tools that retrofit OTEL support, CubeAPM is built around OpenTelemetry from day one. It supports native ingestion of OTEL metrics, traces, and logs, making it ideal for organizations embracing vendor-neutral standards.
- On-Premise Deployment: CubeAPM is deployed on self-hosted environments, offering full control over data storage, compliance, and integration, especially valuable for fintech, healthcare.
- End-to-End MELT Stack: Full observability across infrastructure, services, and applications without requiring external tools like Prometheus, Loki, or Tempo.
- Developer-First UX: While more robust than Sentry, CubeAPM still delivers a clean and intuitive experience with trace navigation, error inboxes, deployment markers, and fast root cause triage built in.
Key Features
- MELT Observability in One Platform: Eliminates the need to maintain separate systems for metrics, logs, traces, and events. It offers unified dashboards, queries, and alerting across all telemetry.
- OpenTelemetry-Native Support: Supports 100% OTEL-compliant data, ensuring future-proof observability and compatibility with modern instrumentation standards
- Real-Time Alerting and Incident Response: Faster detection with real-time anomaly alerting, service map-based correlation, and deployment-aware trace analysis.
- Predictable Pricing at Scale: Unlike Sentry or Datadog, pricing is not tied to event count or active user seats, making CubeAPM ideal for growing teams with dynamic traffic.
Pros
- Built from the ground up for OpenTelemetry
- Full MELT support with zero vendor lock-in
- Smart sampling = cost efficiency without reduced visibility
- VPC/self-hosting available for security-first orgs
- Fast onboarding and easy migration from tools like Sentry or Datadog
Cons
- Not suited for teams looking for off-prem solutions
- Strictly an observability platform and does not support cloud security management
Best For
- Engineering orgs seeking lower cost and control over telemetry
- Startups and mid-sized teams scaling fast but watching budgets
Pricing & Customer Reviews
- Pricing: Flat usage-based tiers ($0.15/GB for ingestion), no per-event or per-seat billing
- Rating: 4.6/5 (based on pilot programs, Slack feedback, and demos)
CubeAPM vs Sentry
Sentry is ideal for developers monitoring crashes and frontend performance. But it lacks native OpenTelemetry, and infra-wide trace correlation. CubeAPM, in contrast, offers complete MELT observability, flat pricing, and compliance-ready hosting, making it a better fit for teams needing end-to-end system visibility and control beyond error tracking.
2. Datadog Overview
Known for:
Datadog is best known as an all-in-one SaaS observability platform that combines infrastructure monitoring, APM, logs, security, and UX analytics under one roof. Cloud-native DevOps teams widely use it due to its extensive integration, 900+ integrations, real-time dashboards, and machine learning-based alerting.
Datadog’s broad coverage makes it a powerful alternative to Sentry for teams seeking full-stack observability beyond code-level errors, including Kubernetes health, cloud resource usage, and end-to-end tracing across distributed systems.
Standout Features
- Modular, Cloud-Native Observability: Datadog offers modular products like APM, infra monitoring, RUM, logs, synthetics, and security, allowing teams to pick what they need.
- AI-Powered Monitoring via Watchdog: Built-in ML alerts automatically surface anomalies in metrics and traces, giving DevOps and SRE teams real-time problem insights that Sentry does not offer.
- Massive Integration Ecosystem: With 900+ native integrations (AWS, Azure, Kubernetes, Jenkins, etc.), Datadog seamlessly connects across the modern DevOps stack.
- Unified Telemetry Platform: Unlike Sentry, which focuses only on application-level signals, Datadog offers a central platform for MELT observability with dashboards and alerts that span infra, apps, logs, and UX.
Key Features
- Real-Time Infrastructure & Application Monitoring: Collects metrics, logs, and traces from hosts, containers, cloud services, and code.
- RUM + Session Replay: Gives full visibility into frontend performance and user behavior—helping bridge the gap between UX issues and backend events.
- Full-Stack APM & Trace Search: Offers flame graphs, span summaries, and service maps to analyze performance at code, service, and network levels.
- Security Monitoring (SIEM-lite): Detects threats via log-based rules and integrates with CSPM and workload security.
- Watchdog (AI Anomaly Engine): Proactively surfaces anomalies using ML—reducing noise and uncovering performance regressions without thresholds.
Pros
- Unified MELT observability in one interface
- Excellent integrations with cloud providers and CI/CD tools
- Strong RUM, APM, and session analysis features
- Built-in ML-driven alerting and anomaly detection
- Enterprise-grade dashboards and collaboration workflows
Cons
- Pricing is highly modular and unpredictable
- High total cost at scale
- Lacks OpenTelemetry-first architecture
Best For
DevOps and SRE teams looking for feature-rich, enterprise-scale observability across infra, apps, logs, RUM, and security, and who are comfortable with SaaS-based tools and variable billing.
Pricing & Customer Reviews
- APM (Pro Plan): starting at $35/host/month
- Infra Monitoring (Pro Plan): starting at $15/host/month
- G2 Rating: 4.4/5
- Praised for: Powerful features and integrations
- Criticized for: Cost sprawl, pricing opacity, and complex onboarding
Datadog vs Sentry
Sentry is developer-centric, focusing on error events, stack traces, and release health. Datadog delivers end-to-end observability across the entire stack, including infrastructure and security areas that Sentry doesn’t cover. However, Datadog’s complexity and unpredictable pricing make it a heavier, costlier option, especially for teams with leaner observability needs.
3. New Relic Overview
Known for:
New Relic is best known for its programmable observability platform that provides full-stack visibility across APM, infrastructure, browser, synthetics, logs, and traces, with a strong focus on custom dashboards powered by its proprietary NRQL (New Relic Query Language). It appeals to engineering teams that want highly customizable dashboards, advanced telemetry queries, and seamless integration with cloud-native and legacy systems.
Standout Features
- NRQL-Driven Programmable Dashboards: New Relic allows advanced telemetry querying and visualization through its SQL-like query language, giving developers deep control over observability metrics and dashboards.
- All-in-One MELT Monitoring: Combines metrics, events, logs, and traces (MELT) into a unified interface, unlike Sentry, which focuses primarily on traces and exceptions.
- Smart Anomaly Detection: Automatically detects anomalies across services and telemetry types using dynamic baselining.
Key Features
- Full-Stack APM + Infrastructure Visibility: Auto-instruments major backend frameworks (Java, Python, .NET, Node.js), and correlates them with infrastructure metrics.
- Browser Monitoring + Synthetics: Monitors frontend page load performance and user interactions, and simulates synthetic traffic for uptime checks.
- Telemetry Data Platform: Centralized ingestion engine for OpenTelemetry, StatsD, and Prometheus-compatible data.
- Lookout Anomaly Detection: Smart visual overlays detect abnormal behavior without setting static thresholds.
- Custom Dashboards with NRQL: Offers complete flexibility for querying telemetry data and visualizing it across services and teams.
Pros
- Unified MELT observability with no-code and low-code options
- Strong frontend/backend correlation for root cause analysis
- Customizable dashboards with powerful query support
- Supports OpenTelemetry, cloud-native tools, and legacy systems
- Free tier includes 100 GB/month of ingest and 1 user seat
Cons
- Expensive especially when scaling
- Steep learning curve for NRQL and dashboard configuration
- Complex initiat setup
Best For
Engineering teams who want programmable dashboards, synthetic testing, and full-stack observability in one platform, and can manage usage-based billing and query language complexity.
Pricing & Customer Reviews
- Free tier: 100GB/month
- Pro Plan: $0.40/GB ingested beyond the 100GB free limit
- Pro Plan: $349/month for full platform user
- G2 Rating: 4.3/5
- Praised for: Custom dashboards, visual query power, and unified telemetry
- Criticized for: Pricing unpredictability and NRQL complexity
New Relic vs Sentry
Sentry offers fast, developer-focused error visibility with a limited scope. New Relic, in contrast, delivers comprehensive observability including synthetic checks, browser metrics, infrastructure telemetry, and custom dashboards via NRQL. While New Relic is more feature-rich, it also introduces a steeper learning curve and usage-based pricing model, which might be expensive especially when scaling.
4. Coralogix Overview
Known For
Coralogix is best known as a full-stack observability platform designed to minimize costs through smart routing, customizable log pipelines, indexless ingestion, and stream-first data processing. It’s especially suited for teams with high log volumes and a strong focus on compliance, cost control, and CI/CD observability.
Standout Features
- Streama™ Architecture: Offers in-stream telemetry processing and enrichment, allowing routing, alerting, and analytics before logs are indexed or stored, significantly cutting costs.
- Customer-Controlled Archival: Archived data is routed directly to the customer’s cloud storage (e.g., S3), where Coralogix charges no fee. However, since telemetry passes through Coralogix first, teams still incur public egress costs, which also complicates data localization compliance.
- Indexless Querying and Smart Routing: Teams can choose to stream logs without indexing, archive low-priority telemetry, or visualize real-time data selectively—all of which reduces ingest waste.
Key Features
- Log-Optimized Observability: Initially built for logs, Coralogix has expanded to support metrics, traces, and limited APM functionality, all accessible through unified dashboards.
- Indexless Ingestion Model: Logs can be streamed directly to alerts or dashboards without being indexed, while long-term archival occurs outside Coralogix’s billing layer.
- ML-Based Pattern Detection: Anomaly detection and trend baselining are supported using machine learning, though not as advanced as Datadog’s Watchdog or Dynatrace’s Davis AI.
- GitOps and CI/CD Integration: Observability-as-code support via Git allows version-controlled configuration for routing, indexing, and visualizations—ideal for fast-moving deployment pipelines.
Pros
- Extremely cost-efficient for high-volume logging
- Smart ingestion logic avoids over-indexing
- Customers own archived data and avoid Coralogix storage fees
- Good pipeline flexibility and Git-based observability configuration
- Partial support for OTEL, Prometheus, and backend monitoring
Cons
- Archived data still incurs egress costs from cloud storage routing
- Steep learning curve
- UI can be overwhelming, especially for beginners
Best For
Log-heavy engineering or SecOps teams that need flexible, cost-controlled log management, with downstream export and archive support. Not ideal for teams that require full MELT or in-country data residency enforcement.
Pricing & Customer Reviews
- Logs: $0.42/GB
- Traces: $0.16/GB
- Metrics: $0.05/GB
- G2 Rating: 4.3/5
- Praised for: Stream-based architecture, pipeline flexibility, GitOps features
- Criticized for: Compliance ambiguity (due to archive routing) and APM limitations
Coralogix vs Sentry
Sentry is purpose-built for developers tracking errors and releases. Coralogix, on the other hand, delivers full-stack observability and cost-efficient telemetry routing for large-scale ingest environments. It excels in log control, GitOps automation, and long-term archive cost reduction—making it more attractive for infra teams.
5. Splunk AppDynamics Overview
Known for:
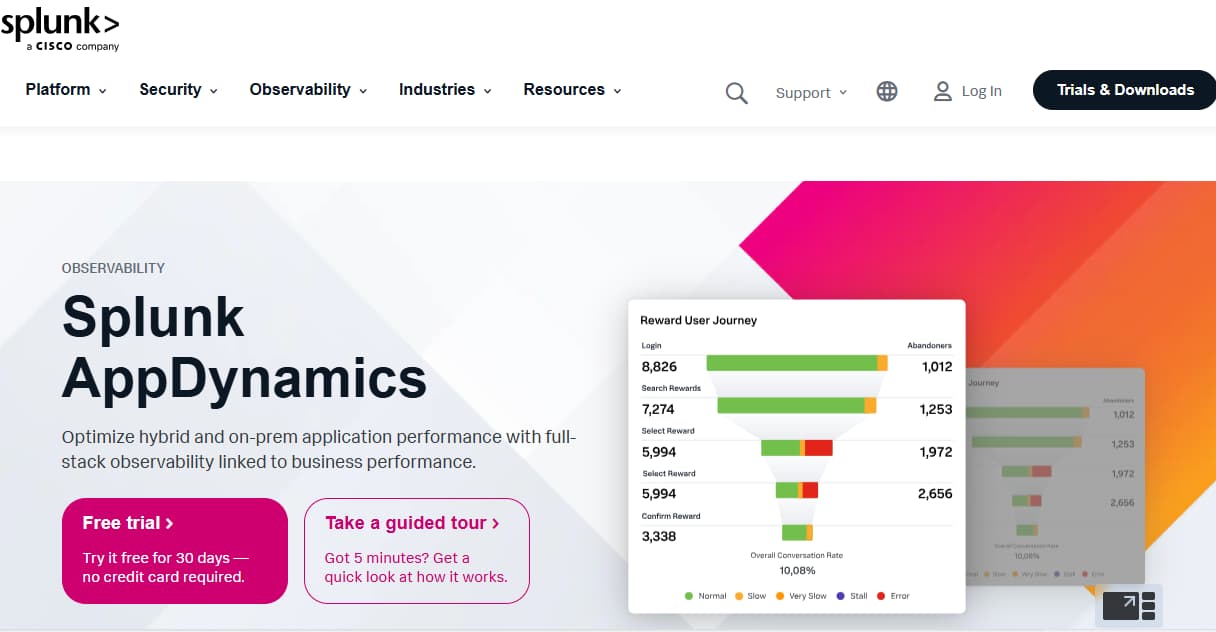
Splunk AppDynamics is known for its deep application performance monitoring (APM) with a strong focus on business transaction tracing, hybrid infrastructure observability, and enterprise-grade security. It stands out for mapping technical metrics to business KPIs, which makes it ideal for teams that care as much about revenue-impacting performance as they do about backend errors.
Standout Features
- Business Transaction Monitoring: Splunk AppDynamics maps individual transactions across services, APIs, and databases, making it easy to identify backend bottlenecks affecting customer-facing functionality.
- Hybrid & On-Prem Deployment Support: Unlike SaaS-only tools like Sentry, Splunk AppDynamics supports on-prem, cloud, and hybrid environments, meeting the needs of regulated and security-conscious industries.
- Cisco Secure Application Integration: Built-in application security detects runtime vulnerabilities alongside performance anomalies—blending DevOps and SecOps use cases.
Key Features
- Application-Centric APM: Provides deep code-level insights for Java, .NET, PHP, Node.js, and more—complete with transaction snapshots, stack traces, and execution timing.
- Real-Time Business Correlation: Tracks KPIs like checkout duration, lead conversion latency, and login performance, connecting app health to revenue-impacting outcomes.
- End-to-End Dependency Mapping: Auto-discovers and maps service dependencies, databases, and external APIs, providing full visibility across distributed systems.
- Hybrid Infrastructure Monitoring: Supports on-premise servers, cloud-native environments, and VMs—ideal for phased cloud migration strategies.
Pros
- Deep APM functionality with strong backend diagnostics
- Clear visibility into business transaction performance
- Hybrid and private cloud deployment flexibility
- Built-in runtime vulnerability monitoring (Cisco Secure App)
- Suitable for compliance-heavy industries
Cons
- UI/UX is legacy-heavy compared to modern tools
- Steep learning curve, especially for beginners
- High cos,t especially for large enterprises
Best For
Large enterprises looking to correlate backend performance with business KPIs, especially in hybrid deployments and industries like finance or healthcare.
Pricing & Customer Reviews
- APM: $33/month/CPU core
- Infrastructure Monitoring: starts at $6/month.CPU core
- RUM: $0.06/month/1000 tokens
- G2 Rating: 4.2/5
- Praised for: Business impact correlation, deep APM insights
- Criticized for: High setup effort, outdated UI, and limited MELT visibility
Splunk AppDynamics vs Sentry
While Sentry is fast to deploy and excels at debugging app-level errors, Splunk AppDynamics is purpose-built for enterprise-grade APM with deeper backend traceability, KPI alignment, and hybrid deployment support. It’s better suited for IT Ops and enterprise teams than frontend-focused developers.
6. Dynatrace Overview
Known for:
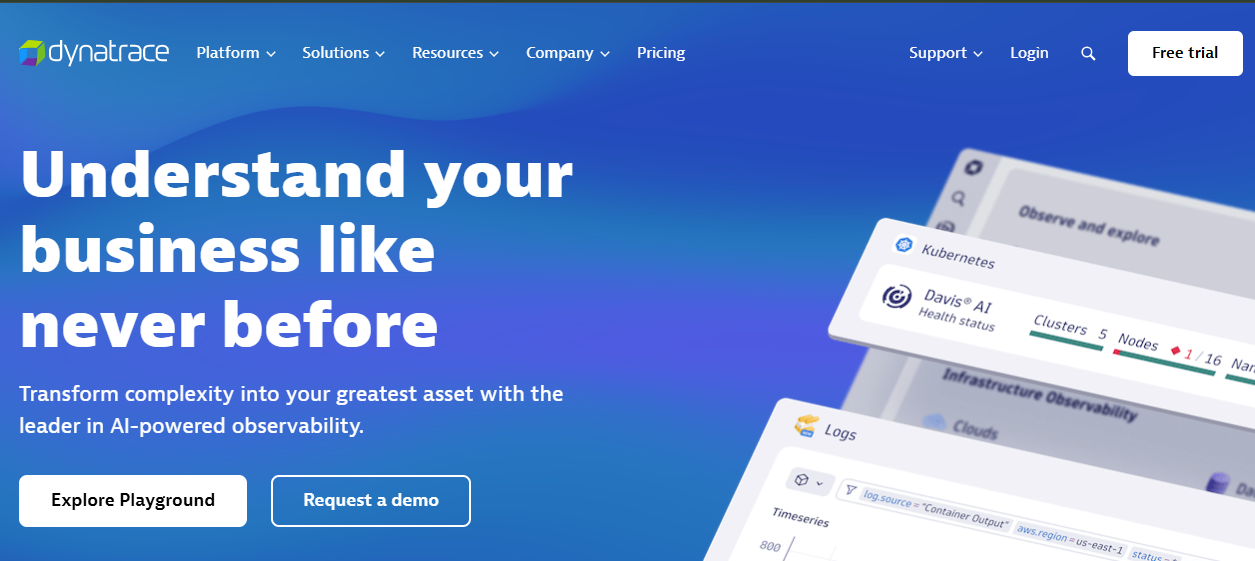
Dynatrace is known for its AI-powered, full-stack observability platform that combines metrics, traces, logs, real user monitoring (RUM), synthetic testing, and runtime security—all through a single-agent deployment. It is especially recognized for the Davis AI engine, which delivers automated root cause analysis, service dependency mapping, and smart anomaly detection.
Unlike Sentry, which focuses narrowly on frontend/backend application errors, Dynatrace offers end-to-end MELT observability with deep automation, making it a strong alternative for enterprises needing proactive issue detection and AI-driven insights.
Standout Features
- Davis AI Engine: Continuously analyzes dependencies and telemetry data to detect anomalies and pinpoint root causes across services automatically—no threshold configuration required.
- Smartscape Dependency Mapping: Auto-discovers service relationships and visualizes them in real-time topology maps, helping teams understand how systems interact.
- OneAgent Auto-Instrumentation: Dynatrace deploys a single agent per host that automatically instruments infrastructure, applications, containers, and cloud services—eliminating the need for manual configuration steps.
Key Features
- AI-Powered Full-Stack Observability: Combines logs, metrics, traces, RUM, and synthetics into one UI, correlated automatically by Davis AI.
- Distributed Tracing with End-to-End Flow: Dynatrace traces transactions from frontend to backend to database with real-time service flow maps.
- Real User and Synthetic Monitoring: Captures actual user sessions and simulates test traffic, helping measure performance from both real and synthetic angles.
- Service-Level Objectives (SLO) Tracking: Offers built-in tools for setting, tracking, and alerting on SLOs, MTTR, and SLAs.
Pros
- Industry-leading AI-based root cause analysis
- No manual instrumentation needed—OneAgent handles it all
- Combines MELT, UX monitoring, and runtime security in one platform
- Real-time dependency mapping with automatic updates
- Strong SLO/SLA tracking and cloud-native integrations
Cons
- Steep learning curve
- High cost — pricing may be prohibitive for small or mid-sized teams
- Overwhelming UI & data overload
Best For
Enterprises that want automated observability, AI-powered diagnostics, and minimal manual setup across hybrid and cloud-native environments.
Pricing & Customer Reviews
- Full-Stack Monitoring: $58 /month/per 8 GiB host*
- Infrastructure Monitoring: $29 /month/per host*
- G2 Rating: 4.5/5
- Praised for: Automation, precision, and scalability
- Criticized for: DDU cost opacity, no on-prem option, proprietary agent lock-in
Dynatrace vs Sentry
While Sentry focuses on application error tracking, Dynatrace provides automated full-stack observability with AI-driven diagnostics, SLO tracking, and real-time service maps. It’s a heavier platform with far more infrastructure insight, but also significantly more complex and expensive—ideal for large enterprises but overkill for lightweight app teams.
7. Grafana Overview
Known for:
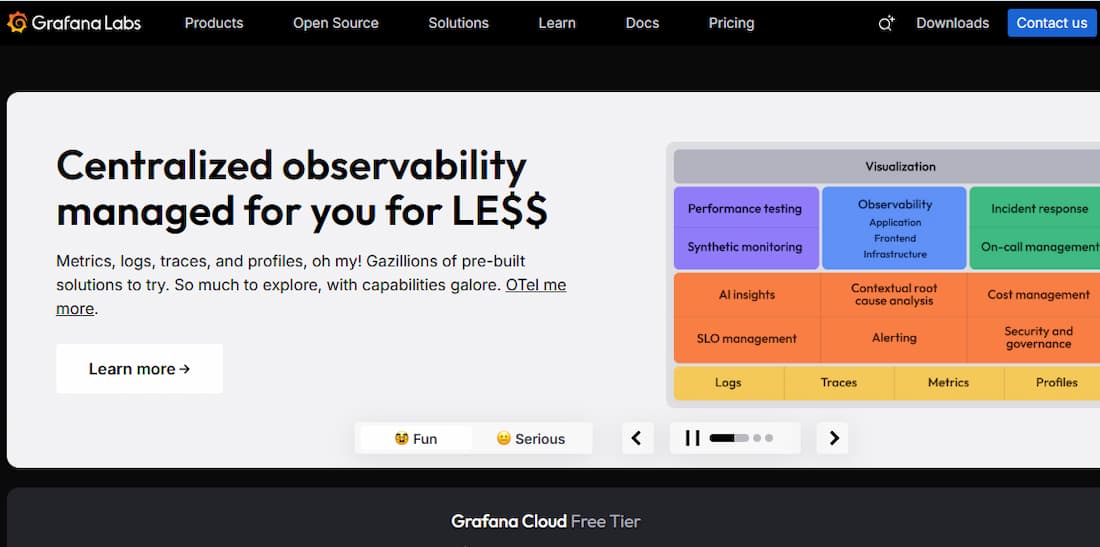
Grafana is best known as the open-source standard for observability dashboards. It allows engineering teams to create highly customizable visualizations from a wide array of data source,s including Prometheus (metrics), Loki (logs), Tempo (traces), and third-party tools like Elasticsearch, AWS, and MySQL. Unlike Sentry, which is purpose-built for error tracking, Grafana is favored for flexibility, extensibility, and visual control over telemetry pipelines.
Standout Features
- Open-Source Extensibility: Grafana’s plugin ecosystem supports 100+ data sources and custom visualizations. It’s ideal for teams that want to build their own observability stack.
- Prometheus, Loki & Tempo Integration: Enables a DIY observability suite by combining Grafana with OSS telemetry collectors—though this requires more setup than all-in-one platforms.
- Grafana Cloud & Enterprise Tiers: Teams can start with free OSS deployments or opt for managed observability via Grafana Cloud, which includes features like alerting and data source hosting.
Key Features
- Custom Dashboards & Panels: Create visualizations for any queryable data using a wide variety of chart types, transformations, and variables.
- Modular MELT Support via External Backends: Grafana supports metrics (via Prometheus), logs (via Loki), and traces (via Tempo), but doesn’t natively unify them without additional setup.
- Flexible Alerting System: Define thresholds, contact points, and notification rules across supported time-series sources.
Pros
- Fully open-source and free to self-host
- Exceptionally customizable dashboards
- Works well with open telemetry tools like Prometheus & Tempo
- Large and active OSS community
- Grafana Cloud provides hosted options with alerts, logs, and traces
Cons
- Configuration complexity—requires assembling Prometheus, Loki, and Tempo
- Steep learning curve
- Overwhelming UI making onboarding a challenge
Best For
DevOps and platform teams with experience managing observability pipelines who want full control over their dashboards and prefer open-source flexibility over vendor lock-in.
Pricing & Customer Reviews
- Grafana OSS: Free
- Grafana Cloud: Free tier (up to 10K series), paid plans start at $49/month
- G2 Rating: 4.5/5
- Praised for: Visualization power, plugin ecosystem
- Criticized for: Lack of built-in MELT unification, no developer-focused debugging features
Grafana vs Sentry
Sentry is optimized for frontend/backend error monitoring, whereas Grafana is built for flexible time-series dashboarding. Sentry provides richer developer context and Git-based workflows; Grafana requires building a stack with Prometheus, Loki, and Tempo for comparable insights. Teams looking for visual control over telemetry will prefer Grafana, but those seeking code-level visibility and crash analytics will still need Sentry or similar tools.
Conclusion: Choosing the Right Sentry Alternative
While Sentry remains a trusted tool for real-time error tracking and release monitoring, it falls short when teams need full-stack observability, OpenTelemetry-native support, infrastructure metrics, and cost control at scale.
The alternatives covered—ranging from CubeAPM and Datadog to Grafana and Dynatrace—offer stronger MELT coverage, AI-powered alerting, and better alignment with modern DevOps and compliance needs.
If you’re seeking an observability platform that balances developer-friendliness, full MELT support, and flat, predictable pricing, CubeAPM stands out as the most complete and scalable Sentry alternative for 2025.CubeAPM distinguishes itself as a solid observability solution, adeptly managing microservices complexity with smart sampling that prioritizes critical data, such as latency anomalies, to enhance signal quality.
*At the time of writing, all pricing details, feature limitations, and user-reported issues reflect the most up-to-date information available from public sources and vendor documentation. Observability platforms evolve quickly, so features, performance, and pricing may change over time. We recommend verifying the latest details directly with each vendor before making a final decision.
FAQs
1. What are the best Sentry alternatives in 2025?
Top options include CubeAPM, Datadog,and Grafana—each offering different strengths in full-stack (MELT) observability, cost structure, deployment flexibility, and developer/user focus.
2. Why are teams switching from Sentry?
While Sentry excels at error tracking and release telemetry, it’s limited in logging, infrastructure metrics, distributed tracing, and alert intelligence. Teams outgrow it when they need broader observability, smarter alerts, better compliance, and more transparent pricing.
3. Is there an alternative that matches Sentry’s developer UX?
Yes—CubeAPM provides developer‑focused workflows like error inboxes, code-linked trace views, and deployment markers—while also offering full MELT support, OpenTelemetry ingestion, flat pricing, and compliance-ready deployment options
4. Which alternative supports both SaaS and self-hosted deployment?
CubeAPM, Splunk AppDynamics, Coralogix, and Grafana (OSS) support self-hosted or VPC deployment, giving teams full control over data ownership and compliance—unlike SaaS-only tools such as Datadog or Dynatrace.
5. How do alternatives compare on pricing vs Sentry?
While Sentry tools typically charge per event, many alternatives use flat-rate or ingestion-based pricing models. CubeAPM stands out with predictable, usage-based tiers—avoiding unpredictable spikes seen in event-based billing or multi-module SaaS offerings.


