Azure Monitor provides broad visibility across applications, infrastructure, and services with strong Azure integration and powerful log analytics for querying and troubleshooting at scale. However, teams often face a steep learning curve, complex configuration for alerts and dashboards, and high costs as log ingestion and retention grow.
CubeAPM offers a simpler observability experience with native OpenTelemetry support, unified metrics, logs, and traces, and predictable usage-based pricing—making it an easier and more cost-transparent alternative to Azure Monitor.
In this article, we’ll explore the top Azure Monitor alternatives, comparing their feature sets, pricing, deployment models, and support quality.
Top 7 Azure Monitor Alternatives
- CubeAPM
- Sentry
- Coralogiz
- Grafana
- Datadog
- Dynatrace
- New Relic
Why Look for Azure Monitor Alternatives?
1. Expensive Pricing Tiers
Azure Monitor’s log pricing spans Auxiliary, Basic, and Analytics Logs—each with different capabilities and costs ranging from $0.05/GB to $2.30/GB, making budgeting and forecasting difficult for teams ingesting large volumes of telemetry data.
For example, one user said migrating from legacy to new Azure Monitor agents nearly quadrupled or quintupled their costs due to noisier data collection:
“I found the DNS logs using the Azure Monitoring Agent nearly tripled in cost for me over collecting DNS logs” (Reddit User)
2. Steep Learning Curve
Azure Monitor’s interface spans multiple services—Application Insights, Log Analytics, Metrics Explorer, and Diagnostic Settings—each with different query languages, permissions, and settings. Setting up queries, alerts, and data pipelines often demands in-depth Azure expertise. Fine-tuning for cost and performance adds another layer of complexity, especially in multi-resource environments. Even experienced engineers face friction during onboarding or scaling.
As these users note:
“It takes a little bit to learn where things are, so it’s a learning curve.”(G2)
“I have noted a learning curve in configuring and fine-tuning Azure Monitor, especially for complex setups. Additionally, the cost structure can be challenging”(G2)
3. Complex UI and Disjointed User Experience
Azure Monitor’s user interface spans multiple portals and tools, making it hard to navigate and operate smoothly. Tasks like setting up alerts, viewing traces, or managing retention require jumping between Application Insights, Log Analytics, and other disconnected dashboards. This fragmented experience introduces a steep learning curve and slows down day-to-day workflows, especially for teams new to Azure.
As one user notes:
“Its level of customization is good, but the interface can be overwhelming due to the number of options available; some of these could be merged into a single board to improve usability.” (G2)
Criteria for Suggesting Azure Monitor Alternatives
1. OpenTelemetry-Native Instrumentation
We prioritize tools that offer first-class support for OpenTelemetry—not just compatibility layers. This ensures vendor-neutral data collection, better interoperability, and long-term observability flexibility.
2. Transparent and Predictable Pricing
The best alternatives offer simple, flat-rate pricing per GB of data or per host—without hidden costs for dashboards, queries, alerting, or retention. This avoids the budgeting headaches common with Azure Monitor’s tiered billing.
3. Full MELT Coverage (Metrics, Events, Logs, Traces)
Alternatives must support end-to-end observability, not just partial views. A modern platform should cover all four pillars (MELT) with correlation across them to speed up root cause analysis.
4. Self-Hosting or Private Cloud Deployment
For compliance-heavy or cost-sensitive teams, alternatives should offer on-prem or VPC-hosted deployment options. Azure Monitor’s SaaS-only model doesn’t meet data localization or air-gapped environment needs.
5. Unified User Experience
Unlike Azure Monitor’s fragmented UI, better alternatives provide a single-pane-of-glass interface where logs, traces, metrics, and alerts are accessible from one dashboard—cutting down operational overhead and onboarding time.
Azure Monitor Overview
Known For
Azure Monitor is Microsoft’s native observability suite, built for monitoring cloud applications and infrastructure within the Azure ecosystem. It’s widely used for performance monitoring, log analysis, metrics tracking, and diagnostics across Azure VMs, App Services, Functions, and Kubernetes clusters (AKS). It’s often the default choice for teams already committed to Azure.
Standout Features
- Seamless integration with Azure resources (VMs, databases, services)
- Log Analytics with KQL (Kusto Query Language) for advanced querying
- Application Insights for APM, with telemetry from .NET, Java, Node.js, etc.
- Data Collection Rules (DCR) for managing what telemetry is sent
- Metrics Explorer for real-time charting across Azure services
- Availability/Synthetic testing via built-in tests
Key Features
- Application Performance Monitoring (APM): Collects distributed traces, dependencies, and custom events through Application Insights.
However, OTEL support is still developing and often requires wrapping with legacy SDKs. - Log Analytics: Powerful querying engine via KQL, supports cross-table joins and summary rules.
Logs are separated into Basic, Analytics, and Auxiliary tiers—each priced and queried differently. - Infrastructure & Resource Monitoring: Native visibility into CPU, disk, memory, and network usage for Azure-native services.
- Alerts & Dashboards: Supports threshold-based and dynamic alerts with Action Groups. Can integrate with ITSM tools, email, SMS, and Logic Apps, though setup is complex.
- RUM & Synthetics: Includes browser monitoring for front-end insights and basic synthetic tests.
Advanced canary testing features are limited compared to third-party tools.
Pros
- Deep native integration with Azure platform resources
- Excellent for organizations that are fully Azure-native
- Powerful querying and aggregation using KQL
- Scalable ingestion with support for huge volumes of telemetry
Cons
- Debugging workflows can be complex and hard to follow
- Metrics and alert configuration are often confusing and overwhelming
- Alerting can become noisy due to complex setups
Best For
Organizations that are heavily invested in Azure need tight integration with Microsoft services and can manage the cost/complexity of Azure-native observability tooling.
Pricing & Customer Reviews
- Log Ingestion (Analytics Logs): Up to $2.30/GB
- Basic Logs: $0.50/GB
- Auxiliary Logs: $0.05/GB
- Log processing: Additional $0.10/GB
- Synthetic tests, metric exports, and retention extensions are billed separately
- On G2, Azure Monitor holds a 4.3/5 rating.
Top 7 Azure Monitor Alternatives
1. CubeAPM

Known For
CubeAPM is best known for being a lightweight, OpenTelemetry-native APM platform that supports full-stack observability (MELT) with extremely low cost and self-hosted deployment options. It’s a top choice for teams needing data sovereignty, smart sampling, and simplified billing.
Key Features
- Distributed Tracing: Contextual OTEL-native tracing with latency, error, and custom tags.
- Log Monitoring: Structured log ingestion with filtering, retention, and correlation to traces.
- Infrastructure Monitoring: Tracks CPU, memory, disk, and network metrics across services.
- RUM & Synthetic Monitoring: Capture front-end performance and simulate uptime checks.
- Error Tracking: Built-in error inbox for monitoring exceptions and crash rates.
Standout Features
- Smart Sampling: Retains important traces using latency/error context instead of head-based random sampling.
- Self-Hosting: Deploy in your own VPC or on-prem for compliance and egress savings.
- Flat Pricing: $0.15/GB for all data types—logs, traces, metrics—with no per-host or per-service fees.
- Zero Vendor Lock-in: Full OTEL and Prometheus compatibility.
Pros
- 60–80% cheaper than Azure Monitor and legacy APMs
- Large integrations ecosystem–800+ integrations
- Zero egress costs
- Instant onboarding with OTEL or Datadog/New Relic agents
- Unlimited retention when self-hosted
- Native support for OpenTelemetry and Prometheus
- Direct Slack/WhatsApp support with low TAT
Cons
- Not suited for teams looking for off-prem solutions
- Strictly an observability platform and does not support cloud security management
Best For
Engineering teams and startups needing full MELT observability at a low, predictable cost, with self-hosting or data localization requirements.
Pricing & Customer Reviews
- Pricing: $0.15/GB flat (no host or user-based pricing)
- Self-hosted cost: zero egress + infra
- G2 rating: Not yet listed (early adoption phase), but pilot users report 60–70% cost savings
CubeAPM vs Azure Monitor
CubeAPM and Azure Monitor both support metrics, logs, and traces, but Azure Monitor often involves complex configuration and unpredictable costs at scale. CubeAPM offers a simpler, OpenTelemetry-native approach with unified observability and predictable pricing, making it a more practical alternative for teams seeking clarity and ease of use.
2. Sentry
Known For
Sentry is primarily known for error and performance monitoring across frontend and backend applications. It’s widely used by developers to identify crashes, latency issues, and user-impacting bugs in real time.
Key Features
- Error Tracking: Real-time exception monitoring with stack traces, breadcrumbs, and contextual metadata.
- Performance Monitoring: Measures transaction duration, spans, and latency across web and mobile applications.
- Frontend + Backend Coverage: Supports JavaScript, Python, Node.js, .NET, Java, iOS, Android, and more.
- Release Health: Tracks deployment impact, error regressions, and slow user sessions.
- Alerts & Workflow Integration: Built-in alert rules, plus integrations with Slack, PagerDuty, Jira, and GitHub.
Standout Features
- Source Map Integration: Deobfuscates minified code for frontend debugging.
- Session Replay: Visual playback of user interactions to help reproduce bugs.
- Contextual Tracing: Combines performance data with error logs for end-to-end diagnosis.
- Developer-Centric UX: Optimized for fast debugging and collaboration across teams.
Pros
- Easy to set up with lightweight SDKs
- Powerful debugging experience for both frontend and backend
- Excellent GitOps and CI/CD integrations
- Clean, responsive UI built for developers
Cons
- Sentry’s error handling is sometimes slow and unreliable
- Expensive for small teams and startups
Best For
Engineering teams focused on frontend and API performance and needing best-in-class error monitoring rather than full-stack observability.
Pricing & Customer Reviews
- Team: $26/month
- Business: $80/month
- Enterprise: custom
- G2 Rating: 4.5/5 — praised for ease of use and issue visibility, though some users note rising cost at scale.
Sentry vs Azure Monitor
Sentry and Azure Monitor address observability from different angles. Azure Monitor provides broad platform monitoring across metrics, logs, and infrastructure, but can be complex to configure and manage at scale. Sentry focuses on application error tracking and performance insights with a simpler developer experience, though it lacks the broader infrastructure visibility of Azure Monitor, making it better suited for app-level monitoring rather than full-stack observability.
3. Coralogix
Known For
Coralogix is known for its log-centric observability platform that emphasizes cost efficiency, real-time processing, and flexible data routing. It’s often chosen by engineering teams looking to ingest large volumes of logs, traces, and metrics without breaking their budget.
Key Features
- Real-time log ingestion and parsing with structured queries
- Alerting and live tail for immediate troubleshooting
- Derived metrics and traces from log streams
- Support for OpenTelemetry, Prometheus, and custom pipelines
- Integration with CI/CD, cloud providers, and notification tools
Standout Features
- TCO Optimizer: Routes logs and telemetry into different storage pipelines (frequent-search, compliance, monitoring) to reduce cost
- In-Stream Analytics: Processes and analyzes data before indexing, reducing query load and storage costs
- Customer-Owned Archive: Archived data is stored in the customer’s own cloud, enabling lower long-term costs
Pros
- Strong cost control and flexibility in telemetry routing
- Real-time alerting and live debugging with live tail
- Scalable to high ingestion volumes without indexing everything
- Strong reputation for ML-driven anomaly detection and fast support
Cons
- Initial setup can be complex due to pipeline configuration
- Laggy UI hinders user experience
- Steep learning curve for beginners
Best For
DevOps and platform teams needing cost-efficient log and trace analytics, with fine-grained control over data pipelines and support for compliance through customer-managed storage.
Pricing & Customer Reviews
- Logs: $0.42/GB
- Traces: $0.16/GB
- Metrics: $0.05/GB
- AI: $1.5/1M tokens
- G2 Rating: 4.6/5, praising its powerful real-time features and cost management capabilities.
Coralogix vs Azure Monitor
Coralogix and Azure Monitor both support full-stack observability across logs, metrics, and traces. Azure Monitor is tightly integrated with Azure but can be complex to configure and costly as usage grows, while Coralogix offers a unified observability platform with advanced analytics and clearer cost controls, making it a strong alternative for teams seeking full-stack visibility with less operational friction.
4. Grafana
Known For
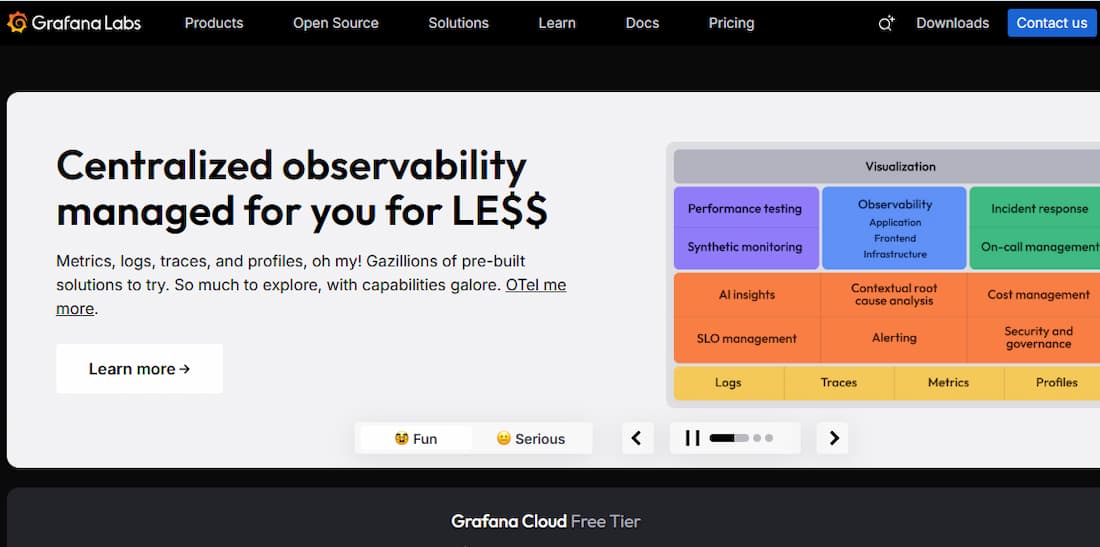
Grafana is best known for its visual dashboarding and alerting platform, widely used to monitor metrics, logs, and traces across cloud-native, on-prem, and hybrid environments. It’s favored by DevOps and SRE teams for real-time data visualization and integrations with Prometheus, Loki, Tempo, and other observability backends.
Key Features
- Dashboard Builder: Custom time-series visualizations, variables, annotations, and templating
- Metrics Monitoring: Integrates with Prometheus, Graphite, InfluxDB, and many others
- Log Aggregation: Via Grafana Loki, providing context-rich log queries with stream labels
- Tracing: Powered by Grafana Tempo, supporting OTEL, Jaeger, and Zipkin formats
- Alerting Engine: Unified alerts from logs, metrics, and traces with routing to Slack, PagerDuty, and email
Standout Features
- Plug-in Ecosystem: 100+ community and commercial data source plugins
- Grafana Cloud: Fully managed observability stack combining metrics (Prometheus), logs (Loki), and traces (Tempo)
- Grafana OnCall: Built-in on-call management with escalation policies and schedules
- Synthetic Monitoring: Basic uptime checks and API test capabilities for web services
Pros
- Free and open source core
- Powerful dashboarding and flexible query engine
- Vendor-agnostic and widely integrable
- Can be fully self-hosted or consumed as SaaS (Grafana Cloud)
Cons
- Logs and traces require setting up Loki and Tempo—adds operational overhead
- Users find the learning curve steep, especially when integrating data sources
- Interface issues, such as lagging visualizations
Best For
Teams looking for visual-first observability, DIY stack flexibility, or an OSS foundation that scales across logs, metrics, and traces with fine control over integrations and cost.
Pricing & Customer Reviews
Grafana offers both OSS and SaaS models. Grafana Cloud pricing is tiered by usage:
- Grafana OSS: Free
- Pro plan: $19/month
- Metrics: $6.50/ 1k series
- Logs: $0.50/GB ingested
- Traces: $0.50/GB ingested
- G2 Rating: 4.5/5 rating, praised for its UI and flexibility, with some complaints about plugin maintenance and steep learning curves for complex setups.
Grafana vs Azure Monitor
Grafana offers greater flexibility and cost control, especially for teams wanting to self-host or run hybrid stacks. Azure Monitor, while deeply integrated with Azure, is SaaS-only and much more rigid in pricing. Grafana’s modular architecture allows teams to plug in Prometheus, Loki, and Tempo at their own pace—whereas Azure Monitor bundles everything into a multi-tiered system with ingestion-based pricing and limited OTEL support.
5. Datadog
Known For
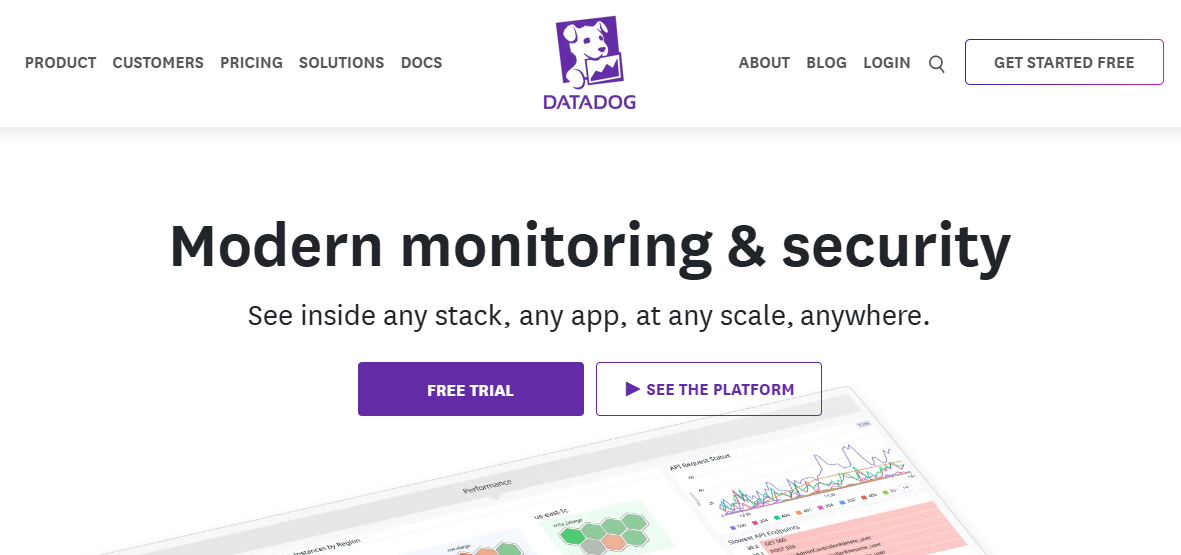
Datadog is widely known for its full-stack observability platform, combining APM, infrastructure metrics, logs, security monitoring, and more—all under a unified SaaS model. It’s a go-to tool for cloud-native engineering teams.
Key Features
- APM with distributed tracing, flame graphs, and service maps
- Real User Monitoring and Synthetic Monitoring
- Logs ingestion and processing with correlation to traces
- Host-level and container-level infrastructure monitoring
- Dashboards, alerting, SLOs, and incident workflows
Standout Features
- Service Catalog: Central view of all services with health and owner metadata
- Watchdog AI Engine: AI-powered automatic anomaly detection
- Integrations Ecosystem: 900+ native integrations with AWS, Azure, Kubernetes, and more
- Unified Agent: Single agent for metrics, logs, traces, and profiling
Pros
- Excellent correlation between metrics, logs, and traces
- Mature alerting and dashboarding features
- Fast UI and rich out-of-the-box integrations
- Scalable for complex microservice architectures
Cons
- The cost is extremely high for small and growing teams
- Complexity makes navigation a challenge
- Steep learning curve
Best For
Teams with large microservice infrastructures needing deep correlation across logs, traces, and infra—but with the budget to absorb premium pricing.
Pricing & Customer Reviews
- APM (Pro Plan): $35/host/month
- Infra (Pro Plan): $15/host/month
- Ingested Logs: $0.10 per ingested or scanned GB per month
Datadog vs Azure Monitor
Datadog and Azure Monitor both provide observability across metrics, logs, and traces, but they serve different needs. Azure Monitor is deeply integrated with Azure services and well-suited for monitoring Azure-centric workloads, though it can be complex to configure and costly as data volumes grow. Datadog offers broad multi-cloud and hybrid support with extensive integrations and advanced analytics, making it a strong choice for teams needing platform-agnostic observability and richer insights across diverse environments.
6. Dynatrace
Known For
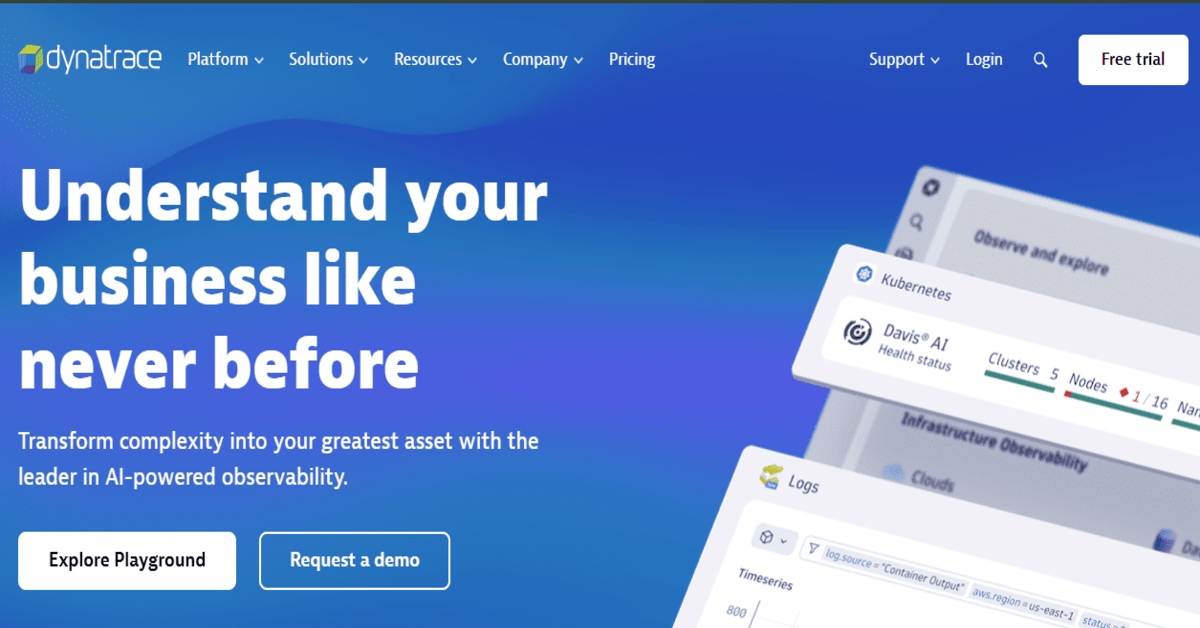
Dynatrace is known for its AI-powered full-stack observability, with a heavy emphasis on automation, cloud infrastructure monitoring, and enterprise-scale environments.
Key Features
- Distributed tracing and automatic instrumentation
- Logs and events ingested with trace-level correlation
- RUM, synthetic testing, and session replays
- Infrastructure + cloud workload monitoring
- Davis AI for anomaly detection and causal root cause analysis
Standout Features
- Smartscape Topology: Real-time dependency maps of services, infra, and hosts
- Davis AI Engine: Built-in AIOps for auto-detecting and diagnosing issues
- Code-level Insights: CPU profiling, memory analysis, and service flow analysis
- Kubernetes & Cloud-native Focus: Auto-discovery of pods, containers, services
Pros
- Rich, automated insights with minimal manual config
- Excellent scalability for large hybrid/multi-cloud deployments
- AI-based problem detection reduces alert fatigue
- High automation across setup, alerting, and updates
Cons
- High learning curve and UI complexity
- Expensive licensing based on Davis Data Units (DDUs)
- Complex initial setup and configuration
Best For
Large enterprises needing automated observability at scale, especially across complex cloud-native environments or regulated industries.
Pricing & Customer Reviews
- Infrastructure Monitoring: $29 / mo per host
- Full-Stack Monitoring: $58 / mo per 8 GiB host
- G2 rating: 4.4/5, praised for automation and accuracy, with cost complexity noted as a barrier.
Dynatrace vs Azure Monitor
Dynatrace and Azure Monitor both offer metrics, logs, and traces, but they differ in depth and focus. Azure Monitor is strong for monitoring Azure-centric workloads and integrates tightly with Microsoft services, though it can be complex to configure and costly as usage grows. Dynatrace delivers full-stack observability with AI-driven analytics, automated root-cause detection, and broad multi-cloud support, making it a more advanced choice for teams needing deep insights and proactive issue resolution beyond basic platform metrics.
7. New Relic
Known For
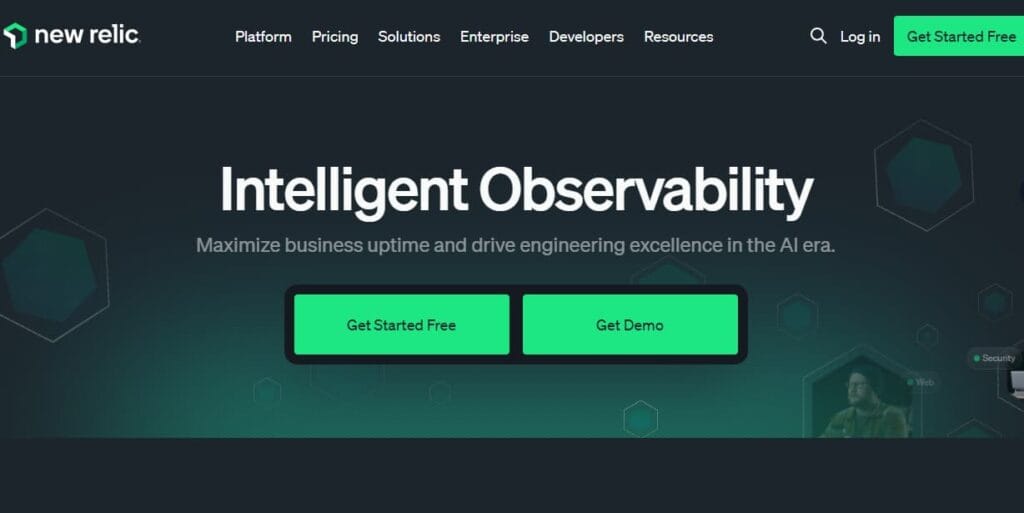
New Relic is known for its telemetry platform with usage-based pricing, offering unified APM, logs, metrics, and traces with a strong developer UX.
Key Features
- Distributed tracing, service maps, and transaction analysis
- Log ingestion, filtering, and correlation
- Infrastructure and network monitoring
- RUM, browser analytics, and mobile monitoring
- Alerts, dashboards, and SLO tracking
Standout Features
- All-in-one Telemetry Data Platform: Logs, metrics, traces under one UI
- Query Language (NRQL): Powerful querying across all telemetry types
- Infinite Tracing: Scalable tail-based tracing
- CodeStream: Developer IDE integration for error insights inside code editors
Pros:
- Single pricing model for all observability types
- Simple instrumentation and auto-discovery
- Clean UI and fast learning curve
- Strong support for OpenTelemetry and cloud-native tools
Cons:
- Pricing is complicated and expensive
- Steep learning curve
- Complexity of setup and NRQL queries
Best For
Developer-centric teams who want quick visibility into services and apps without needing deep infrastructure configuration.
Pricing & Customer Reviews
- Free tier: 100GB/month ingested
- Pro Plan: $0.40/GB ingested beyond the 100GB/month free limit
- Pro Plan: $349/month for full platform user
- G2 rating: 4.4/5
New Relic vs Azure Monitor
New Relic and Azure Monitor both offer observability across applications and infrastructure, but they differ in focus and experience. Azure Monitor integrates deeply with Azure services and provides broad metrics, logs, and alerting, though it can be complex to configure and manage. New Relic delivers highly customizable dashboards, real-time analytics, and broad multi-cloud support, often with a simpler interface and richer insights for application performance, making it a strong alternative to Azure Monitor for teams needing flexible, platform-agnostic observability.
Conclusion
Azure Monitor remains a natural choice for teams already deep into the Azure ecosystem, offering native integration across Azure services. However, its complex pricing, fragmented user experience, and limited flexibility around deployment and OpenTelemetry support have pushed many organizations to explore more agile alternatives.
From CubeAPM’s flat-rate, OTEL-native stack, to tools like Datadog, Dynatrace, Coralogix, and Grafana, there are now mature observability platforms that deliver better control, cost-efficiency, and compliance. Whether your priority is real-time debugging, self-hosting, or smart sampling, this list provides strong alternatives to fit a range of team sizes, infrastructures, and compliance requirements.
Disclaimer: The information in this article reflects the latest details available at the time of publication and may change as technologies and products evolve.
FAQs
1. Why are teams moving away from Azure Monitor?
Teams are switching due to cost complexity, limited OpenTelemetry support, and Azure Monitor’s fragmented UI. Many find it difficult to scale observability across hybrid or multi-cloud environments with predictable billing or deployment control.
2. What is the best alternative to Azure Monitor for self-hosting?
CubeAPM is the top self-hosted alternative. It offers full-stack MELT observability, OpenTelemetry-native support, and flat-rate pricing, all deployable in your own cloud or on-premises environment.
3. Which Azure Monitor alternative is most cost-effective?
CubeAPM and Grafana (OSS) are among the most cost-efficient. CubeAPM offers a flat $0.15/GB pricing with no per-host fees, while Grafana allows you to run logs, metrics, and traces using OSS tools like Loki, Prometheus, and Tempo.
4. Does Azure Monitor support OpenTelemetry?
Partially. Azure Monitor supports OpenTelemetry through its own Distro, but it’s not fully OTEL-native. Many features still rely on legacy SDKs, and tail-based sampling or enriched span data requires workarounds.
5. Can Azure Monitor be deployed on-premise?
No. Azure Monitor is a SaaS-only product. It cannot be deployed on-prem or within a customer’s VPC, which poses challenges for teams needing data residency or air-gapped deployments.


