










Kubernetes runs thousands of containers across hundreds of nodes, but without runtime security monitoring, a privilege escalation or unauthorized shell access can go undetected for hours or days. Traditional vulnerability scanners catch issues before deployment, but zero-day exploits and misconfigurations only manifest during runtime. Falco provides real-time threat detection by monitoring system calls at the kernel level, catching suspicious behavior the moment it happens.
Falco is the most widely adopted runtime security tool for Kubernetes, with over 30 million container downloads and adoption by organizations managing production workloads at scale. This guide covers what Falco is, how it works, how to deploy it in Kubernetes, and how to write custom rules for your environment.
What Is Runtime Security Monitoring?
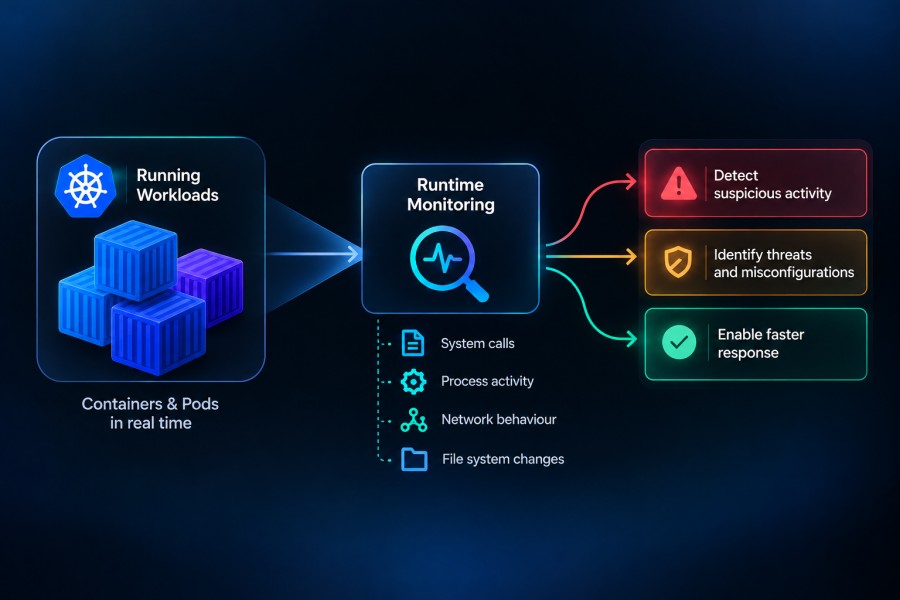
Runtime security monitoring observes what applications and containers actually do while running in production. Unlike image scanning tools that find vulnerabilities in static images, runtime security detects active threats based on behavior.
A container may pass all pre-deployment checks but still execute unexpected commands, open unauthorized network connections, or modify critical files at runtime. These actions only become visible after the container starts. Runtime security tools track these behaviors in real time and alert when they violate defined policies.
Three main signals form the foundation of runtime security:
System calls (syscalls) capture every interaction between user space and the kernel. This includes file access, network connections, process creation, and privilege changes. Monitoring syscalls reveals what each container actually does rather than what it claims to do.
Kubernetes audit logs record every API server request. This includes pod creation, service changes, role binding modifications, and secret access. Audit logs expose configuration changes and administrative actions that may bypass container-level monitoring.
Network activity tracks connection attempts, data transfer patterns, and protocol usage. Unexpected outbound connections or traffic to unusual ports often indicate compromised workloads.
Falco focuses primarily on syscall monitoring but can integrate data from Kubernetes audit logs and network plugins to provide broader coverage.
How Falco Works
Falco sits between the Linux kernel and user space, capturing system calls as they happen. It parses this stream of events, evaluates them against a rule set, and triggers alerts when a rule condition is met.
The Falco architecture
Three components work together to deliver runtime security in Falco:
The driver intercepts kernel events using either an eBPF probe or a kernel module. The eBPF probe runs in modern kernels without requiring a module load. The kernel module provides broader compatibility with older systems. Both options capture the same event data with minimal performance overhead.
The userspace program receives the event stream from the driver, enriches events with Kubernetes metadata like pod names, namespaces, and labels, then evaluates each event against loaded rules. When a rule matches, Falco generates an alert.
The rule engine defines what behavior is considered suspicious. Rules combine conditions like process names, file paths, network actions, and user IDs. Falco ships with default rules covering common threats but teams typically customize rules to fit their environment.
What Falco detects by default
Falco’s default rule set covers behavior patterns commonly associated with attacks or misconfigurations:
Shell execution inside containers triggers an alert because most production containers should not run interactive shells. If a bash or sh process spawns in a container that normally runs only application code, it often indicates an attacker gained access.
Sensitive file access alerts fire when processes read or write files like /etc/shadow, /etc/passwd, or SSH keys. These files should rarely change in production.
Privilege escalation attempts are flagged when processes call setuid, setgid, or modify capabilities. Attackers often escalate privileges to gain root access.
Unexpected network connections alert when containers connect to IP ranges or ports not typical for the application. A Redis container connecting to an external IP on port 22 would trigger this rule.
Configuration changes to Kubernetes objects like secrets, roles, or admission controllers appear in audit log rules. Unauthorized changes to RBAC policies can expose entire clusters.
Deploying Falco in a Kubernetes Cluster
Falco runs as a DaemonSet in Kubernetes, placing one Falco pod on every node to monitor syscalls from all containers on that node.
Installation using Helm
The official Falco Helm chart simplifies deployment and provides configuration options for drivers, outputs, and rule sets.
helm repo add falcosecurity https://falcosecurity.github.io/charts
helm repo update
helm install falco falcosecurity/falco \
  --namespace falco \
  --create-namespace \
--set driver.kind=modern_ebpfThe driver.kind=modern_ebpf option uses the eBPF probe. If your kernel version does not support eBPF, switch to driver.kind=module to use the kernel module instead.
After installation, verify the pods are running:
kubectl get pods -n falcoEach node should have one running Falco pod. Check logs to confirm event processing started:
kubectl logs -n falco -l app.kubernetes.io/name=falcoYou should see log lines indicating rules loaded and events being processed.
Choosing between eBPF and kernel module
The eBPF probe works on modern kernels (5.8 and later) and does not require compiling or loading kernel modules. This makes it easier to deploy in managed Kubernetes environments like GKE, EKS, and AKS where module loading may be restricted.
The kernel module provides compatibility with older kernels and can capture slightly more detailed event data on some systems. It requires kernel headers to compile the module, which adds deployment complexity.
Most teams starting with Falco in 2026 should default to the eBPF probe unless they run legacy kernel versions or need specific features only available with the module.
Writing Custom Falco Rules
Falco’s default rules catch common threats, but every environment has unique applications and workflows. Custom rules reduce false positives and detect threats specific to your workloads.
Rule structure
A Falco rule consists of five parts:
rule defines the rule name. This appears in alert outputs and logs.
desc provides a human-readable description of what the rule detects.
condition specifies the logic that triggers an alert. Conditions use Falco’s filter syntax to match syscall properties, process attributes, file paths, and Kubernetes metadata.
output defines the alert message format. Outputs can include dynamic fields from the matched event like user name, process name, or container ID.
priority sets the severity level. Valid priorities are EMERGENCY, ALERT, CRITICAL, ERROR, WARNING, NOTICE, INFORMATIONAL, and DEBUG.
Here is a simple rule that alerts when a shell runs in any container:
- rule: Shell Spawned in Container
  desc: Detect shell execution inside a container
  condition: >
    container.id != host and proc.name in (bash, sh, zsh)
  output: >
    Shell spawned in container (user=%user.name command=%proc.cmdline container=%container.id)
priority: WARNINGWriting a rule for unexpected outbound connections
Production applications typically connect to a known set of internal services and external APIs. A container connecting to an unexpected external IP can indicate data exfiltration or command and control traffic.
This rule alerts when a container initiates an outbound connection to an IP outside your internal network ranges:
- rule: Unexpected Outbound Connection
  desc: Container connected to external IP not in allowed ranges
  condition: >
    outbound and container.id != host and
    not fd.sip in (10.0.0.0/8, 172.16.0.0/12, 192.168.0.0/16) and
    not fd.sip in (api.example.com, cdn.example.com)
  output: >
    Outbound connection to unexpected IP (user=%user.name process=%proc.name
    destination=%fd.sip:%fd.sport container=%container.name)
priority: CRITICALThe condition checks for outbound connections from containers, excludes private IP ranges, and excludes known external services by hostname or IP. Adjust the IP ranges and allowed destinations to match your environment.
Using macros to simplify rules
Macros define reusable condition fragments. They reduce duplication and make rules easier to maintain.
Define a macro for sensitive directories:
- macro: sensitive_mount_paths
  condition: >
fd.name startswith /etc or fd.name startswith /var/run/secretsThen reference it in a rule:
- rule: Write to Sensitive Directory
  desc: Process wrote to a sensitive mount
  condition: >
    open_write and container.id != host and sensitive_mount_paths
  output: >
    Write to sensitive path (user=%user.name file=%fd.name container=%container.name)
priority: ERRORMacros also allow overriding default rule behavior without modifying shipped rules directly. You can redefine a macro in a custom rules file to adjust what the default rules match.
Integrating Falco with Alerting Systems
Falco generates alerts as JSON objects written to stdout by default. To route alerts to incident management platforms, notification channels, or SIEM systems, teams typically deploy Falcosidekick alongside Falco.
Falcosidekick: routing alerts to 50+ destinations
Falcosidekick receives Falco alerts and forwards them to Slack, PagerDuty, email, webhooks, AWS Security Hub, Elasticsearch, and over 50 other integrations.
Install Falcosidekick using Helm:
helm install falcosidekick falcosecurity/falcosidekick \
  --namespace falco \
--set config.slack.webhookurl=https://hooks.slack.com/services/YOUR/WEBHOOK/URLUpdate the Falco configuration to send alerts to Falcosidekick:
falco:
  json_output: true
  http_output:
    enabled: true
url: http://falcosidekick:2801After deploying, Falco alerts appear in your configured channels within seconds. Each alert includes the full context from the output field, making it easy to understand what happened and on which node or pod.
Reducing alert noise with priority filtering
Production Kubernetes clusters generate thousands of syscalls per second. Without filtering, alert volume can overwhelm teams. Priority filtering ensures only actionable alerts reach notification channels.
Configure Falcosidekick to forward only CRITICAL and ERROR priority alerts to PagerDuty while sending all alerts to Elasticsearch for storage:
config:
  pagerduty:
    routingkey: YOUR_ROUTING_KEY
    minimumpriority: error
  elasticsearch:
    hostport: https://elasticsearch.example.com:9200
minimumpriority: debugThis setup ensures on-call engineers only receive high-severity alerts while preserving full alert history for investigation.
Monitoring Falco Itself
Falco processes millions of kernel events per second in active clusters. Monitoring Falco’s own performance ensures it does not become a bottleneck or miss events.
Key Falco metrics to track
Falco exposes Prometheus metrics on port 8765. These metrics reveal event processing rates, dropped events, and rule evaluation performance.
falco_events_total counts all events processed. A sudden drop indicates Falco stopped receiving kernel events.
falco_drops_total counts events dropped due to insufficient processing capacity. Non-zero values mean Falco cannot keep up with the event rate.
falco_rule_matches_total counts how many times each rule triggered. High match rates on specific rules may indicate misconfiguration or an ongoing attack.
Scrape these metrics with Prometheus or send them to an observability platform that supports Prometheus exposition format.
Detecting Falco performance issues
If falco_drops_total increases steadily, Falco is dropping events. This happens when the event rate exceeds Falco’s processing capacity. Causes include:
Complex rules with expensive regular expressions slow down evaluation. Simplify conditions or use macros to prefilter events before expensive checks.
Insufficient CPU allocation limits how fast Falco can process events. Increase CPU requests in the Falco DaemonSet.
Output bottlenecks occur when Falcosidekick or downstream systems cannot accept alerts fast enough. Add buffering or scale the downstream components.
CubeAPM: Correlating Falco Alerts with Full-Stack Observability

Falco detects threats at the kernel and Kubernetes layer, but resolving incidents often requires correlating security events with application traces, logs, and infrastructure metrics. CubeAPM provides unified observability that connects Falco alerts to the broader context of what was happening across your stack when the alert fired.
Why correlating security alerts with APM matters
A Falco alert fires when a shell spawns in a container. The alert tells you which pod and node, but it does not tell you what the application was doing at that moment or whether the incident affected user requests.
CubeAPM ingests Falco alerts via Falcosidekick webhooks and links them to APM traces, logs, and infrastructure metrics. When you view a Falco alert in CubeAPM, you also see:
Which application endpoints were active in the affected pod at the time of the alert.
Error rates and latency spikes in the service, indicating whether the security event impacted users.
Resource usage trends showing whether the incident coincided with CPU or memory anomalies.
Recent deployments or configuration changes that may have introduced the vulnerability.
This context reduces mean time to resolution by eliminating the need to manually correlate data across separate security and observability tools.
How CubeAPM ingests and correlates Falco alerts
CubeAPM runs on your own infrastructure alongside Kubernetes clusters, keeping all telemetry data within your environment. Falco alerts route to CubeAPM through Falcosidekick’s webhook output:
config:
  webhook:
address: https://cubeapm.example.com/ingest/falcoCubeAPM parses the alert payload, extracts pod name, namespace, and node, then queries its trace and log indexes for related data. Alerts appear in the CubeAPM UI as events on the service timeline, linked directly to the spans and logs active when the alert fired.
Because CubeAPM uses OpenTelemetry natively, it correlates Falco events with traces from any OTel-instrumented application without requiring agent changes.
Example: investigating a privilege escalation alert
Falco fires an alert: Privilege escalation attempt detected (user=appuser process=exploit.sh container=api-6d8f7b).
In CubeAPM, you navigate to the api service timeline and see the alert marked at the exact timestamp. Clicking the alert reveals:
The HTTP request trace active in that container at the time, showing the endpoint /admin/debug was called 12 seconds before the alert.
Logs from the container showing exploit.sh was written to /tmp two minutes earlier.
Infrastructure metrics showing CPU usage spiked to 95% on the node immediately after the alert.
Recent deployment history showing a new image was rolled out 30 minutes before the first suspicious activity.
This correlation immediately narrows the investigation. The team knows which endpoint triggered the exploit, when the malicious file appeared, and which deployment introduced the vulnerability. Without unified observability, each of these data points would require switching between Falco logs, APM dashboards, log aggregators, and infrastructure monitors.
Pricing and deployment model
CubeAPM charges $0.20 per GB of ingested telemetry data, covering APM traces, logs, infrastructure metrics, and ingested security events like Falco alerts. There are no per-host, per-user, or per-feature fees. Unlimited retention is included at that rate.
CubeAPM deploys inside your VPC or on-premises, meaning Falco alerts never leave your infrastructure. This fits environments with data residency requirements or compliance policies that restrict sending security telemetry to external SaaS platforms.
Setup takes under an hour for most teams. CubeAPM provides Helm charts for Kubernetes deployment and integrates directly with existing OpenTelemetry collectors, Prometheus exporters, and log shippers. Falco integration requires only the Falcosidekick webhook configuration shown above.
Best Practices for Runtime Security with Falco
Teams running Falco in production report better detection accuracy and fewer false positives after tuning rules and alert routing.
Start with high-severity rules only
Enable only CRITICAL and ERROR priority rules during initial deployment. This prevents alert fatigue while teams learn which alerts matter for their environment. After two weeks, review triggered alerts and expand to lower priorities if needed.
Tune rules for your application behavior
Default rules assume certain behaviors are suspicious, but some applications legitimately perform actions that trigger alerts. For example, a build container may need to run shells, or a monitoring agent may read /etc/shadow for auditing.
Add exceptions using and not conditions:
- rule: Shell Spawned in Container
  condition: >
    container.id != host and proc.name in (bash, sh, zsh) and
    not container.image.repository contains "build-agent"
  output: Shell in container (container=%container.name image=%container.image.repository)
priority: WARNINGThis adjustment prevents false positives from the build agent while preserving detection elsewhere.
Monitor Falco’s resource usage
Falco processes high event volumes with low CPU overhead, but poorly written rules can increase processing cost. Monitor falco_events_rate and falco_cpu_usage_seconds_total to ensure Falco stays below 5% CPU usage per node.
If CPU usage climbs, profile which rules consume the most time using falco --stats or by enabling detailed metrics output.
Test new rules in audit mode before enforcing
Falco does not block actions by default. It only detects and alerts. However, integrations with admission controllers or runtime enforcers can block workloads based on Falco alerts.
Before enabling enforcement, run new rules in audit mode for at least one week. Review match counts and false positive rates. Only enable blocking actions after confirming the rule does not disrupt legitimate workloads.
Regularly update Falco and rules
The Falco project releases new rules as threats evolve. Update both the Falco version and the rule set monthly to ensure coverage of newly discovered attack patterns.
helm upgrade falco falcosecurity/falco --namespace falcoAfter upgrading, review the changelog for new rules and adjust priorities or exceptions as needed.
Common Challenges with Falco and How to Solve Them
High false positive rates
False positives occur when rules trigger on legitimate application behavior. This happens most often with shell execution rules, file access rules, and network connection rules.
Reduce false positives by adding exceptions for known-good behavior. Use container image names, namespaces, or process arguments to narrow rule scope.
Example: exclude monitoring agents from file access rules:
- macro: monitoring_agent
  condition: proc.name in (datadog-agent, prometheus-node-exporter)
- rule: Sensitive File Access
  condition: >
    open_read and fd.name in (/etc/shadow, /etc/passwd) and
not monitoring_agentDropped events under high load
Dropped events mean Falco cannot process all incoming syscalls. This happens in very active clusters or when rules perform complex string matching on every event.
Increase Falco’s CPU allocation:
resources:
  limits:
    cpu: 2000m
  requests:
cpu: 1000mSimplify expensive rules. Replace broad regex patterns with exact matches or use macros to prefilter before applying expensive conditions.
Integration gaps with cloud-native tools
Falco captures kernel and Kubernetes events but does not natively correlate with application traces or logs. Teams often run separate observability stacks and manually cross-reference Falco alerts with APM data.
Infrastructure monitoring platforms that ingest Falco alerts alongside application telemetry solve this by providing unified timelines and automatic correlation.
Disclaimer: The information in this article reflects the latest details available at the time of publication and may change as technologies and products evolve. Features, pricing, and plan limits can change over time. Always verify the latest information directly with the vendor before making purchasing or deployment decisions.
Frequently Asked Questions
What is the difference between Falco and traditional antivirus?
Falco monitors runtime behavior in containers by analyzing syscalls and Kubernetes events. Traditional antivirus scans files for known malware signatures. Falco detects zero-day exploits and misconfigurations by flagging unexpected behavior rather than relying on signature databases.
Does Falco block threats or only detect them?
Falco detects and alerts but does not block by default. It generates alerts when rules match observed behavior. Teams integrate Falco with admission controllers or runtime enforcers to block workloads based on Falco findings.
Can Falco run on managed Kubernetes services like EKS and GKE?
Yes. Falco runs on EKS, GKE, AKS, and other managed Kubernetes platforms using the eBPF driver. Managed services often restrict kernel module loading, so the eBPF probe is the recommended deployment method.
How much performance overhead does Falco add?
Falco typically consumes 2-5% CPU per node under normal load. The eBPF driver has lower overhead than the kernel module. Performance impact depends on event rate and rule complexity.
How do I send Falco alerts to Slack or PagerDuty?
Deploy Falcosidekick alongside Falco. Configure Falcosidekick with your Slack webhook or PagerDuty routing key, then configure Falco to send alerts to Falcosidekick’s HTTP endpoint.
What Kubernetes events does Falco monitor?
Falco monitors syscalls by default. With the Kubernetes audit log plugin, it also monitors API server events like pod creation, secret access, role binding changes, and admission control decisions.
Can Falco detect privilege escalation in containers?
Yes. Falco’s default rules detect privilege escalation attempts by monitoring syscalls like setuid, setgid, and capability changes. Custom rules can extend detection to application-specific escalation patterns.