










OpenObserve and Dash0 both emerged as modern alternatives to legacy observability platforms, built from the ground up on OpenTelemetry and open standards. Both promise to eliminate vendor lock in, simplify query languages, and deliver predictable pricing without per seat fees or hidden egress charges. But beneath the surface, they solve different problems for different teams.
OpenObserve targets teams migrating from expensive SaaS platforms like Datadog or New Relic who want full-stack observability with SQL queries, self-hosted deployment, and 90% lower costs. Dash0 positions itself as the platform for cloud native teams already committed to OpenTelemetry who want a fully managed service with PromQL queries and zero lock-in by design.
This guide compares both platforms across pricing models, query languages, pipeline capabilities, deployment models, and migration paths. Every pricing figure is linked to the source page. Every feature claim is backed by product documentation or community evidence.
Quick Summary: OpenObserve vs Dash0
| OpenObserve | Dash0 | |
|---|---|---|
| Best for | Teams migrating from Datadog/New Relic who want self-hosted observability with SQL queries | Cloud native teams committed to OTel who want fully managed observability with PromQL |
| Pricing model | $0.20/GB ingested | Flat rate per million logs/spans/metric data points |
| Query language | SQL | PromQL for all signal types |
| Deployment | Self-hosted (OSS or Enterprise) or OpenObserve Cloud | Fully managed SaaS only |
| OTel native | Yes, supports OTel Collector | Yes, built on OTel from day one |
| Pipelines | Visual VRL editor with 100+ functions plus query-time transforms | Configuration file-based with a 20-processor limit |
| Data egress | Zero (self-hosted) or standard cloud egress (OpenObserve Cloud) | Zero lock-in; OTel collector points to new endpoint on exit |
| Retention | Per-stream control with object storage for long-term retention | Configurable retention per signal type |
| Vendor lock-in | Low, uses OTel and SQL | Zero by design, uses OTel and PromQL |
OpenObserve Overview
OpenObserve is an open source observability platform that unifies logs, metrics, traces, and real user monitoring into a single tool. It was built to replace expensive SaaS platforms with a self-hosted alternative that uses SQL for queries, automatically indexes all fields, and reduces storage costs by up to 140x through optimized compression and indexing.
The platform is available in three deployment models: open source self-hosted, Enterprise Edition self-hosted, and OpenObserve Cloud. All three versions share the same core SQL query engine and automatic field discovery.
Key features:
- SQL query language across all signal types
- Automatic field discovery with no manual facet creation
- Visual pipeline editor with 100+ built-in VRL functions
- Per-stream retention control with object storage support
- Self-hosted deployment with full data control
Pricing: $0.20/GB for ingestion on OpenObserve Cloud. Enterprise Edition pricing is custom. Open source is free.
Deployment: Self-hosted on your infrastructure or OpenObserve Cloud.
Best for: Teams migrating from Datadog or New Relic who want self-hosted observability with SQL queries and predictable pricing.
Dash0 Overview
Dash0 is a fully managed, OpenTelemetry native observability platform that delivers logs, metrics, and traces with zero vendor lock-in. It was built specifically for cloud native teams who have already adopted OpenTelemetry and want a cohesive platform without proprietary data formats or query languages.
The platform uses PromQL for querying all signal types, which eliminates the need to learn separate query languages for logs, traces, and metrics. Dash0 positions itself as the only observability platform where switching vendors is as simple as pointing your OTel collector to a new endpoint.
Key features:
- PromQL for logs, metrics, and traces
- Built-in spam filters that drop low-value telemetry before billing
- Zero lock-in by design; all dashboards and alerts portable
- Transparent per-signal pricing with no seat fees
- Fully managed service with no infrastructure burden
Pricing: Flat rate per million logs, spans, or metric data points. No per-user fees, no data transfer fees, no query charges.
Deployment: Fully managed SaaS only.
Best for: Cloud native teams committed to OpenTelemetry who want a fully managed observability platform with zero lock-in.
Feature-by-Feature Comparison
Query Languages: SQL vs PromQL
OpenObserve uses SQL for all queries. The same query syntax works across logs, metrics, traces, and analytics. This removes the learning curve for teams already familiar with SQL and enables complex queries with joins, subqueries, window functions, and CTEs when needed.
Example query in OpenObserve:
SELECT * FROM logs
WHERE status='warn'
AND service='cart'
AND product_id='0PUK6V6EV0'Dash0 uses PromQL for all signal types. This is the same query language used in Prometheus, making it familiar to teams already running Prometheus for metrics. Using one query language across logs, metrics, and traces eliminates the friction of switching between LogQL, TraceQL, and PromQL in platforms like Grafana.
Example query in Dash0:
{service="cart", status="warn", product_id="0PUK6V6EV0"}For teams already using SQL in their data pipelines, OpenObserve has no learning curve. For teams deeply invested in Prometheus and PromQL, Dash0 removes the need to learn new query languages.
Log Search and Field Discovery
OpenObserve automatically indexes all fields the moment logs are ingested. Every JSON field is parsed, indexed, and searchable immediately. No manual configuration. No facet creation. This removes operational friction when deploying new services or adding new log fields.
The platform also provides a dedicated Volume Analysis feature that shows how log volume is distributed across dimensions like service names, regions, clusters, and log levels. This helps teams understand data distribution patterns without writing aggregation queries.
Dash0 surfaces logs immediately but requires manual facet creation to filter by specific fields. This matches the Datadog model where preset facets like service, status, and host are available by default, but filtering by custom fields like product_id or user_id requires manual UI configuration.
For platform teams managing hundreds of microservices, OpenObserve’s automatic field discovery removes a recurring operational burden. For smaller teams with stable service architectures, the manual facet approach is manageable.
Sensitive Data Redaction
Both platforms protect PII through sensitive data redaction.
Dash0 provides 90+ out-of-the-box rules for redacting common PII patterns like social security numbers, credit card numbers, and email addresses. Redaction happens at ingestion time before data is stored.
OpenObserve provides 140+ built-in patterns with both ingestion-time and query-time redaction. Query time redaction allows teams to mask sensitive data in query results without reingesting logs, which is useful for retroactively protecting data discovered after ingestion.
Both platforms meet baseline PII protection requirements. OpenObserve’s query-time redaction adds flexibility for teams with evolving compliance needs.
Retention and Long-Term Storage
OpenObserve gives per-stream retention control with object storage support for long-term retention. Teams can configure different retention periods for different log streams and move older data to S3 or similar object storage for cost-efficient archival.
Dash0 offers configurable retention per signal type. Default retention is typically 15 days but can be extended based on customer needs. Retention changes require customer success approval in most cases.
For teams needing flexible retention across different log sources, OpenObserve’s per-stream control provides more granular control. For teams with uniform retention needs, Dash0’s per signal model is simpler to configure.
Log Patterns and Grouping
Both platforms automatically group similar logs into patterns, which reduces noise and helps identify recurring issues without manually sifting through thousands of log lines.
OpenObserve Log Patterns auto-detect recurring log structures and group them by frequency. This feature is available in Enterprise Edition and OpenObserve Cloud.
Dash0 Log Patterns cluster logs with similar structure and replace variable parts with wildcards. You see how frequently each pattern occurs and can click into specific instances.
This is one area where both platforms deliver comparable value. Neither has a clear advantage.
Query Recommendations and Indexing Optimization
OpenObserve analyzes your log queries and suggests which fields to index for faster performance. This helps teams optimize query speed without guessing which fields matter most.
Dash0 offers query recommendations for database queries but not for logs. The platform’s recommendation engine focuses on optimizing downstream database performance rather than log query performance.
For teams running high-volume log queries at scale, OpenObserve’s indexing recommendations reduce query latency without manual tuning.
Pipelines and Data Transformation
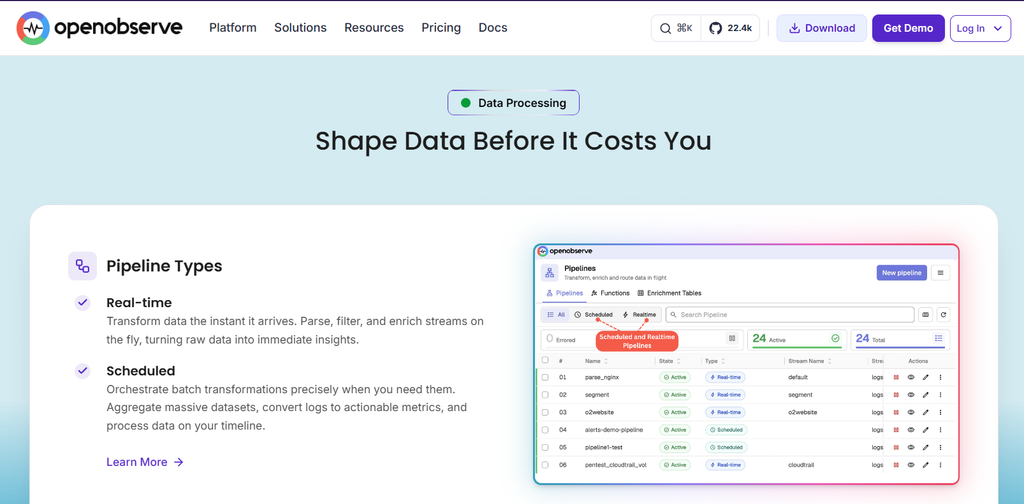
OpenObserve provides a visual pipeline editor with 100+ built-in VRL (Vector Remap Language) functions for parsing, transforming, and enriching logs at ingestion time. It also supports query-time transforms, which allow teams to test transformations without modifying the ingestion pipeline.
The visual editor reduces the barrier to building complex pipelines compared to writing configuration files by hand.
Dash0 uses configuration file-based pipelines with a 20-processor limit per pipeline. This matches the OpenTelemetry Collector model, which is familiar to teams already using OTel but requires more manual work compared to a visual editor.
For teams new to observability pipelines, OpenObserve’s visual editor is faster to learn. For teams already managing OTel Collector pipelines, Dash0’s configuration file model fits existing workflows.
Pricing Comparison
OpenObserve charges $0.50/GB for data ingested and $0.01/GB queried on OpenObserve Cloud. This is a single billing dimension with no separate charges for users, queries, or data transfer within the platform. Enterprise Edition pricing is custom based on deployment requirements.
Dash0 charges a flat rate per million logs, spans, or metric data points. There are no per-user fees, no data transfer fees, and no query charges. The platform includes built-in spam filters that drop low-value telemetry before billing, which reduces cost for noisy workloads.
Cost Scenario: 30TB Monthly Ingestion
Assumptions:
- 30TB total monthly ingestion (20TB logs, 7TB traces, 3TB metrics)
- 100 hosts monitored
- 20 users with full platform access
- 30-day retention for all signal types
| Platform | Monthly Cost | Billing Basis |
|---|---|---|
| OpenObserve Cloud | $15,000 | $0.50/GB ingested |
| Dash0 | Contact for pricing | Per million logs/spans/metric data points |
OpenObserve’s cost is straightforward: $0.50/GB multiplied by 30 TB equals $15,000 per month. Dash0’s cost depends on the specific count of logs, spans, and metric data points rather than raw GB volume, so pricing requires a quote.
For teams migrating from Datadog or New Relic, both platforms deliver 60–80% cost savings. The primary difference is billing transparency: OpenObserve uses a single per-GB rate, while Dash0 uses per-signal counts.
Who Should Choose Each Platform
Choose OpenObserve if:
- You want self-hosted deployment with full data control
- Your team already knows SQL and prefers it for queries
- You need per-stream retention control with object storage support
- You want a visual pipeline editor instead of configuration files
- You are migrating from Datadog or New Relic and want 90% lower costs
Choose Dash0 if:
- You want a fully managed service with no infrastructure burden
- Your team is deeply invested in PromQL and Prometheus
- You are committed to OpenTelemetry and want zero lock-in by design
- You want built-in spam filters that reduce billing for noisy workloads
- You need predictable pricing with no per-user fees
Consider CubeAPM if:
CubeAPM is another self-hosted observability platform that unifies APM, logs, infrastructure monitoring, Kubernetes monitoring, and real user monitoring in a single tool. It runs inside your VPC or data center, keeping all telemetry data within your infrastructure.
CubeAPM charges $0.20/GB for data ingestion with no per-user fees, no per-host charges, and unlimited data retention included. It supports OpenTelemetry, Datadog agents, Prometheus, and Elastic agents, making migration incremental rather than requiring a hard cutover.
For teams evaluating OpenObserve alternatives or Dash0 alternatives, CubeAPM delivers comparable self-hosted observability with full-stack APM capabilities and predictable pricing.
Migration Path from OpenObserve or Dash0
Both platforms use OpenTelemetry, which makes switching vendors straightforward.
If you are migrating from OpenObserve to another platform, reconfigure your OTel Collector to send telemetry to the new endpoint. Your instrumentation does not change. Dashboards and alerts need to be recreated in the new platform’s query language.
If you are migrating from Dash0 to another platform, the process is identical. Point your OTel Collector to the new endpoint. Dashboards and alerts built in PromQL can be reused in any platform that supports PromQL, like Prometheus or Grafana.
For teams evaluating either platform as a long-term solution, both minimize lock-in compared to proprietary platforms like Datadog or New Relic. The main difference is deployment model: OpenObserve offers self-hosted control, while Dash0 offers managed simplicity.
Verdict
OpenObserve and Dash0 both deliver modern, OpenTelemetry native observability with predictable pricing and zero vendor lock-in. The choice depends on deployment preference and query language familiarity.
OpenObserve is the better choice for teams that want self-hosted deployment, SQL queries, and visual pipeline tools. It fits teams migrating from expensive SaaS platforms who need full data control and per-stream retention flexibility.
Dash0 is the better choice for teams that want a fully managed service, PromQL queries, and zero infrastructure burden. It fits cloud native teams already committed to OpenTelemetry who want a cohesive platform without proprietary data formats.
For teams evaluating both platforms, the decision comes down to this: Do you want to manage the infrastructure yourself in exchange for full data control (OpenObserve), or do you want a fully managed service with zero lock-in by design (Dash0)?
Disclaimer: The information in this article reflects the latest details available at the time of publication and may change as technologies and products evolve. Features, pricing, and plan limits can change over time. Always verify the latest information directly with the vendor before making purchasing or deployment decisions.
Frequently Asked Questions
What is the main difference between OpenObserve and Dash0?
OpenObserve is a self-hosted observability platform that uses SQL for queries and provides visual pipeline tools, while Dash0 is a fully managed SaaS platform that uses PromQL for all signal types and focuses on zero vendor lock-in.
Which platform has lower costs?
Both platforms deliver up to 50% cost savings compared to Datadog or New Relic. OpenObserve charges $0.50/GB ingested. Dash0 charges per million logs, spans, or metric data points. Neither charges per user or per host.
Can I migrate from Datadog to OpenObserve or Dash0?
Yes, both platforms support OpenTelemetry, which makes migration straightforward. Reconfigure your OTel Collector to send telemetry to the new endpoint. Dashboards and alerts need to be recreated in the new platform’s query language.
Does OpenObserve support self hosted deployment?
Yes, OpenObserve is available as open source self-hosted, Enterprise Edition self-hosted, or OpenObserve Cloud. All three versions use the same SQL query engine and automatic field discovery.
Does Dash0 support self-hosted deployment?
No, Dash0 is a fully managed SaaS platform only. It does not offer self-hosted deployment.
Which platform has better pipeline capabilities?
OpenObserve provides a visual pipeline editor with 100+ built-in VRL functions and supports query-time transforms. Dash0 uses configuration file-based pipelines with a 20-processor limit, matching the OpenTelemetry Collector model.
Which query language is easier to learn?
If your team already knows SQL, OpenObserve has no learning curve. If your team is familiar with Prometheus and PromQL, Dash0 removes the need to learn new query languages for logs and traces.