MariaDB monitoring tools have become essential as the database powers an increasing number of enterprise and cloud-native workloads. It was even recognized as the “Best Overall Database”.
Yet, teams face visibility gaps, slow queries, replication lag, resource bottlenecks, limited query tracing, and disconnected dashboards that delay root-cause analysis.
CubeAPM, as the best MariaDB monitoring tools provider, solves these problems with unified observability across metrics, logs, and traces. It delivers real-time SQL analytics, OpenTelemetry-native integration, unlimited data retention, and predictable pricing.
In this article, we’ll explore the best MariaDB monitoring tools, comparing features, pricing, and use cases.
8 Best MariaDB Monitoring Tools
- CubeAPM
- New Relic
- Dynatrace
- Datadog
- Percona Monitoring and Management (PMM)
- SolarWinds Database Performance Analyzer (DPA)
- ManageEngine Applications Manager
- dbWatch Control Center
What is a MariaDB Monitoring Tool?

A MariaDB monitoring tool is a specialized observability solution that tracks the health, performance, and availability of MariaDB databases across applications and infrastructure. It continuously collects metrics such as query latency, transaction throughput, replication lag, deadlocks, and CPU or I/O utilization, giving engineers real-time visibility into how databases behave under varying workloads. By correlating these metrics with logs and traces, monitoring tools help teams detect performance bottlenecks, optimize queries, and prevent downtime before it affects end users.
For modern businesses, MariaDB monitoring is not optional—it’s critical for maintaining database reliability and ensuring smooth digital operations. Here’s why it matters:
- Faster root-cause detection: Correlates slow queries with specific application spans and infrastructure metrics, reducing mean time to resolution (MTTR).
- Optimized resource utilization: Highlights inefficient queries, memory spikes, or I/O saturation so teams can tune workloads for efficiency.
- Improved scalability: Supports growth by tracking replication and cluster health as deployments scale across multiple nodes or cloud regions.
- Proactive alerting and automation: Automatically flags anomalies in replication lag or query timeouts using thresholds or AI-based baselines.
- Enhanced customer experience: Minimizes latency and downtime in high-traffic applications like e-commerce, banking, and SaaS platforms.
Example: Diagnosing Slow Queries in MariaDB with CubeAPM
Imagine a retail analytics team running a large-scale MariaDB cluster that suddenly experiences query delays during peak hours. Using CubeAPM, engineers can visualize database performance in real time through its APM and Database Monitoring dashboards. The platform automatically traces every SQL query with its associated application spans, correlating it with CPU, disk I/O, and memory usage via the Infrastructure Monitoring module.
Within seconds, CubeAPM’s smart sampling engine identifies a subset of slow queries causing latency spikes—without capturing unnecessary data. Logs from the Log Monitoring module provide exact query statements and execution plans, while Synthetic Monitoring and Real User Monitoring (RUM) reveal how the delays impact page load times and user journeys. From a single unified dashboard, the team can pinpoint the exact query, host, and service responsible for the slowdown, reducing triage time from hours to minutes.
Why Teams Choose Different MariaDB Monitoring Tools
Cost Predictability for Database Telemetry
MariaDB environments generate fluctuating data—from slow-query logs to replication and performance metrics—which can trigger unpredictable costs with host-based or per-event pricing models. Teams on platforms like Datadog and New Relic have reported budget overruns due to metered APM and log usage. As a result, many organizations are switching to tools that offer flat, ingestion-based pricing for full-stack database observability.
SQL-Level Visibility Beyond Infrastructure Metrics
Traditional monitoring tools often stop at CPU and memory utilization, missing what really matters: query latency, lock waits, and slow execution plans. Engineers now seek MariaDB monitoring tools that integrate directly with Performance Schema and slow-query logs, correlating SQL statements with application spans to pinpoint performance bottlenecks within seconds.
OpenTelemetry-First Instrumentation
With OpenTelemetry (OTel) now a de facto standard for observability, database teams want vendor-neutral data collection that captures db.system="mariadb" attributes in traces and metrics. Tools with native OTel collectors ensure consistent telemetry across cloud services and make it easier to migrate away from proprietary agents.
Replication and Cluster Health Monitoring
Replication lag remains a top pain point for MariaDB operators managing high-availability clusters or read replicas. Tools that automatically detect Seconds_Behind_Master drift, failed replicas, or Galera cluster desyncs help prevent cascading outages. Real-time replication insights have become a key differentiator for database-focused APM platforms.
Strong Data Correlation Across Metrics, Logs, and Traces
Modern troubleshooting depends on seeing how a slow SQL query impacts the entire request path. Teams prefer solutions that link database metrics with application traces and infrastructure logs in a single timeline, reducing mean time to resolution (MTTR). This deep correlation transforms how DBAs and SREs handle latency spikes and transaction slowdowns.
Deployment Flexibility and Data Residency
Industries with strict compliance (like BFSI and healthcare) need to retain database telemetry within their own infrastructure. Tools that support self-hosted, on-prem, or private-cloud deployments—while maintaining low-latency visualization—are increasingly preferred over SaaS-only options. Flexible deployment also helps teams monitor MariaDB across hybrid and multi-cloud environments securely.
8 Best MariaDB Monitoring Tools
1. CubeAPM
Overview
CubeAPM is an OpenTelemetry-native observability platform designed for full-stack visibility across applications, databases, and infrastructure. Known for its unified MELT (Metrics, Events, Logs, Traces) architecture, it helps teams monitor complex workloads like MariaDB with precision and speed. CubeAPM has gained recognition for offering enterprise-grade performance monitoring at predictable costs, making it a preferred choice among DevOps and SRE teams seeking transparent pricing, high compatibility, and real-time diagnostics.
Key Advantage
Unifies MariaDB query analytics, infrastructure telemetry, and application traces under one dashboard—helping teams troubleshoot database performance bottlenecks in seconds.
Key Features
- MariaDB Query Tracing: Correlates slow SQL queries with application spans and infrastructure metrics for root-cause visibility.
- Performance Schema Integration: Captures latency, lock waits, and query execution data directly from MariaDB servers.
- Smart Sampling: Uses context-aware sampling to retain critical traces while reducing ingestion volume.
- Anomaly Detection: Automatically flags replication lag, slow transactions, and storage contention across clusters.
- Unified Dashboards: Combines MariaDB metrics, logs, and traces with host-level CPU, memory, and disk performance views.
Pros
- Predictable pricing with no add-ons for infrastructure or data transfer
- Seamless OpenTelemetry and Prometheus integration
- Unlimited data retention for compliance-driven environments
- Real-time collaboration via Slack and WhatsApp support channels
Cons
- Less ideal for teams preferring fully off-prem SaaS solutions
- Focused solely on observability and does not include cloud security or compliance management
CubeAPM Pricing at Scale
CubeAPM uses a transparent pricing model of $0.15 per GB ingested. For a mid-sized business generating 45 TB (~45,000 GB) of data per month, the monthly cost would be ~$7,200/month*.
*All pricing comparisons are calculated using standardized Small/Medium/Large team profiles defined in our internal benchmarking sheet, based on fixed log, metrics, trace, and retention assumptions. Actual pricing may vary by usage, region, and plan structure. Please confirm current pricing with each vendor.
Tech Fit
CubeAPM integrates seamlessly across MariaDB, MySQL, PostgreSQL, and MongoDB, with strong support for Kubernetes, Docker, Java, Python, Node.js, Go, PHP, and .NET environments. It’s especially effective for teams running containerized MariaDB clusters or microservices needing database and application observability under a single pane of glass.
2. New Relic
Overview
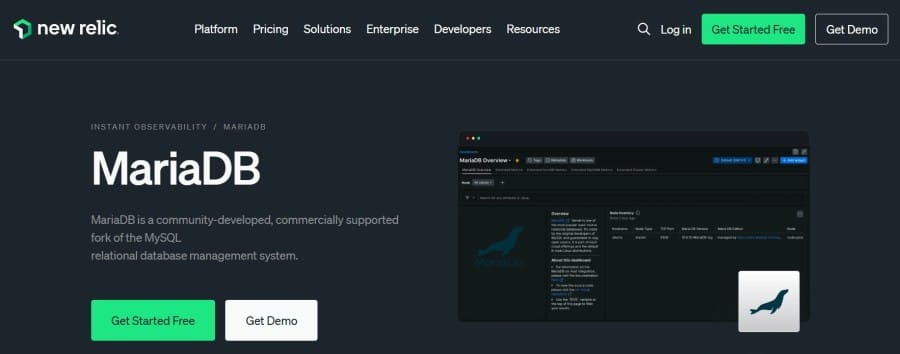
New Relic delivers full visibility into MariaDB through its native MySQL/MariaDB integration and the DBmarlin Quickstart, which brings deep SQL insights into query timing and wait events. It’s designed for developers and SRE teams who want to visualize database health, query performance, and infrastructure metrics all in one place. The platform also integrates directly with Azure Database for MariaDB, making it suitable for cloud and hybrid deployments that rely heavily on managed services.
Key Advantage
Combines native MariaDB monitoring with the DBmarlin Quickstart, offering detailed query time analysis, top SQL breakdowns, and wait event visibility for precise performance tuning.
Key Features
- Query-Level Visibility: Tracks query execution time, frequency, and performance trends to identify inefficient statements.
- Managed MariaDB Support: Built-in monitoring for Azure Database for MariaDB with ready dashboards and alert policies.
- DBmarlin Quickstart Integration: Adds advanced SQL performance analysis, top queries, and database time breakdown.
- Infrastructure and Database Correlation: Links host metrics like CPU and I/O with MariaDB query activity.
- Instant Observability Catalog: One-click dashboards and alerts tailored for MariaDB performance optimization.
Pros
- Unified view of applications, infrastructure, and databases
- Quick deployment through prebuilt integrations and dashboards
- Strong ecosystem support for multi-cloud and hybrid workloads
Cons
- Per-GB data ingest pricing can escalate with heavy MariaDB query or log traffic
- SaaS-only; no self-hosting
New Relic Pricing at Scale
New Relic’s billing is based on data ingested, user licenses, and optional add-ons. The free tier offers 100 GB of ingest per month, then it costs $0.40 per GB after that. For a business ingesting 45 TB of logs per month, the cost would come around $25,990/month*.
Tech Fit
New Relic is ideal for teams already embedded in its ecosystem or using Azure Database for MariaDB. It’s particularly suited for developers seeking detailed SQL diagnostics alongside application and infrastructure monitoring, making it a solid choice for cloud-native teams that need correlated insights across the full stack.
3. Dynatrace
Overview
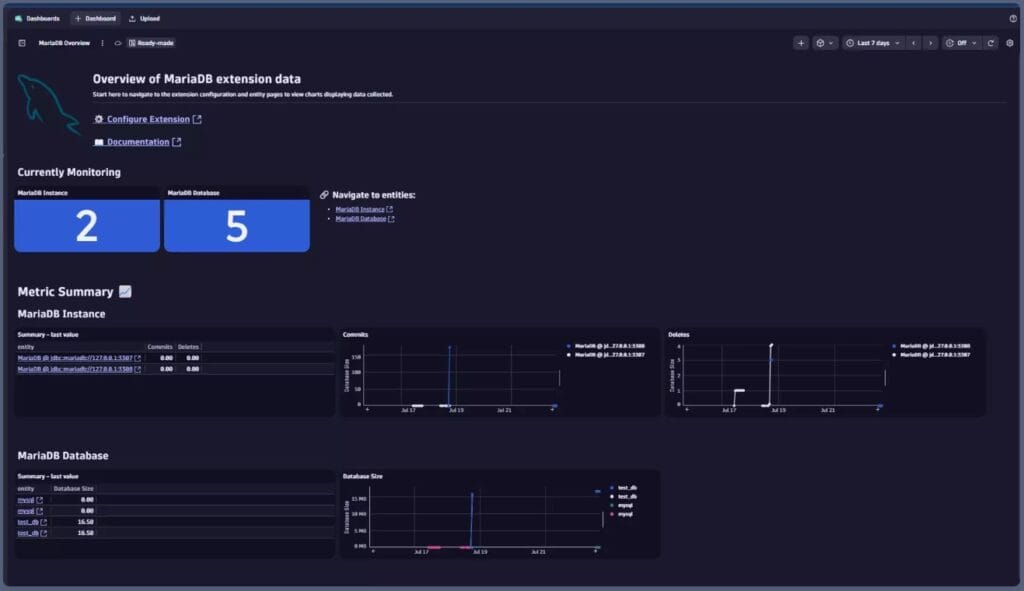
Dynatrace provides end-to-end MariaDB visibility through OneAgent-based database service monitoring and remote extensions when agents can’t be installed. Teams get statement-level insights, dependency maps from services to MariaDB, and anomaly detection via Davis AI—covering self-hosted MariaDB, Kubernetes, and managed offerings like Azure Database for MariaDB.
Key Advantage
Brings single-SQL-statement visibility into context with service traces, host metrics, and AI-driven anomaly detection so database slowdowns are tied directly to the impacted service and node.
Key Features
- Query-level analytics: Surfaces slow or error-prone SQL, aggregations by normalized statements, and execution-time trends.
- Remote DB monitoring: Uses extensions to monitor MariaDB/MySQL when OneAgent isn’t available (e.g., appliances, managed PaaS).
- Managed-service integrations: Pulls Azure Database for MariaDB metrics and health for cloud deployments.
- Topology & dependency mapping: Auto-discovers service→database calls to visualize blast radius during incidents.
- AI-assisted detection: Davis AI highlights abnormal query time, connection spikes, and I/O saturation for faster triage.
Pros
- Strong end-to-end correlation from services to individual SQL
- Mature AI-driven problem detection and root-cause hints
- Works across hosts, containers, Kubernetes, and managed MariaDB services
Cons
- Host-hour plus data ingestion pricing can become expensive at scale
- Steep learning curve
Dynatrace Pricing at Scale
- Full stack: $0.01/8 GiB hour/month or $58/month/8GiB host
- Log Ingest & process: $0.20 per GiB
For a similar 45 TB (~45,000 GB/month) volume, the cost would be $21,850/month*.
Tech Fit
Best for enterprises standardizing on Dynatrace across Kubernetes and hybrid estates who want database-to-service correlation, AI-assisted anomaly detection, and coverage for self-hosted MariaDB and Azure Database for MariaDB within a single observability platform.
4. Datadog
Overview
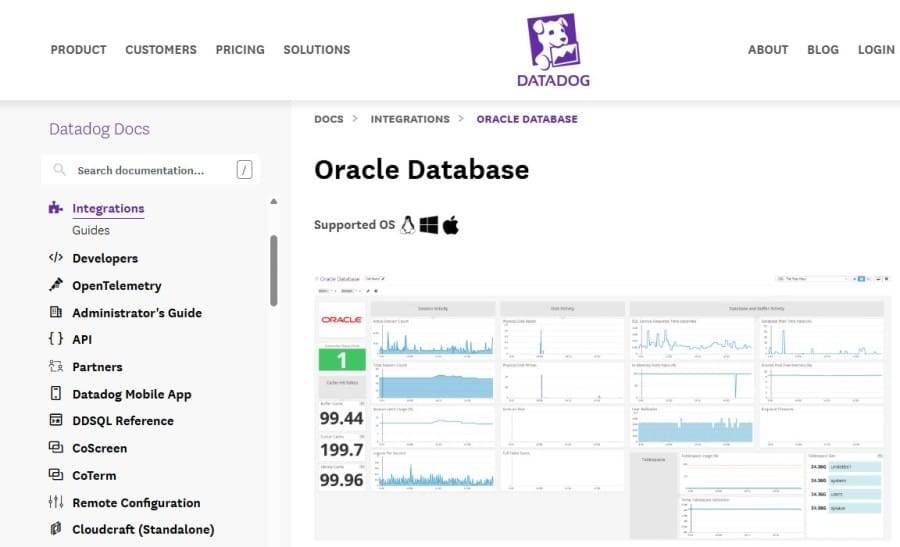
Datadog is one of the most widely adopted observability platforms, offering dedicated Database Monitoring (DBM) for MariaDB and MySQL. It gives teams deep insight into query performance, execution plans, and schema efficiency, all within the same dashboards used for infrastructure and APM. Known for its maturity and broad ecosystem, Datadog fits enterprises that want a single pane of glass for databases, services, and hosts.
Key Advantage
Delivers advanced query analytics and visualizations that combine MariaDB query metrics with host and application performance for faster diagnosis of database bottlenecks.
Key Features
- Slow Query Analytics: Identifies long-running or resource-heavy queries, displaying real-time trends and baselines.
- Explain Plans & Query Normalization: Groups similar queries for easier comparison and optimization.
- InnoDB & Connection Metrics: Monitors throughput, replication, locks, and buffer usage for MariaDB environments.
- Managed Service Support: Offers native setup for RDS, Aurora, and Azure Database for MySQL.
- Lock & Wait Monitoring: Detects query contention and concurrency issues impacting performance.
Pros
- Mature dashboards and robust visualization options
- Strong integrations for multi-cloud and managed MariaDB services
- Rich ecosystem of APM, log, and infrastructure modules
Cons
- SaaS-only; no self-hosting
- Complex multi-tier pricing can make large-scale deployments expensive
Datadog Pricing at Scale
Datadog charges differently for different capabilities. APM starts at $31/month; infra starts at $15/month; logs start at $0.10/GB, and so on. For a mid-sized business ingesting around 45 TB (~45,000 GB) of data per month, the cost would come around $27,475/month*. Plus, Database monitoring starts at $70/host/month. For 10 hosts,
- Database Monitoring: $700
Tech Fit
Datadog works well for organizations already using its ecosystem—particularly Kubernetes, AWS, and Azure users. It’s suited for teams running MariaDB on RDS or hybrid environments and needing tight integration between database, application, and infrastructure performance monitoring.
5. Percona Monitoring and Management (PMM)

Overview
Percona Monitoring and Management (PMM) is a free, open-source database monitoring suite built by Percona, widely adopted by DBAs for deep MariaDB/MySQL performance diagnostics. It ships with purpose-built dashboards and Query Analytics that surface Performance Schema and slow-log insights, replication health, and InnoDB internals—making it a strong fit when you want granular SQL visibility without a proprietary agent.
Key Advantage
Purpose-built Query Analytics (QAN) that turns MariaDB performance data (slow log or Performance Schema) into actionable views of top queries, waits, and regressions.
Key Features
- Query Analytics (QAN): Surfaces top MariaDB statements with latency, rows, errors, and plan/change history for fast tuning.
- Performance Schema & Slow Log: Collects SQL latency, waits, and locking data from native MariaDB sources for accurate RCA.
- Replication & InnoDB Dashboards: Tracks replica delay, thread states, buffer pool, I/O, and checkpoint behavior with drill-downs.
- Exporter-based Collection: Uses proven exporters for node and MariaDB metrics; Grafana dashboards for flexible visualization.
- Alerting & Annotations: Threshold alerts on critical DB signals with timelines that tie query spikes to system changes.
Pros
- Free and open-source with an active community
- Deep SQL diagnostics tailored to MariaDB and MySQL
- Works on-premises and in air-gapped or regulated environments
- Flexible Grafana dashboards and exporter ecosystem
Cons
- Requires self-hosting, scaling, and maintenance by your team
- Limited native correlation with application traces unless you integrate other APM tools
PMM Pricing at Scale
PMM has no license fees; your cost is infrastructure (compute, storage, backups) and the engineering time to deploy, maintain, and scale the stack. For a mid-sized company emitting 45 TB/month of MariaDB telemetry, total spend depends on retention targets and HA storage.
Tech Fit
Best for teams with strong DBA/SRE capacity running self-hosted MariaDB (bare-metal, VMs, or Kubernetes) who want OSS control and SQL-first visibility. Works well alongside Prometheus/Grafana stacks; can be paired with an APM if you also need end-to-end trace correlation.
6. SolarWinds Database Performance Analyzer (DPA)
Overview
SolarWinds DPA is a long-standing database performance tool known for wait-time analytics and query tuning across MariaDB and other engines. It’s positioned for DBA teams that want deep SQL diagnostics and advisory insights without adopting a full APM suite, and it slots into mixed estates that run MariaDB alongside Oracle, SQL Server, and PostgreSQL.
Key Advantage
Pinpoints the exact wait events and SQL statements causing latency in MariaDB, turning noisy performance symptoms into a focused, fix-this-query workflow.
Key Features
- Wait-Time Analytics: Highlights top waits, blocking, and contention to explain why queries are slow.
- Query & Plan Insight: Surfaces problematic SQL, historical trends, and plan changes for targeted tuning.
- Deadlock & Lock Analysis: Detects lock chains and deadlocks so you can remediate contention quickly.
- Advisors & Anomaly Detection: Rule-based guidance and baselines to catch regressions before they escalate.
- Repository-Backed History: Stores performance data for long-term forensics and capacity planning.
Pros
- Deep MariaDB query tuning with clear wait-based explanations
- Broad multi-database coverage for heterogeneous estates
- Useful advisors and historical context for capacity planning
Cons
- Licensed per database instance, which can add up as environments scale
- Focused on database performance and not a full MELT observability stack
DPA Pricing at Scale
DPA is priced starting at $1,699 per database instance for subscription licensing. Since it is licensed per instance, scaling costs are tied to the number of MariaDB servers monitored rather than GB-ingested telemetry.
Tech Fit
Best for DBA-led teams that need in-depth MariaDB query tuning in mixed database environments, on-prem or cloud (including managed MariaDB). Works well when you want surgical SQL diagnostics and will complement, rather than replace, a broader observability platform.
7. ManageEngine Applications Manager
Overview
ManageEngine Applications Manager offers built-in MySQL/MariaDB monitoring aimed at ops teams that want database health, availability, and capacity trends alongside servers and apps in one console. It discovers MariaDB instances, collects core engine metrics (connections, InnoDB, replication), and layers thresholds, alerts, and reports for day-to-day DBA operations without stitching multiple tools.
Key Advantage
Operationally focused MariaDB health tracking with ready dashboards, threshold-based alerts, and long-term reports that help catch capacity and replication issues early.
Key Features
- Replication & Availability: Tracks replica delay, status, and availability to prevent data drift during failovers.
- InnoDB Internals: Monitors buffer pool usage, I/O, and row operations to spot storage or memory pressure quickly.
- Session & Connection Dynamics: Watches active threads, connection spikes, and aborted connections to detect saturation.
- Workload & Throughput: Surfaces queries per second, temp tables, and table scans to highlight inefficient workloads.
- Alerting & Reporting: Threshold-based alerts, RCA notes, and trend reports for capacity planning and SLA reviews.
Pros
- Simple, admin-friendly setup for MariaDB alongside apps and servers
- Solid thresholding, alerting, and reporting for operations teams
- Works well for VM and on-prem MariaDB in mixed Windows/Linux estates
Cons
- Limited features and customization
- Complexity for new users
Applications Manager Pricing at Scale
Applications Manager uses edition- and instance-based licensing (quote-based on the official site), not per-GB ingest. That means total cost scales with how many MariaDB databases and other monitors you manage—rather than telemetry volume.
Tech Fit
A good operational fit for on-prem and VM-based MariaDB where teams want consolidated monitoring across databases, servers, and applications, and prefer thresholded alerts and reporting over deep SQL tracing. Works best in traditional IT environments that value a single console for infra + DB health.
8. dbWatch Control Center
Overview
dbWatch Control Center is a database-centric monitoring and management suite built for large estates. MariaDB emphasizes farm-wide observability, automated health checks, and capacity planning, scaling from a handful of instances to thousands while keeping overhead low.
Key Advantage
Purpose-built, instance-aware monitoring that surfaces MariaDB replication state, SQL performance, and resource trends across big fleets—without requiring a full APM stack.
Key Features
- Performance Schema SQL stats: Collects statement digests, latency, and rows from Performance Schema for accurate SQL profiling.
- Replication visibility: Tracks replica state and count, highlighting drift, role changes, and lag across clusters.
- Lock & contention insight: Monitors lock waits and blocking so you can resolve deadlocks and hot tables quickly.
- Capacity & trend reporting: Analyzes storage, CPU, memory, and connection growth for forecasting and rightsizing.
- Cross-platform fleet view: Centralizes MariaDB alongside other engines for unified operations and alerting.
Pros
- Strong MariaDB fleet management with low overhead
- Clear replication and SQL-level health jobs out of the box
- Works on-prem, hybrid, or cloud with instance-based control
Cons
- Per-instance licensing can add up costs at scale
- Limited native correlation with application traces and end-to-end APM
dbWatch Pricing at Scale
dbWatch uses subscription, per-database-instance licensing with optional add-ons (e.g., an SQL performance package). Costs scale with the number of MariaDB instances, not by GB ingested.
Tech Fit
A strong operational choice for DBAs managing large MariaDB fleets who need replication, SQL performance, and capacity oversight in one console. Best when you prioritize instance-level control and reporting, and pair it with an APM if you also need trace-level application correlation.
How to Choose the Right MariaDB Monitoring Tools
SQL-Level Telemetry and Query Visibility
Select tools that go beyond infrastructure graphs and collect metrics directly from Performance Schema and slow-query logs. SQL-aware visibility lets engineers detect lock waits, missing indexes, and query latency in real time—critical for maintaining healthy MariaDB workloads.
Replication and High-Availability Awareness
Your monitoring platform should natively track replication delay, Seconds_Behind_Master, and Galera cluster states. Real-time alerts on lag or desyncs ensure data consistency across primaries and replicas, preventing cascading failures.
Deep Correlation Across Metrics, Logs, and Traces
Choose tools that link a slow SQL query to its originating span, host metrics, and logs in a single view. This cross-signal context dramatically shortens mean time to resolution and simplifies multi-service troubleshooting—essential for complex MariaDB-backed systems.
OpenTelemetry-Native Collection
OpenTelemetry support ensures that database spans and metrics use consistent attributes like db.system="mariadb". OTel-first tools future-proof your observability stack and eliminate lock-in with proprietary agents.
Cost Predictability and Scale Efficiency
MariaDB workloads can spike during analytics or batch operations, inflating telemetry volume. Favor platforms offering flat ingestion-based pricing rather than complex host or user licensing, ensuring costs remain stable as data grows.
Conclusion
Choosing the right MariaDB monitoring tool can be overwhelming. Many teams struggle with unpredictable pricing, fragmented dashboards, and tools that fail to deliver true SQL-level visibility. As data volumes grow, these pain points lead to higher costs, slower investigations, and observability.
CubeAPM eliminates these challenges with a unified observability platform purpose-built for modern databases like MariaDB. It combines logs, metrics, and traces in a single dashboard, offering real-time query tracing, smart sampling, and cost-efficient $0.15/GB ingestion, without hidden fees or add-ons.
Schedule your FREE demo today with CubeAPM.
Disclaimer: The information in this article reflects the latest details available at the time of publication and may change as technologies and products evolve.
FAQs
1. What are the key metrics to monitor in MariaDB?
Key metrics include query latency, replication lag, connection count, buffer pool usage, and I/O performance. Tracking these helps ensure optimal performance and quick identification of slow queries.
2. How does CubeAPM help in monitoring MariaDB performance?
CubeAPM integrates directly with MariaDB to capture query traces, replication metrics, and resource utilization in real time. It correlates database events with infrastructure and application data, giving end-to-end visibility.
3. Can MariaDB monitoring tools detect slow or locked queries automatically?
Yes. Most modern tools, including CubeAPM, support automated detection of slow queries and lock waits using Performance Schema and slow-log data.
4. What’s the difference between infrastructure monitoring and MariaDB monitoring?
Infrastructure monitoring focuses on host-level performance (CPU, memory, storage), while MariaDB monitoring dives into SQL-level visibility—tracking queries, replication health, and schema efficiency.
5. Is CubeAPM suitable for large-scale or hybrid MariaDB environments?
Absolutely. CubeAPM supports on-prem, hybrid, and cloud deployments with OpenTelemetry-native architecture, making it ideal for scaling MariaDB workloads without cost or performance trade-offs.


