With .NET 8 and soon .NET 9, Microsoft’s framework powers everything from ASP.NET Core e-commerce apps to EF Core and gRPC-based financial systems. But .NET teams still face blind spots—like N+1 query regressions, thread-pool starvation, noisy logs that drive up costs, and agent-based tools struggling with gRPC or .NET Aspire.
CubeAPM is the ideal tool for addressing these challenges. It is built for modern .NET workloads. With OpenTelemetry-native support, it captures ASP.NET Core, EF Core, gRPC, and HttpClient traces out of the box, while trace–log correlation, RED metrics dashboards, and an error inbox help teams quickly troubleshoot async and Azure-hosted applications—at a fraction of the cost of legacy APMs.
This guide ranks the best .NET APM tools, led by CubeAPM, and highlights deep .NET instrumentation, OpenTelemetry-native pipelines, Azure readiness, pricing examples at 10 TB/month ingestion, and tool-by-tool reviews to help you find the right fit.
Best .NET APM Tools
- CubeAPM
- Splunk AppDynamics
- Sentry
- Datadog
- New Relic
- Dynatrace
- Azure Monitor
- Elastic Observability
What is .NET Monitoring?
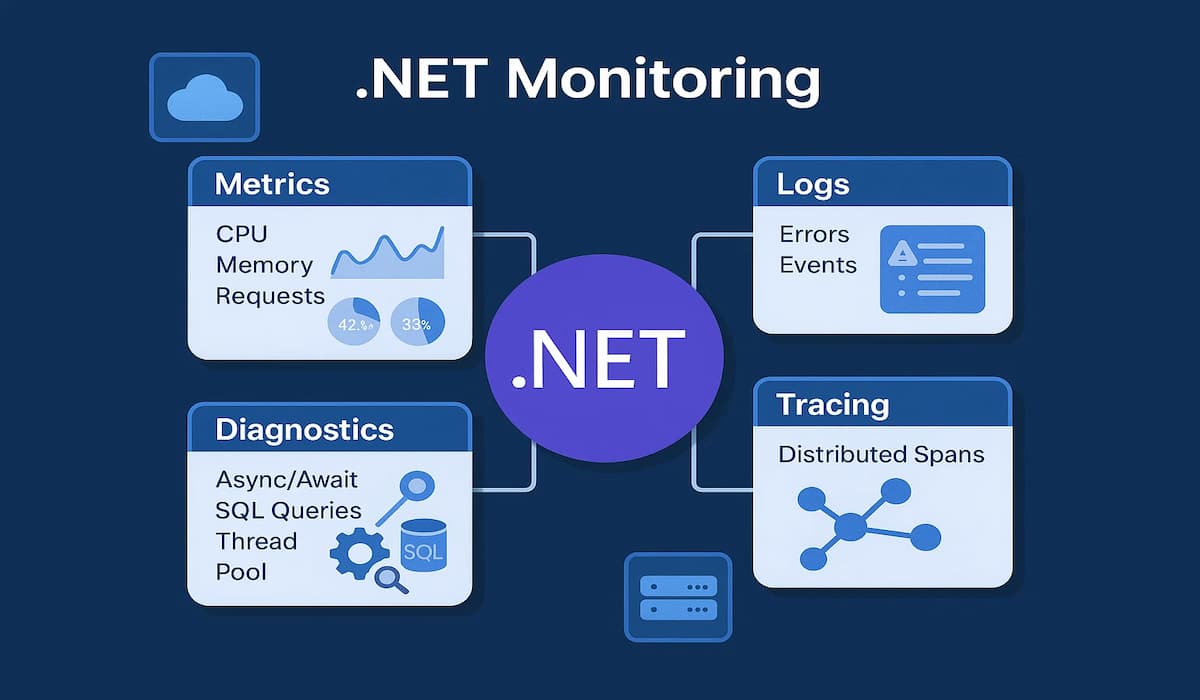
As applications grow more complex, monitoring becomes critical to ensure reliability, performance, and cost control. .NET monitoring refers to the process of tracking the runtime health, performance metrics, and user experience of .NET applications. It gives engineering and DevOps teams visibility into how their applications behave in production, helps identify bottlenecks, and provides the diagnostic data needed to resolve issues quickly.
A complete .NET monitoring strategy typically covers four areas:
- Runtime & Infrastructure Metrics – Tracking CPU usage, memory consumption, garbage collection cycles, thread-pool activity, connections, and JIT compilation. These metrics ensure the .NET runtime itself is operating smoothly.
- Application-Level Performance – Monitoring response times for APIs and services, database query latency, external API call durations, and exception rates. This helps pinpoint where the application is slowing down.
- Distributed Tracing & Diagnostics – Mapping requests across services, correlating traces with logs, and providing full request visibility in microservice and cloud environments. This is especially important for ASP.NET Core microservices running in Kubernetes or Azure.
- Real-Time Diagnostics – Leveraging tools such as dotnet-monitor or APM platforms to capture traces, logs, memory dumps, and live metrics directly from production workloads for faster debugging.
Example: How CubeAPM Handles .NET Monitoring
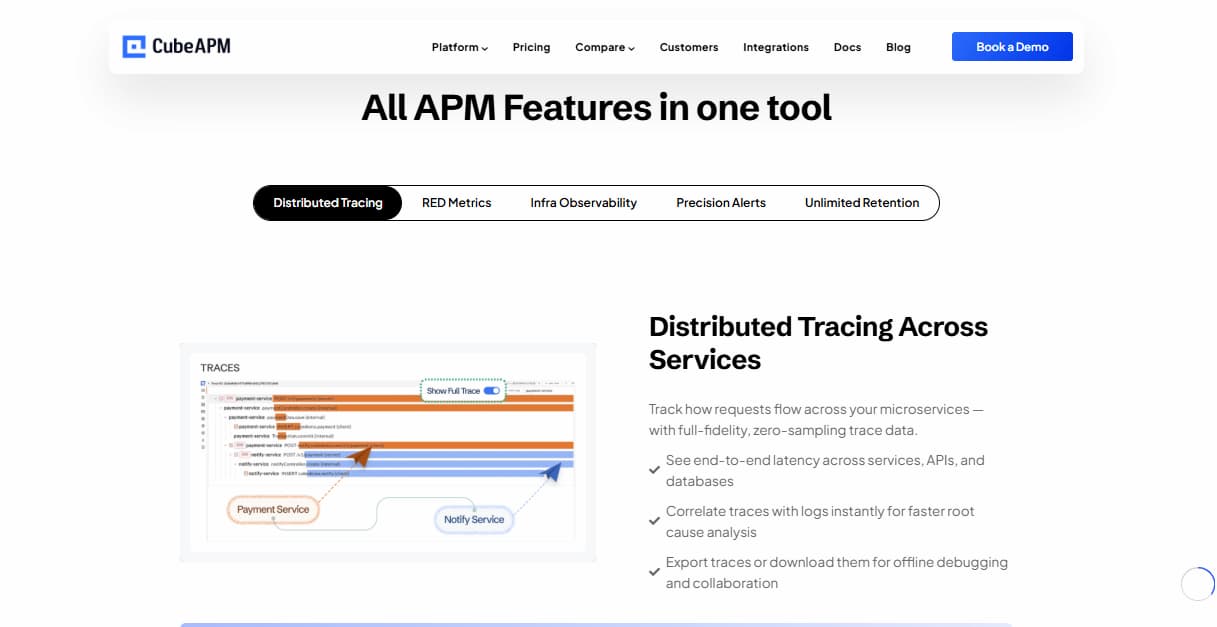
CubeAPM gives .NET teams end-to-end visibility into their applications, infrastructure, and user experience. Unlike traditional APMs that depend on heavy agents, CubeAPM is OpenTelemetry-native, meaning .NET apps built on ASP.NET Core, EF Core, HttpClient, or gRPC can stream telemetry directly without code changes. Ingested data is enriched with contextual metadata, correlated across traces, logs, and metrics, and visualized in real time through service maps, RED metrics dashboards, and error inboxes.
Beyond application-level monitoring, CubeAPM also captures infrastructure telemetry from hosts, Kubernetes clusters, SQL databases, and messaging systems via the OpenTelemetry Collector. Logs, Real User Monitoring (RUM), and Synthetic Monitoring are included by default, giving .NET teams a unified observability workflow from backend services to frontend sessions.
CubeAPM’s Key Components & Features for .NET Monitoring
1. OpenTelemetry-Native Ingestion
Direct OTLP support for .NET apps, with optional migration paths from New Relic agents.
2. Application Performance Monitoring
- Distributed tracing across .NET microservices
- Dashboards for latency, error rates, and throughput
- Error Inbox to group and prioritize exceptions
- Service graphs to map dependencies
3. Infrastructure Monitoring via OTEL Collector
Integrations for Kubernetes, SQL Server, MySQL, Redis, Kafka, Nginx, and more, with ready dashboards and Prometheus metrics support.
4. Logs, RUM, and Synthetic Monitoring
Included by default in all tiers—no hidden add-ons or extra licensing.
5. Smart Sampling & Cost Efficiency
Latency- and error-aware sampling reduces telemetry volume by 60–80% while preserving critical insights.
Why Teams Choose Different .NET Monitoring Tools
1. Memory Leaks and Resource Exhaustion
In long-running .NET applications, unused objects may not be released properly, causing gradual memory bloat. Over time, this can lead to crashes, degraded performance, or servers becoming unresponsive. Monitoring helps teams track garbage collection behavior and memory allocation, so leaks can be caught before they impact users.
2. High CPU Usage and Inefficient Code Paths
Inefficient loops, poorly optimized routines, or heavy logging often push CPU usage to dangerous levels. This not only slows response times but may trigger auto-scaling in cloud environments, leading to unnecessary cost increases. Monitoring makes it easier to spot these bottlenecks and optimize execution paths.
3. Slow Queries and Distributed Latency
Database calls, third-party APIs, and inter-service communication are common choke points in .NET systems. A single slow query can ripple through the entire stack and drag down performance. Monitoring provides visibility into query execution times and service dependencies, allowing teams to pinpoint and fix delays.
4. Synchronization and Locking Issues
In highly concurrent .NET applications, poor use of locks or synchronization primitives can cause thread-pool starvation and reduced throughput. These issues are difficult to detect without detailed monitoring of thread activity and contention. With proper observability, teams can identify lock-heavy code and redesign it for scalability.
5. Excessive or Misconfigured Logging
When debug or verbose logs are left enabled in production, they flood the system with unnecessary data. This increases ingestion costs and can even slow down applications. Monitoring tools that integrate log management help filter noise, enforce log levels, and balance visibility with cost control.
6. Limited Visibility Across Microservices
Modern .NET applications often run as distributed systems on Kubernetes or in hybrid cloud environments. Without distributed tracing, following a request end-to-end across services is nearly impossible. Monitoring enables that holistic view, making it easier to diagnose issues that span multiple services.
7. Reactive Instead of Proactive Operations
Without the right tooling, many teams only discover problems once users complain. This reactive approach leads to firefighting instead of prevention. Monitoring equips teams with real-time dashboards and alerts, allowing them to identify anomalies early and resolve them before they escalate.
Top 8 .NET APM Tools
1. CubeAPM

Known for
CubeAPM is known for being an OpenTelemetry-native observability platform that unifies APM, infrastructure monitoring, logs, RUM, and synthetic checks in one system. It stands out for its flat $0.15/GB pricing, which eliminates hidden host or feature-based charges. With support for self-hosting and BYOC, CubeAPM is often chosen by compliance-driven industries that need full control over telemetry.
.NET Monitoring Features
- Auto-instrumentation for ASP.NET Core, HttpClient, EF Core, SqlClient, and gRPC
- Async/await and thread-pool visibility
- Trace–log correlation and RED metrics dashboards
- Error inbox for prioritizing issues
- Azure App Services, Functions, and Kubernetes support
Key Features
- Full-stack observability (metrics, logs, traces, RUM, synthetics, error tracking)
- OpenTelemetry-native ingestion with OTLP support
- Smart Sampling engine for latency/error-aware trace retention
- Prebuilt RED metrics dashboards and customizable queries
- Error Inbox for exception grouping and prioritization
- Infrastructure monitoring with Kubernetes, SQL Server, Redis, Kafka, and more
- 800+ integrations with CI/CD tools, cloud services, and DevOps stacks
Pros
- Transparent flat-rate pricing keeps costs predictable even at high ingestion volumes
- OpenTelemetry-native design ensures compatibility with .NET Aspire and Azure Monitor
- Smart sampling reduces data overhead while preserving critical traces
- Direct Slack and WhatsApp support provides faster response times than ticket systems
- On-premise and self-host deployment options meet strict compliance needs
- Scales efficiently for organizations ingesting terabytes of telemetry data
Cons
- Not suited for teams looking for off-prem solutions
- Strictly an observability platform and does not support cloud security management
Pricing
- Flat of $0.15/GB ingestion
CubeAPM .NET Monitoring Pricing At Scale
*All pricing comparisons are calculated using standardized Small/Medium/Large team profiles defined in our internal benchmarking sheet, based on fixed log, metrics, trace, and retention assumptions. Actual pricing may vary by usage, region, and plan structure. Please confirm current pricing with each vendor.
For a mid-sized SaaS company ingesting 45TB(~45,000) total monthly data ingestion and 45,000TB of observability data outcharged by the cloud provider, the total cost will be about ~$7200/month.
Tech Fit
CubeAPM is best suited for engineering teams managing high-volume, cloud-native, or hybrid workloads who want predictable costs and modern observability. It’s particularly effective for .NET, Java, and microservice-based applications where OpenTelemetry adoption, cost optimization, and compliance are key. By combining MELT data with RUM and synthetics in a single workflow, CubeAPM provides a complete alternative to costly, fragmented APM suites.
2. Splunk AppDynamics
Known for
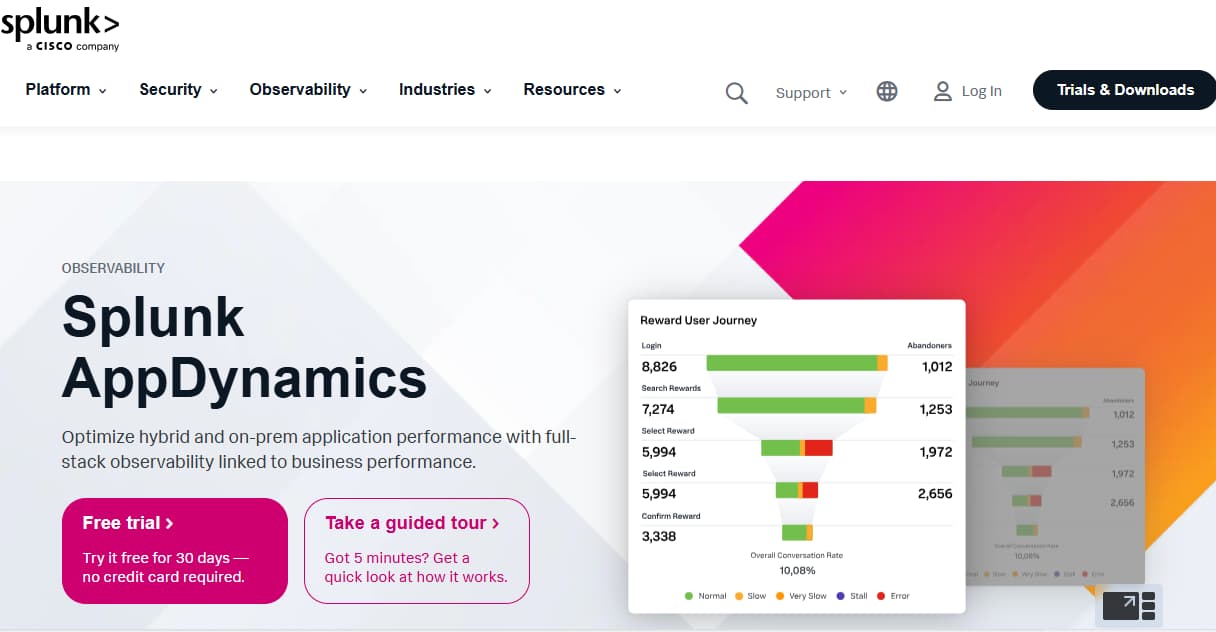
Splunk APM is known for its OpenTelemetry-native design and full-fidelity, NoSample trace ingestion, which gives engineering teams complete visibility into distributed systems. It’s part of the Splunk Observability Cloud, which integrates infrastructure metrics, logs, RUM, and synthetic monitoring into one SaaS platform. Splunk is often adopted by enterprises already invested in Splunk’s logging ecosystem and looking to extend into APM with tight correlation across metrics and events.
.NET Monitoring Features
- Auto-instrumentation for ASP.NET Core, HttpClient, EF Core, and ADO.NET via OTel SDKs
- Distributed tracing with support for W3C TraceContext across .NET services
- AlwaysOn Profiler for continuous insight into async/await performance and thread contention
- Automatic correlation of metrics, logs, and traces within Splunk Observability Cloud
- Support for Azure App Services and Kubernetes workloads via OTel collectors
Key Features
- NoSample full-fidelity trace ingestion for complete request visibility
- AlwaysOn continuous profiling for detecting performance bottlenecks
- Service maps with dependency-aware visualization of microservices
- AI-driven analytics for anomaly detection and root cause analysis
- Tag-based analytics for high-cardinality data exploration
Pros
- OpenTelemetry-native design fits modern .NET observability pipelines
- AlwaysOn Profiler offers continuous performance visibility without extra overhead
- Strong tag-based analytics for slicing and dicing .NET telemetry data
- SaaS model reduces operational burden—no heavy stack management
- Good integrations with Splunk Enterprise logs for unified monitoring
Cons
- Expensive at scale.
- Complex user interface.
- Overwhelming UI, especially for new users.
Pricing
- AppDynamics APM: starts at $33/month/CPU core
- Infra Monitoring: starts at $6/month/CPU core
Splunk AppDynamics .NET Monitoring Pricing At Scale
For a mid-sized SaaS company running 125 hosts and 45,000GB of observability data out(charged by cloud provider), the cost will be around ~$8,625/month.
Tech Fit
Splunk APM is best suited for large enterprises and DevOps teams that require high-cardinality analytics, continuous profiling, and full-fidelity traces at scale. It fits particularly well for organizations already using Splunk Enterprise or Splunk Cloud for log management, as it allows unified observability across telemetry types. While pricing can be premium, it delivers deep analytics and correlation for complex microservice architectures, hybrid cloud estates, and large-scale application environments.
3. Sentry
Known for
Sentry is known as a developer-first error tracking and lightweight APM platform. It started with exception monitoring for client- and server-side apps, then expanded into tracing and performance monitoring. Its strength lies in helping developers quickly identify, group, and resolve application errors with rich context, stack traces, and release health metrics.
.NET Monitoring Features
- SDK support for ASP.NET Core and .NET Framework
- Performance monitoring with distributed tracing for .NET APIs
- Error grouping and stack trace visibility for faster debugging
- Release health to track regressions after deployments
- Integration with popular .NET logging libraries (Serilog, NLog, log4net)
Key Features
- Real-time error tracking with automatic grouping and prioritization
- Distributed tracing for performance bottlenecks in APIs and services
- Release health tracking to spot regressions after deployments
- Integration with popular logging libraries like Serilog, NLog, and log4net
- Session Replay (frontend) for reproducing user issues
Pros
- Excellent error tracking and alerting for .NET teams
- Simple setup with NuGet SDKs and minimal config
- Affordable entry point compared to enterprise APMs
- Strong CI/CD integrations for developer workflows
- Real-time release health makes it easy to track new errors
Cons
- Costs scale sharply with event volume
- No native support for infrastructure metrics, logs
- Complex configuration setup
- Expensive at scale
- Delays in error reporting, alerts, and display
Pricing
- Developer – Free: 1 user, Error monitoring and tracing, Alerts/notifications via email
- Team – $26/month: Everything in Developer + Unlimited users, Third-party integrations
- Business – $80/month: Everything in Team + Insights (90-day lookback), Unlimited custom dashboards
- Enterprise – Custom Pricing Everything in Business + Technical account manager
Sentry .NET Monitoring Pricing At Scale
For a mid-sized SaaS company ingesting 10,000 TB (~10,000GB) of logs, 500,000,000 indexed spans, and 45,000GB of observability data (charged by the cloud provider), the cost would come around $12,100/month.
Tech Fit
Sentry is best suited for development teams that prioritize debugging and rapid issue resolution rather than deep infrastructure monitoring. It’s an excellent choice for .NET application teams that want to catch errors early, monitor release stability, and integrate seamlessly into developer workflows. While not designed for massive telemetry ingestion like CubeAPM or Splunk, Sentry provides a lightweight, developer-friendly observability layer that complements larger monitoring platforms.
4. Datadog
Known for
Datadog is known for being one of the most comprehensive SaaS observability platforms, with a massive ecosystem of integrations (900+). It brings together APM, infrastructure monitoring, logs, security, RUM, and synthetics in a single platform. Its strength lies in breadth—supporting virtually any stack or cloud provider—which makes it popular among mid-to-large enterprises adopting multi-cloud and containerized workloads.
.NET Monitoring Features
- Auto-instrumentation for ASP.NET Core, ADO.NET, EF Core, and gRPC
- Continuous profiler for async/await code and lock contention
- Correlated metrics, logs, and traces for .NET services
- Support for IIS, Kestrel, Azure App Services, and Kubernetes
- Custom instrumentation via APIs and SDKs
Key Features
- 900+ integrations across cloud, infrastructure, and DevOps tools
- Distributed tracing and application performance monitoring
- Continuous profiler for CPU, memory, and lock contention issues
- Real-time infrastructure monitoring for hosts, containers, and Kubernetes
- Log management with analytics, indexing, and archiving options
Pros
- Extensive library of 900+ integrations covering infrastructure, cloud, and developer tools
- Mature dashboards and visualization options for .NET and hybrid environments
- Continuous profiler provides deep insight into performance bottlenecks
- Strong ecosystem with community resources, plugins, and wide adoption
- Good support for hybrid cloud and microservice deployments
Cons
- Pricing becomes unpredictable as data ingestion and host counts increase
- Steep learning curve for new users due to the broad feature set
Pricing
- APM (Pro Plan): $35/host/month
- Infra (Pro Plan): $15/host/month
- Ingested Logs: $0.10 per ingested or scanned GB per month
Datadog .NET Monitoring Pricing At Scale
For a mid-sized SaaS company operating 125 APM hosts, 40 profiled hosts, 100 profiled container hosts, 200 infrastructure hosts, 1.5 million container hours, 300,000 custom metrics, 500 million indexed spans, and 3,500 indexed logs, while ingesting approximately 10 TB (≈10,000 GB) of logs per month, the estimated monthly cost would be around $27,475.
Tech Fit
Datadog is best suited for mid-to-large engineering teams with complex, multi-cloud environments that value integration breadth and centralized visibility. It works particularly well for organizations that want a single SaaS tool for infrastructure, logs, and APM without managing their own observability stack. However, because of its layered, host-based pricing model, Datadog is less cost-efficient at scale, making it a strong fit for enterprises with large budgets but a weaker fit for cost-sensitive teams handling terabytes of telemetry.
5. New Relic
Known for
New Relic is known as a full-stack observability platform with strong visualization capabilities and guided workflows. It pioneered application performance monitoring and has evolved into a unified observability solution covering APM, infrastructure, logs, and synthetics. Its standout feature is the service map and dependency visualization, which makes it easier for teams to understand complex application relationships.
.NET Monitoring Features
- Auto-instrumentation for ASP.NET Core, IIS, EF Core, and Windows Services
- Distributed tracing with logs-in-context for .NET applications
- Real-time service maps to visualize dependencies across services
- Custom instrumentation through APIs and SDKs
- Support for both .NET Framework and modern .NET Core/8+ apps
Key Features
- Application performance monitoring with distributed tracing
- Service maps for visualizing dependencies across microservices
- Logs-in-context for correlating logs with traces and metrics
- Real-time dashboards with customizable queries (NRQL)
- Error tracking and anomaly detection with alerts
- Infrastructure monitoring across hosts, containers, and Kubernetes
Pros
- Strong visualization and dependency mapping through interactive service maps
- Good support for hybrid estates running both legacy .NET Framework and .NET Core
- Logs-in-context simplifies debugging by linking application events directly to traces
- Guided workflows make onboarding and troubleshooting easier for new teams
- Robust community and documentation with years of enterprise adoption
Cons
- Per-user pricing model can get expensive for large engineering orgs.
- High costs at scale, especially for data ingestion and longer retention.
- Some advanced features have a steep learning curve.
Pricing
- Free Tier: 100GB/month ingested
- Pro plan: $0.40/GB ingested beyond the free 100GB limit
- Pro Plan: $349/user for full platform user
New Relic .NET Monitoring Pricing At Scale
A mid-sized SaaS company ingesting 45TB (~45,000 GB) of telemetry data per month and with 10 full users, the cost would come around ~$25,990/month.
Tech Fit
New Relic is best suited for teams that value strong visualization and guided workflows to simplify observability. It works particularly well in hybrid environments where organizations still run some legacy .NET Framework applications alongside modern .NET Core microservices. While its ingestion + per-user pricing model can get expensive at scale, New Relic provides a mature, easy-to-navigate platform for organizations that want detailed service dependency mapping and strong user experience monitoring.
6. Dynatrace
Known for
Dynatrace is known as an AI-powered observability platform that delivers automated root-cause detection through its Davis AI engine. It uses a single OneAgent to monitor applications, infrastructure, logs, and user experience end-to-end, making deployment simpler compared to multi-agent setups. Enterprises adopt Dynatrace for its ability to handle large-scale, hybrid, and multi-cloud environments with automation-driven insights.
.NET Monitoring Features
- Automatic instrumentation for ASP.NET Core, IIS, EF Core, and Windows Services
- Support for gRPC, ADO.NET, and database performance monitoring
- Deep visibility into thread-pool starvation and async/await execution
- Built-in Davis AI engine for automated root-cause analysis
- Strong Azure integration, including App Services and Functions
Key Features
- OneAgent deployment for full-stack coverage (apps, infra, logs, synthetics)
- Davis AI for automatic anomaly detection and root-cause analysis
- Distributed tracing across microservices and cloud-native workloads
- Continuous runtime application security monitoring (RASP)
- Infrastructure monitoring for VMs, containers, and Kubernetes clusters
Pros
- OneAgent simplifies deployment by covering infrastructure, applications, and services in a single package
- AI-powered Davis engine provides fast root-cause detection and remediation suggestions
- Broad enterprise readiness with compliance features and enterprise-grade security
- Excellent support for hybrid environments across on-premises, cloud, and Kubernetes
- Rich visualization dashboards and topology mapping for complex .NET systems
Cons
- Expensive especially when data volumes grow
- UI can feel overwhelming due to the depth of features and configuration options
Pricing
- Full-Stack Monitoring: $0.08 per hour for an 8 GiB host
- Infrastructure Monitoring: $0.04 per hour per host
- Synthetic Monitoring: $0.001 per request
- Logs: $0.20 per GiB
Dynatrace .NET Monitoring Pricing At Scale
A mid-sized SaaS company operating 125 APM hosts, 200 infrastructure hosts, ingesting approximately 10 TB (≈10,000 GB) of logs, generating 300,000 custom metrics, consuming 1.5 million container hours, and producing around 45,000 GB of observability data egress (charged by the cloud provider) would incur an estimated monthly cost of approximately $21,850.
Tech Fit
Dynatrace is best suited for large enterprises with complex, hybrid estates that need AI-driven automation to reduce manual troubleshooting. It’s particularly effective for organizations operating across cloud, on-premises, and Kubernetes environments that want to centralize observability in one tool. While its premium pricing model can be a barrier for smaller teams, Dynatrace offers enterprise-grade automation, scalability, and compliance features, making it a strong fit for Fortune 500-level environments.
7. Azure Monitor
Known for
Azure Application Insights, part of Azure Monitor, is known as Microsoft’s native observability solution for Azure-hosted applications. It provides deep integration with App Services, Functions, Azure SQL, and Kubernetes Service (AKS), making it the default choice for teams building on the Azure ecosystem. Its biggest strength lies in tight Visual Studio and Azure DevOps integration, enabling developers to instrument and monitor .NET workloads quickly with minimal setup.
.NET Monitoring Features
- Out-of-the-box instrumentation for ASP.NET Core and .NET Framework apps
- Live Metrics Stream for real-time telemetry and performance insights
- Automatic collection of dependency calls (SQL, HTTP, Azure Service Bus)
- Deep integration with Azure App Services, Functions, and Kubernetes
- Support for the Azure Monitor OpenTelemetry Distro for vendor-neutral pipelines
Key Features
- Out-of-the-box monitoring for ASP.NET Core and .NET Framework apps
- Live Metrics Stream for real-time telemetry and quick debugging
- Automatic dependency tracking for SQL, HTTP, and Azure services
- Preconfigured dashboards integrated with the Azure portal
- Distributed tracing and end-to-end transaction diagnostics
Pros
- Native integration with Azure ecosystem for seamless developer experience
- Preconfigured dashboards for .NET workloads hosted in Azure
- Strong support for App Services, Functions, and SQL Database monitoring
- Easy onboarding for teams already using Visual Studio and Azure DevOps
- Built-in live telemetry stream helps in debugging production issues quickly
Cons
- Steep learning curve
- Debugging workflows can be complex
- Alerting can become noisy due to complex setups
Pricing
- Auxiliary Logs: $0.05 per GB
- Log Processing: $0.10 per GB
- Basic Logs: $0.50 per GB
- Analytics Logs (default tier): $2.30 per GB (with discounts at higher volumes)
Azure Monitor .NET Monitoring Pricing At Scale
For a midsized SaaS company ingesting 10 TB of telemetry data per month, costs vary depending on how data is allocated across Azure Monitor’s tiers. Suppose 3 TB is ingested into Analytics Logs at $2.30/GB ($6,900/month), 2 TB into Basic Logs at $0.50/GB ($1,000/month), 3 TB into Log Processing at $0.10/GB ($300/month), and the remaining 2 TB into Auxiliary Logs at $0.05/GB ($100/month). Combined, this totals roughly $6,150/month.
Tech Fit
Azure Application Insights is best suited for .NET teams running workloads natively on Azure that want seamless integration into their existing cloud and developer workflow. It provides strong coverage for Azure-first shops where monitoring, billing, and security are already tied into Microsoft’s ecosystem. However, its high ingestion pricing and limited portability outside Azure make it less attractive for multi-cloud or hybrid organizations that need flexibility.
8. Elastic Observability
Known for
Elastic APM is part of the Elastic Observability suite built on the ELK stack (Elasticsearch, Logstash, Kibana). It’s known for providing a flexible, open-source solution that combines logs, metrics, and traces into one searchable platform. Engineering teams that already use Elasticsearch for logging often adopt Elastic APM to extend visibility into application performance without adding a separate vendor tool.
.NET Monitoring Features
- Auto-instrumentation for .NET Framework, .NET Core, and .NET 5+ via CLR profiler
- Out-of-the-box support for ASP.NET Core, ADO.NET, EF Core, and HttpClient
- Database visibility for SQL Server, PostgreSQL, MySQL, Oracle, and SQLite
- Distributed tracing across .NET microservices with Elastic agent
- NuGet packages (Elastic.Apm.AspNetCore, Elastic.Apm.EntityFrameworkCore, etc.) for custom instrumentation
- Kibana dashboards for .NET application performance and dependencies
Key Features
- Auto-instrumentation for .NET, Java, Python, and other major runtimes
- Distributed tracing across microservices with Elastic agents or OTel SDKs
- Built-in support for ADO.NET, EF Core, HttpClient, and ASP.NET Core
- Dashboards in Kibana for performance metrics and anomaly detection
Pros
- Open-source and free to start, with strong developer community support
- Unified stack for logs, metrics, and traces in a single platform
- Highly flexible customization via Kibana dashboards and queries
- Good out-of-the-box coverage for common .NET frameworks and libraries
- Self-hosted option gives full control over data and infrastructure
Cons
- Elasticsearch scaling complexity.
- Storage and infra costs grow rapidly.
- Requires in-house expertise to tune.
Pricing
- Standard – $99/month: Distributed Search AI Platform across AWS, Azure, GCP
- Gold – $114/month: includes everything in Standard + reporting, third-party alerting, Watcher, and multi-stack monitoring
- Platinum – $131/month: Includes everything in Gold and adds advanced Elastic security features
Elastic Observability .NET Monitoring Pricing At Scale
For a mid-sized SaaS company with 125 APM hosts, 20TB of events ingestion per month, and 45,000GB of observability data out(charged by cloud provider), the cost would be around $17,435.
Tech Fit
Elastic APM is best suited for teams already invested in the ELK stack who want to extend observability with APM while keeping everything in a single platform. It offers a cost-effective and open-source entry point, with the flexibility to self-host or scale on Elastic Cloud. However, it requires operational effort to tune and scale the stack, making it a better fit for engineering-driven organizations that prefer open-source control over managed SaaS simplicity.
Conclusion
Choosing the right .NET APM tool is no longer optional—it’s essential for keeping modern ASP.NET Core, EF Core, and gRPC-based applications healthy and cost-efficient. As .NET workloads scale across Azure, Kubernetes, and hybrid infrastructures, blind spots like slow queries, thread-pool starvation, or runaway logging can directly impact performance and user experience.
The tools we reviewed each bring something valuable: Datadog and Dynatrace offer broad enterprise ecosystems, New Relic and AppDynamics excel at visualization and business correlation, while Elastic and Azure Application Insights integrate tightly with existing stacks. Sentry and SigNoz provide lighter, developer-friendly or open-source routes.
But for most .NET teams, CubeAPM stands out. With OpenTelemetry-native instrumentation, smart sampling, Azure readiness, and flat-rate pricing, it delivers the depth enterprises need without the unpredictable bills of legacy APMs. For organizations that want cost-efficient, future-proof .NET observability, CubeAPM is the best fit.
Disclaimer: The information in this article reflects the latest details available at the time of publication and may change as technologies and products evolve.
FAQs
1. What is .NET application performance monitoring (APM)?
.NET APM is the practice of tracking the performance, health, and reliability of applications built on the .NET framework. It covers metrics like response times, database query latency, memory usage, error rates, and distributed traces across services. The goal is to quickly identify and resolve performance bottlenecks before they affect users.
2. Why do companies need .NET APM tools?
Companies rely on .NET APM tools to detect hidden issues such as memory leaks, slow queries, or thread-pool starvation. These tools provide deep insights into async/await execution, database calls, and external dependencies, helping teams optimize performance, reduce downtime, and control infrastructure costs.
3. Which are the best .NET APM tools in 2025?
Some of the top .NET APM tools include CubeAPM. CubeAPM stands out with OpenTelemetry-native instrumentation, cost-efficient pricing, and enterprise-ready deployment options.
4. How much does .NET application monitoring cost?
Pricing varies widely. SaaS vendors like Datadog and Dynatrace often charge per host plus data ingestion, which can cost $8,000–$10,000+ per month at 10 TB of data. In contrast, CubeAPM offers flat pricing at $0.15/GB, keeping costs around $1,500/month for the same scale. Open-source tools like Elastic and SigNoz can also be more affordable but require more setup effort.
5. What is the best .NET APM tool for Azure environments?
For teams heavily invested in Microsoft Azure, Azure Application Insights integrates seamlessly with App Services, Functions, and SQL Databases. However, CubeAPM is a strong alternative for Azure shops that want OpenTelemetry-first pipelines, lower ingestion costs, and more control over data residency.


