Go (Golang) has become a go-to language for high-performance systems — powering Kubernetes, Docker, and modern API backends. Its built-in concurrency and lightweight goroutines make it fast, but also harder to observe. A single blocked channel, runaway goroutine, or inefficient GC cycle can quietly throttle performance across services.
Effective Go monitoring means tracking goroutines, memory allocation, GC pauses, and latency across microservices in real time. But most APM tools struggle with Go’s concurrency model or add high overhead, especially at scale.
CubeAPM solves this with native Go instrumentation, full OpenTelemetry compatibility, and MELT visibility (metrics, events, logs, traces) designed for Go workloads. It captures runtime metrics like goroutine counts, heap usage, and GC stats with minimal impact, then correlates them with traces to show where latency originates.
In this guide, we’ll review the best Go (Golang) monitoring tools, compare their Go-specific features, and break down real pricing examples to see how each scales in production.
Best Go(Golang) Monitoring Tools
- CubeAPM
- Datadog
- New Relic
- Dynatrace
- Grafana Cloud
- AppSignal
- Sumo Logic
- Uptrace
What Is Go (Golang) Monitoring
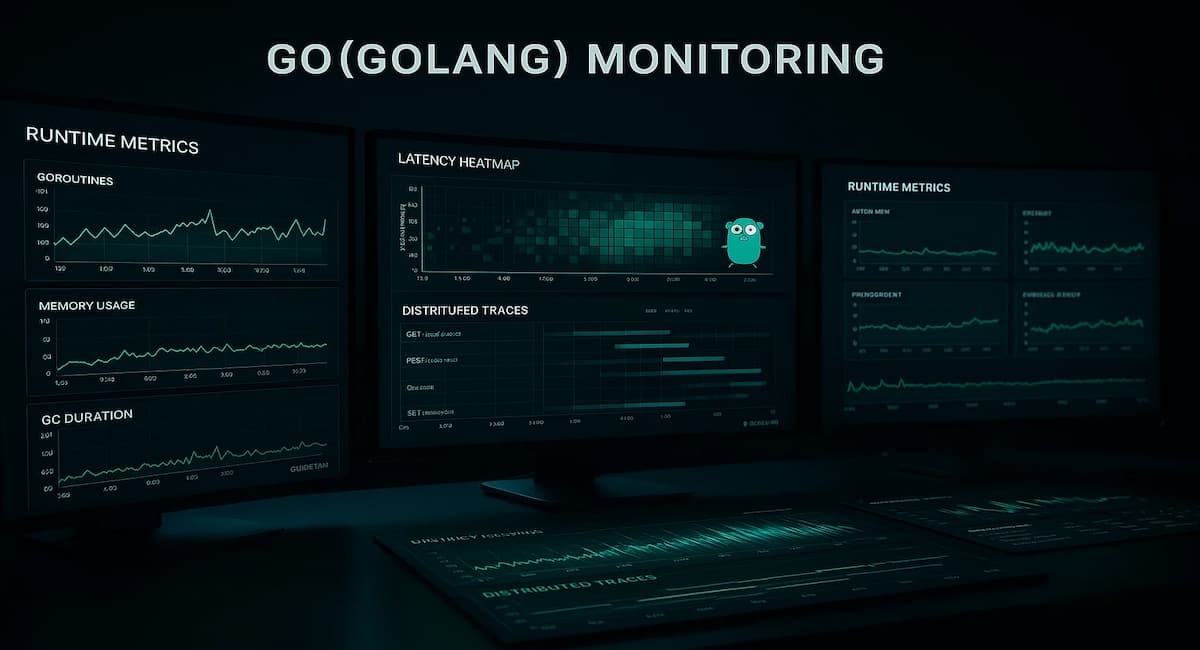
Go (Golang) monitoring is the practice of collecting, analyzing, and visualizing performance data from Go applications — including metrics, logs, traces, and runtime statistics — to detect bottlenecks and maintain application health.
Unlike traditional languages, Go runs thousands of lightweight goroutines within a single process. This makes concurrency efficient, but it also complicates visibility. Effective Go monitoring must therefore track:
- Goroutine activity: Spikes, leaks, or blocked routines.
- Garbage collection (GC) metrics: Pause durations, memory allocations, and heap growth.
- Latency and throughput: Function, request, and service levels.
- CPU and memory profiles: Via OpenTelemetry instrumentation.
Modern observability tools achieve this by instrumenting Go code through OpenTelemetry SDKs, auto-instrumentation agents, or native Go exporters. The collected telemetry is then sent to a backend like CubeAPM, Datadog, or SigNoz for visualization and alerting.
The goal isn’t just uptime — it’s understanding why a Go service slows down under load. Proper monitoring connects low-level runtime behavior (GC cycles, goroutines) with higher-level metrics (request latency, error rate, queue time) to give developers a complete picture of system performance.
Example: How CubeAPM Handles Go (Golang) Monitoring
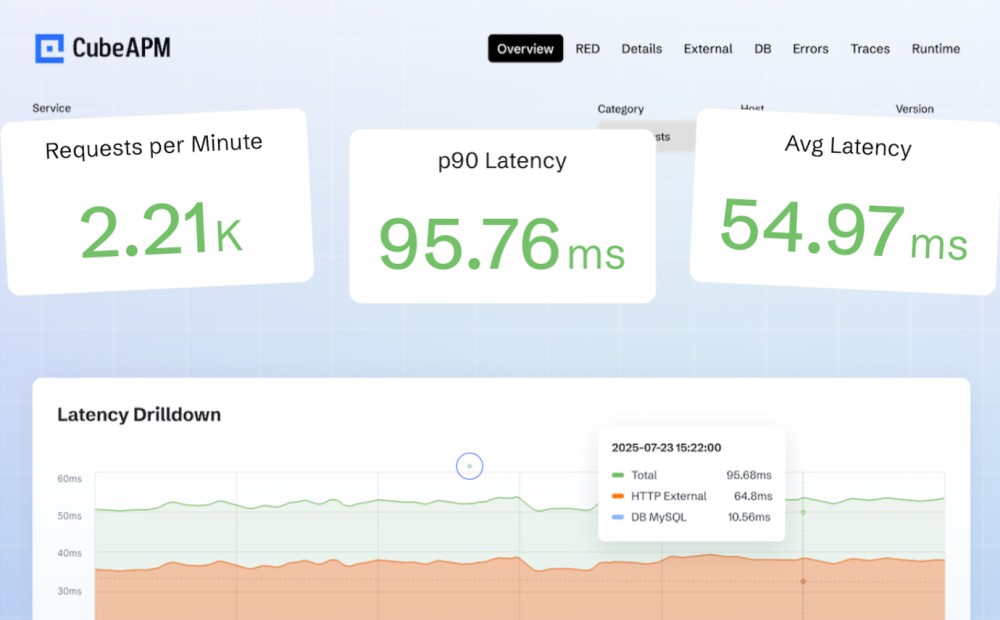
CubeAPM is built to give Go developers deep runtime visibility without the performance penalty common in traditional APM agents. Its Go monitoring is powered by native OpenTelemetry instrumentation, allowing developers to track every goroutine, memory allocation, and API trace in real time.
CubeAPM automatically captures critical Go runtime metrics such as:
- Goroutines: number of active, waiting, or blocked routines.
- Memory & GC: heap usage, GC pause time, and allocation rates.
- CPU & latency: per-request execution time, CPU throttling, and I/O wait.
- Error traces: distributed trace correlation across Go services and upstream dependencies.
The platform uses smart sampling to retain high-value traces and drop repetitive spans, ensuring low overhead even when monitoring thousands of concurrent Go routines. This makes it ideal for Go-based microservices and event-driven architectures.
Developers can view Go-specific dashboards — including goroutine growth, GC pause histograms, and latency by handler — under a unified MELT view (Metrics, Events, Logs, Traces). All telemetry is collected using standard OTLP endpoints, meaning no proprietary agents or code rewrites are required.
With flat-rate pricing ($0.15/GB) and BYOC/self-hosting support, CubeAPM keeps Go observability predictable and compliant for both SaaS and on-premise environments. Whether you’re profiling APIs, debugging GC issues, or analyzing trace waterfalls, CubeAPM provides a complete, low-latency observability layer purpose-built for Go workloads.
Why Teams Choose Different Golang Monitoring Tools
1. OpenTelemetry-Native vs. Vendor Agents
Most Go developers now prefer OpenTelemetry (OTel) because it offers a vendor-neutral way to instrument code. With OTel’s Go SDK and runtime metrics package, teams can export telemetry to any backend without rewriting instrumentation later. In contrast, vendor-specific agents simplify setup but often add lock-in and higher overhead.
2. Depth of Go Runtime Visibility
True Go observability means tracking goroutines, garbage-collection pauses, heap allocations, and scheduler behavior in real time. Tools differ in how much runtime detail they expose. The best Go monitoring solutions correlate these low-level runtime metrics with application traces, helping teams detect leaks, contention, or latency spikes faster.
3. Cost Model Under High Concurrency
Go workloads can spawn thousands of concurrent requests per second, generating high telemetry volume. Tools that bill per host or feature (e.g., separate charges for infrastructure, logs, and traces) can scale costs unpredictably. Teams therefore evaluate ingestion-based or flat-rate pricing to maintain visibility without runaway bills.
4. Kubernetes-First Ecosystem Fit
Most Go services today run inside Kubernetes clusters. That means the monitoring platform must understand Kubernetes constructs — Pods, Jobs, Services, and Nodes — and integrate with Prometheus exporters or Grafana dashboards. Tools with built-in Kubernetes discovery simplify monitoring microservice deployments and autoscaling environments.
5. Performance Overhead and Sampling Strategy
Go’s efficiency can be undermined by heavy agents that consume CPU or memory. Lightweight collectors with adaptive or tail-based sampling maintain performance while preserving critical traces. Sampling also controls telemetry volume and cost, making it essential for production Go systems handling large workloads.
6. Deployment Flexibility and Data Control
Compliance-driven organizations often prefer to keep telemetry in-house for GDPR, HIPAA, or SOC 2 requirements. Self-hosted or Bring-Your-Own-Cloud (BYOC) deployment options give them full data control. SaaS tools remain attractive for teams prioritizing ease of use and minimal operational overhead.
7. Maturity, Support, and Integrations
Enterprise teams value strong SLAs, guided onboarding, and integration breadth across databases, message queues, and CI/CD tools. Mature vendors offer built-in alerts, anomaly detection, and advanced dashboards, while newer or open-source tools may require more manual configuration but provide greater transparency and cost control.
Top 8 Golang Monitoring Tools
1. CubeAPM
Known for
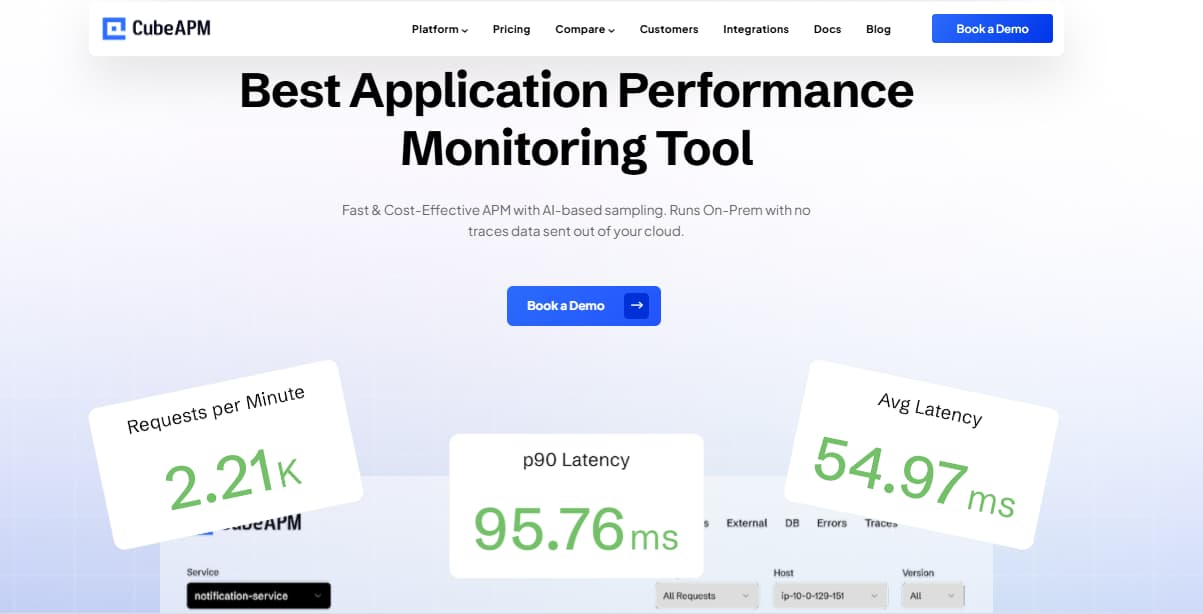
CubeAPM is built for modern Go (Golang) observability, giving developers full visibility into goroutines, GC performance, and service latency with zero instrumentation friction. Unlike generic APMs, CubeAPM is OpenTelemetry-native, capturing Go runtime metrics directly from OTel exporters without installing heavy proprietary agents. It’s designed for Go-first microservice teams, combining real-time runtime insights, distributed tracing, and log correlation under one unified MELT dashboard.
Go (Golang) Monitoring Features
- Native OpenTelemetry integration for Go SDK and runtime metrics.
- Real-time visibility into goroutine growth, memory allocation, and GC pauses.
- Distributed tracing across Go microservices with minimal overhead.
- Built-in correlation between logs, traces, and runtime metrics.
- GC and heap dashboards optimized for Go workloads.
Key Features
- Smart sampling for trace reduction without losing anomaly visibility.
- Unified dashboards for metrics, traces, and logs.
- Self-host or BYOC options for full data control.
- HIPAA/GDPR-ready deployment and compliance features.
- Custom dashboards and PromQL-compatible queries.
Pros
- Lightweight instrumentation with minimal overhead on Go runtimes.
- Flat, transparent pricing with no per-host or feature-based costs.
- Strong integration with OpenTelemetry pipelines.
- Self-hosting flexibility for compliance-driven teams.
Cons
- Not suited for teams looking for off-prem solutions
- Strictly an observability platform and does not support cloud security management
Pricing
CubeAPM charges a flat $0.15 per GB ingested, covering logs, traces, and metrics
CubeAPM Go (Golang) Monitoring Pricing at Scale
*All pricing comparisons are calculated using standardized Small/Medium/Large team profiles defined in our internal benchmarking sheet, based on fixed log, metrics, trace, and retention assumptions. Actual pricing may vary by usage, region, and plan structure. Please confirm current pricing with each vendor.
For a mid-sized SaaS company ingesting 45TB(~45,000) total monthly data ingestion and 45,000TB of observability data outcharged by the cloud provider, the total cost will be about ~$7200/month.
Tech Fit
CubeAPM is ideal for Go-based systems running on Kubernetes, microservices, and event-driven architectures. It fits teams that prefer OpenTelemetry pipelines, want to self-host observability, or require strict data governance. Its Go runtime dashboards and low ingestion overhead make it a strong choice for organizations scaling Go services in production.
2. Datadog
Known for
Datadog is known for its comprehensive observability suite that combines APM, logs, infrastructure, RUM, and security monitoring under one platform. It offers strong Go (Golang) support through auto-instrumentation libraries and its native Go tracer. Datadog’s ecosystem is enterprise-grade, enabling teams to monitor distributed Go microservices alongside their Kubernetes clusters, databases, and APIs in a single unified interface.
Go (Golang) Monitoring Features
- Automatic instrumentation for popular Go frameworks, HTTP handlers, and SQL drivers.
- Real-time visibility into goroutine counts, heap memory, and GC pauses using Datadog’s Go runtime integration.
- Distributed tracing for Go-based microservices with context propagation.
- Custom instrumentation using the ddtrace library for fine-grained function-level spans.
- Go runtime dashboards visualizing latency, throughput, and memory profiles.
Key Features
- 900+ built-in integrations for cloud, containers, and infrastructure.
- Unified analytics for logs, metrics, and traces in one platform.
- Continuous Profiler for CPU, heap, and goroutine sampling.
- AI-based Watchdog alerts for anomaly detection and pattern learning.
- Synthetic monitoring and real user monitoring (RUM) modules.
Pros
- Mature, enterprise-ready platform with vast integration coverage.
- Excellent visibility across hybrid and multi-cloud architectures.
- Feature-rich dashboards and automated correlation between APM and infra data.
Cons
- Complex modular pricing can lead to unpredictable costs.
- Pricing grows steeply with an increase in data volume
- Overwhelming UI for new users
Pricing
- APM Enterprise: $40 per host/month
- Log Management (Ingest): $0.10 per GB/month
- Error Tracking: $25 per 50,000 errors/month
- Infrastructure Monitoring: $23 per host/month
Datadog Go (Golang) Monitoring Pricing at Scale
For a mid-sized SaaS company operating 125 APM hosts, 40 profiled hosts, 100 profiled container hosts, 200 infrastructure hosts, 1.5 million container hours, 300,000 custom metrics, 500 million indexed spans, and 3,500 indexed logs, while ingesting approximately 10 TB (≈10,000 GB) of logs per month, the estimated monthly cost would be around $27,475.
Tech Fit
Datadog fits large-scale Go infrastructures that need all-in-one visibility across Kubernetes, cloud, and on-prem environments. It’s particularly suited to enterprise DevOps teams that rely on extensive integrations and AI-driven insights.
3. New Relic
Known for
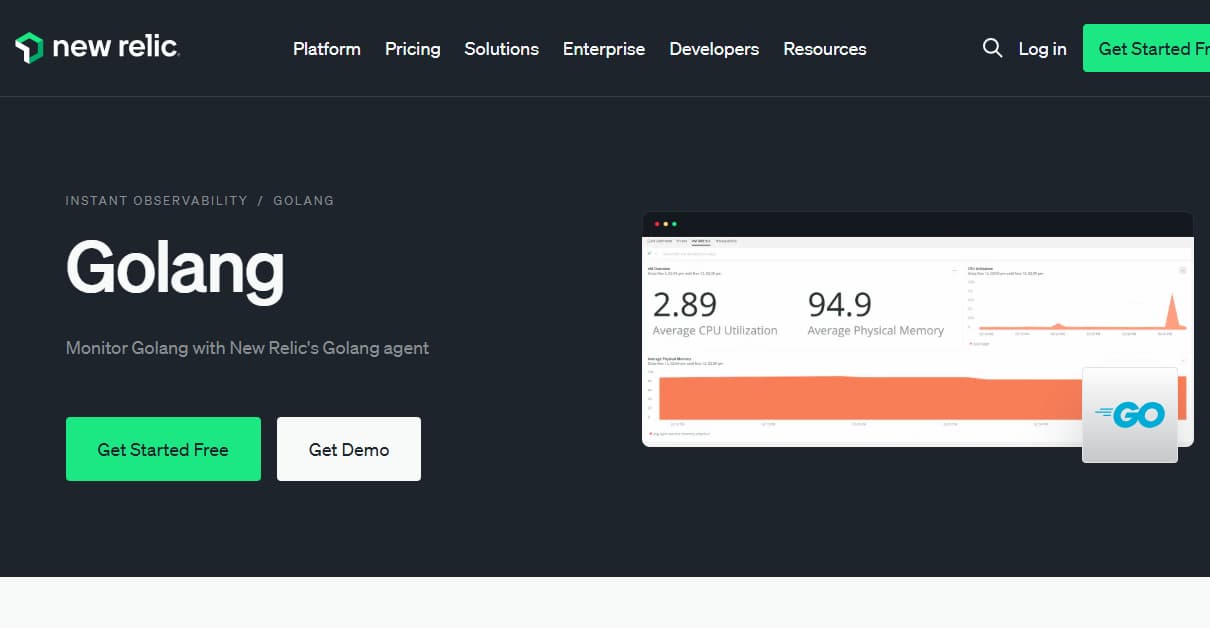
New Relic is known for its unified, usage-based observability model that merges logs, metrics, and traces under one data pipeline. Unlike traditional host-based APMs, New Relic simplifies monitoring through a single per-GB ingestion model. For Go developers, it provides first-class OpenTelemetry integration and a native Go agent that instruments functions, HTTP handlers, and background tasks with minimal setup.
Go (Golang) Monitoring Features
- Native Go agent with auto-instrumentation for HTTP, gRPC, SQL, and message queues.
- Visibility into goroutine activity, memory allocation, and garbage collection metrics.
- Integration with OpenTelemetry Go SDK for vendor-neutral telemetry export.
- Error tracking and distributed tracing across Go microservices.
- Real-time dashboards for latency, throughput, and GC performance.
Key Features
- Unified ingest model for all telemetry types (metrics, logs, traces, events).
- OpenTelemetry support for vendor-agnostic instrumentation.
- Flexible query language (NRQL) for building custom dashboards.
- Built-in anomaly detection and service dependency visualization.
- Generous free tier — up to 100 GB of free data ingest per month.
Pros
- Transparent pricing — pay only for data ingested, not per host or feature.
- Smooth onboarding with minimal setup for Go services.
- Unified observability view without switching between modules.
- Ideal for teams already using OTel for Go instrumentation.
Cons
- Ingest pricing can climb quickly at high data volumes.
- Costs rise steeply with log-heavy or high-traffic workloads
Pricing
- Free tier: 100GB/month of data ingested
- Data ingest: $0.40/GB after the 100 GB free tier
- Core users: $49 per user/month
New Relic Go (Golang) Monitoring Pricing at Scale
A mid-sized SaaS company ingesting 45TB (~45,000 GB) of telemetry data per month and with 10 full users, the cost would come around ~$25,990/month.
Tech Fit
New Relic fits mid-to-large Go engineering teams seeking an easy, cloud-hosted solution with transparent per-GB billing. It’s ideal for organizations using OpenTelemetry Go SDKs that prefer SaaS simplicity over managing their own stack. Its single-pipeline design simplifies Go service monitoring but can grow costly as telemetry volume rises.
4. Dynatrace
Known for
Dynatrace is known for its AI-driven observability and automation platform that unifies APM, infrastructure, logs, and digital experience monitoring under one intelligent engine. It excels in large, distributed Go environments where performance tuning and automatic root-cause analysis are critical. Dynatrace’s OneAgent automatically instruments Go applications, providing deep insight into runtime behavior, dependencies, and anomalies without manual configuration.
Go (Golang) Monitoring Features
- Automatic detection of Go services and distributed trace collection using OneAgent.
- Real-time metrics for goroutines, garbage-collection activity, heap usage, and response latency.
- Native OpenTelemetry integration for custom Go instrumentation.
- AI-powered dependency mapping that visualizes Go services within full-stack topology.
- Built-in anomaly detection for performance regressions in Go APIs.
Key Features
- Davis AI engine for automatic problem detection and root-cause correlation.
- Unified observability for infra, apps, logs, and user experience.
- Continuous profiling of Go services to identify CPU and memory bottlenecks.
- Kubernetes and container awareness for dynamic Go microservices.
- Centralized dashboards and predictive alerting powered by machine learning.
Pros
- Industry-leading automation with minimal manual setup.
- Deep correlation between traces, metrics, logs, and infrastructure layers.
- Excellent enterprise support and scalability for hybrid environments.
Cons
- High cost and complex licensing; pricing is rarely transparent
- Steep learning curve with advanced configuration needs
Pricing
- Infrastructure Monitoring: $29/mo/host
- Full-Stack Monitoring: $58/mo/8 GiB host
Dynatrace Go (Golang) Monitoring Pricing at Scale
A midsized SaaS company operating 125 APM hosts, 200 infra hosts, 10TB(~10,000 GB) of ingested logs, 300,000 custom metrics, 1,500,000 container hours, and 45,000GB of observability data out(charged by cloud provider), the cost would come around ~$21,850/month.
Tech Fit
Dynatrace suits large enterprises running complex Go microservice ecosystems that demand automated anomaly detection, cross-layer correlation, and enterprise-grade SLAs. It’s a strong fit for regulated or mission-critical Go workloads running across hybrid, multi-cloud, or Kubernetes environments.
5. Grafana Cloud
Known for
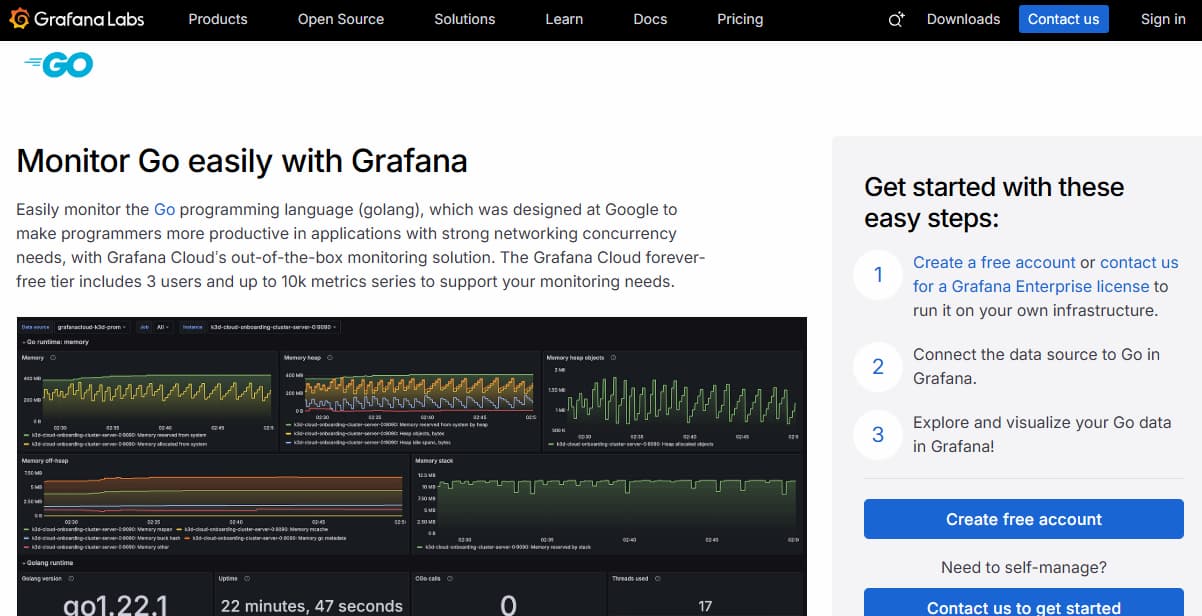
Grafana Cloud is known for its modular, open observability stack built around three key components — Loki for logs, Tempo for traces, and Mimir for metrics. It’s especially popular among Go developers because all components integrate seamlessly with OpenTelemetry Go exporters and can be self-hosted or used as a managed SaaS service. Grafana’s flexibility makes it ideal for teams that want full control over their Go observability pipeline.
Go (Golang) Monitoring Features
- Native support for OpenTelemetry Go SDKs to ingest metrics, logs, and traces.
- Real-time Go runtime metrics such as goroutines, heap allocation, and GC duration.
- Distributed tracing through Tempo, which visualizes Go spans and service latency.
- Loki centralizes logs with Go-specific labels (service, version, environment).
- Configurable dashboards displaying runtime behavior, GC pressure, and API latency.
Key Features
- Unified observability powered by open components (Prometheus-compatible metrics, Tempo traces, Loki logs).
- Deep customization with Grafana dashboards and alert rules.
- Seamless integration with Kubernetes, Docker, and CI/CD pipelines.
- Compatible with any OpenTelemetry-instrumented Go service.
- Flexible deployment: fully managed Grafana Cloud or self-hosted on any infrastructure.
Pros
- Fully open-source and standards-based.
- No vendor lock-in — data portability across clouds.
- Highly customizable dashboards tailored for Go applications.
- Can scale horizontally when self-hosted.
Cons
- Steeper learning curve for teams unfamiliar with Prometheus/Grafana stack
- Requires configuration work to set up alerts and dashboards optimally
Pricing
- Logs ingested: $0.50/GB
- Traces ingested: $0.50/GB
- Application observability (APM): $0.04/host-hour (Pro tier)
- Kubernetes monitoring: $0.015/host-hour + $0.001/container-hour
Grafana Cloud Go (Golang) Monitoring Pricing at Scale
For a mid-sized company operating 125 APM hosts, 200 infra hosts, 10TB(~10,000 GB) of ingested logs, and 45,000GB of observability data out(charged by cloud provider), the cost would come around ~$11,875/month.
Tech Fit
Grafana Cloud fits Go teams that value flexibility and open standards. It’s best for organizations that already use Prometheus or OpenTelemetry Go SDKs and want to visualize data without being tied to a proprietary APM. It suits mid-sized to enterprise Go deployments where customization and data ownership are priorities.
6. AppSignal
Known for
AppSignal is known for its lightweight, developer-first performance monitoring built around simplicity, clean dashboards, and minimal setup. It provides native Go (Golang) support with automatic tracing, custom instrumentation, and anomaly detection. Unlike heavier enterprise tools, AppSignal focuses on actionable insights — not dashboards overload — making it popular among Go teams looking for an intuitive APM without enterprise complexity.
Go (Golang) Monitoring Features
- Automatic instrumentation for HTTP servers, SQL drivers, and background tasks.
- Native Go agent to collect request timings, memory usage, and error traces.
- Distributed tracing support for Go microservices with OpenTelemetry compatibility.
- Real-time visibility into goroutines, GC activity, and request throughput.
- Error tracking with detailed stack traces and request context.
Key Features
- Lightweight APM with minimal runtime overhead.
- Unified dashboard for performance metrics, errors, and alerts.
- Custom instrumentation via middleware hooks and trace spans.
- Alerting with thresholds or anomaly detection rules.
- Integrated profiling for CPU, memory, and query performance.
Pros
- Extremely easy to set up — install and start monitoring within minutes.
- Low CPU and memory footprint, suitable for Go microservices.
- Clean, developer-centric interface with strong alerting.
- Affordable for small and mid-sized Go teams.
Cons
- Steep learning curve for new users
- Costs can scale quickly as usage grows
Pricing
- APM: $23.25/month (250K requests/month)
- Logging (add-on): Paid option, additional cost per GB beyond 1 GB/month free tier
- Long-term log storage: $89/month
- HIPAA compliance: $89/month (optional)
- Enterprise SAML SSO: $539/month (optional)
AppSignal Go (Golang) Monitoring Pricing at Scale
For a Go application ingesting 10,000 GB/month of telemetry and handling millions of requests daily, the total monthly cost comes to approximately $9,023/month (~45,000 GB × $0.20 log storage + $23.25 APM base + $89 long-term retention + $89 HIPAA compliance). This estimate assumes paid logging beyond the free 1 GB tier, with both long-term storage and compliance features enabled.
Tech Fit
AppSignal fits Go development teams that prioritize simplicity, developer usability, and low overhead over enterprise-level automation. It’s ideal for SaaS startups and API-driven Go backends that want clear performance insights without managing complex configurations. For organizations that prefer lightweight, managed observability over multi-module APM suites, AppSignal offers a focused and cost-efficient solution.
7. Sumo Logic
Known for
Sumo Logic is known for its cloud-native observability and security analytics platform that unifies logs, metrics, and traces within a single SaaS environment. It’s a popular choice among enterprise DevOps teams running Go (Golang) applications due to its real-time analytics, anomaly detection, and OpenTelemetry compatibility. Sumo Logic focuses on continuous intelligence — using machine learning to surface performance issues across Go microservices and infrastructure in real time.
Go (Golang) Monitoring Features
- Full OpenTelemetry Go SDK integration for traces, logs, and runtime metrics.
- Real-time visualization of goroutine usage, heap size, and GC performance.
- Automatic correlation between Go spans, logs, and metrics for faster debugging.
- Prebuilt Go service dashboards with latency and throughput tracking.
- Centralized alerting and anomaly detection for Go workloads using ML models.
Key Features
- Unified MELT observability (Metrics, Events, Logs, Traces) with security analytics.
- Continuous anomaly detection for Go microservices using machine learning.
- Native integrations with Kubernetes, AWS, and CI/CD pipelines.
- Centralized dashboards for Go runtime metrics, container telemetry, and traces.
- Flexible credit-based “Flex” pricing that adjusts for data ingest, storage, and scanning.
Pros
- Easy to integrate with OpenTelemetry-instrumented Go services.
- Combines observability and security under one SaaS platform.
- Strong real-time dashboards and AI-driven alerting.
- SOC 2, GDPR, and HIPAA-compliant for enterprise workloads.
Cons
- Flex pricing adds complexity to cost estimation.
- Higher data retention increases monthly spend.
Pricing
- Free tier + enterprise plans. Pricing is based on data ingest and features enabled.
- Logs: $2.50/GB (standard ingest)
- Metrics: available via add-ons
- Traces: supported but priced as part of advanced observability plans
Sumo Logic Go (Golang) Monitoring Pricing at Scale
For a midsized SaaS ingesting 45TB(~45,000GB) of logs per month and 45,000GB of observability data out(charged by cloud provider), the cost would come around ~$16,065/month.
Tech Fit
Sumo Logic fits mid to large Go engineering teams that prioritize cloud-native observability, real-time analytics, and integrated security intelligence. It’s best for organizations running Kubernetes-based Go workloads or those already invested in SaaS infrastructure who want rapid deployment without managing telemetry backends. Teams seeking predictable costs or self-hosting flexibility may prefer OpenTelemetry-native solutions like CubeAPM or Grafana Cloud.
8. Uptrace

Known for
Uptrace is known for its lightweight, OpenTelemetry-native tracing and metrics platform designed to give developers fast, actionable insights into distributed systems. It’s built entirely on open standards, making it easy for Go developers to instrument applications without complex setup or agent overhead. Uptrace focuses on high-volume trace ingestion and correlation rather than large, modular APM billing — a practical fit for Go workloads with massive concurrency.
Go (Golang) Monitoring Features
- Deep OpenTelemetry Go SDK integration with automatic trace export.
- Tracks key Go runtime metrics: goroutines, heap size, GC time, and CPU usage.
- Visualizes Go spans, functions, and latency waterfalls in real time.
- Built-in service maps showing Go service dependencies and request latency.
- Error and exception tracking with context propagation through traces.
Key Features
- Unified observability for metrics, traces, and logs built on Postgres + ClickHouse.
- Pre-built dashboards for Go, PostgreSQL, Redis, and HTTP services.
- Efficient trace search and grouping by service, endpoint, or error type.
- Sampling and retention controls to manage telemetry volume.
- Self-hosted or cloud-hosted deployment with full data ownership.
Pros
- Simple setup — add OTel Go exporters and start streaming data in minutes.
- Extremely fast query performance even on large data sets.
- Predictable cost and minimal operational overhead.
- 100% OpenTelemetry compliance — easy migration from any existing setup.
Cons
- Operational overhead, especially when self-hosted
- High operational overhead to manage ClickHouse, OTEL Collector, and configs.
Pricing
Traces & Logs
- $200/month → 3 TB at $0.07 per GB
- $500/month → 8 TB at $0.06 per GB
- $1,000/month → 20 TB at $0.05 per GB
- $2,000/month → 50 TB at $0.04 per GB
- $3,000/month → 100 TB at $0.03 per GB
Uptrace Go (Golang) Monitoring Pricing at Scale
For a Go application ingesting ~45,000 GB/month of traces and logs under the $1,000 plan ($0.05/GB), and maintaining around 3 million active time series under the $2,000 metrics plan ($0.60 per 1k series), the total monthly cost comes to approximately $8,500/month (45,000 GB × $0.05 + 3,000,000 / 1,000 × $0.60).
This configuration reflects a large-scale Go deployment using Uptrace Cloud, combining high trace volume with detailed metrics granularity. Actual pricing may vary slightly with data retention and sampling ratios.
Tech Fit
Uptrace fits Go developers and DevOps teams building distributed microservices that need fast tracing and root-cause visibility without the cost of full enterprise APM suites. It’s ideal for OpenTelemetry-first environments, small to mid-sized SaaS platforms, and API-driven Go backends that want performance transparency and control over data retention.
Conclusion
Monitoring Go (Golang) applications requires more than basic uptime checks — it demands deep visibility into goroutines, garbage collection, and microservice latency. As Go continues powering the world’s fastest distributed systems, observability has become a core part of maintaining performance and reliability at scale.
While tools like Datadog, Dynatrace, New Relic, and Elastic offer rich enterprise features, they can become complex or costly when telemetry volume grows. OpenTelemetry-native platforms such as Uptrace, Grafana, and Lightstep give flexibility, but they often require configuration effort or lack unified cost control.
CubeAPM delivers a balanced approach — full MELT visibility (metrics, events, logs, traces), native Go instrumentation, and smart sampling that keeps costs predictable even at 10 TB+ per month. Its seamless OpenTelemetry support, and Go-specific dashboards make it the most practical choice for teams running Go microservices at production scale.
Disclaimer: The information in this article reflects the latest details available at the time of publication and may change as technologies and products evolve.
FAQs
1. What is the best way to monitor Go (Golang) applications?
The best approach is to use OpenTelemetry instrumentation for collecting metrics, logs, and traces directly from Go services. Pairing it with an observability backend such as CubeAPM, Grafana, or New Relic provides full MELT visibility and real-time performance analysis.
2. Which metrics are most important to monitor in Go?
Key Go runtime metrics include goroutine count, heap allocations, GC pause duration, latency per request, and error rates. Monitoring these helps identify concurrency bottlenecks and inefficient memory use before they impact production.
3. Are OpenTelemetry SDKs reliable for Go monitoring?
Yes. The OpenTelemetry Go SDK is now production-grade and supports all core signal types (metrics, traces, logs). Platforms like CubeAPM use it natively, ensuring zero vendor lock-in and low overhead while collecting high-fidelity telemetry from Go applications.
4. How can I reduce observability costs for Go microservices?
Adopt smart sampling, limit log verbosity, and use flat-rate ingestion pricing where possible. CubeAPM, for instance, charges a transparent $0.15/GB, avoiding the per-host or per-feature costs typical of legacy APMs.
5. Can I self-host Go monitoring tools?
Yes. Tools such as CubeAPM (BYOC), Grafana/Tempo/Loki, and Elastic Observability offer self-hosting options for teams needing compliance, privacy, or data sovereignty. This approach gives full control over ingestion, retention, and storage costs.


