Frontend performance directly shapes user experience and business outcomes. Even a slight delay in page load or rendering can impact engagement, conversions, and retention. As frameworks like React, Angular, and Next.js grow more complex, monitoring how your frontend behaves in real time has become essential for every modern web team.
Frameworks like React, Angular, and Next.js introduce richer client-side logic, heavier bundles, and more network interactions. This makes it harder to understand what real users experience across devices, locations, and connection types. Traditional monitoring tools often miss these client-side signals, leaving teams blind to layout shifts, slow interactions, JavaScript errors, and degraded Core Web Vitals.
In this guide, we explore the best frontend monitoring tools, comparing their core capabilities, pricing models, and scalability to help teams choose the right solution for their frontend stack.
Best Frontend Performance Monitoring Tools
- CubeAPM
- Datadog
- Newrelic
- Dynatrace
- Sentry
- SpeedCurve
- Raygun
- Sematext
What is Frontend Performance Monitoring?
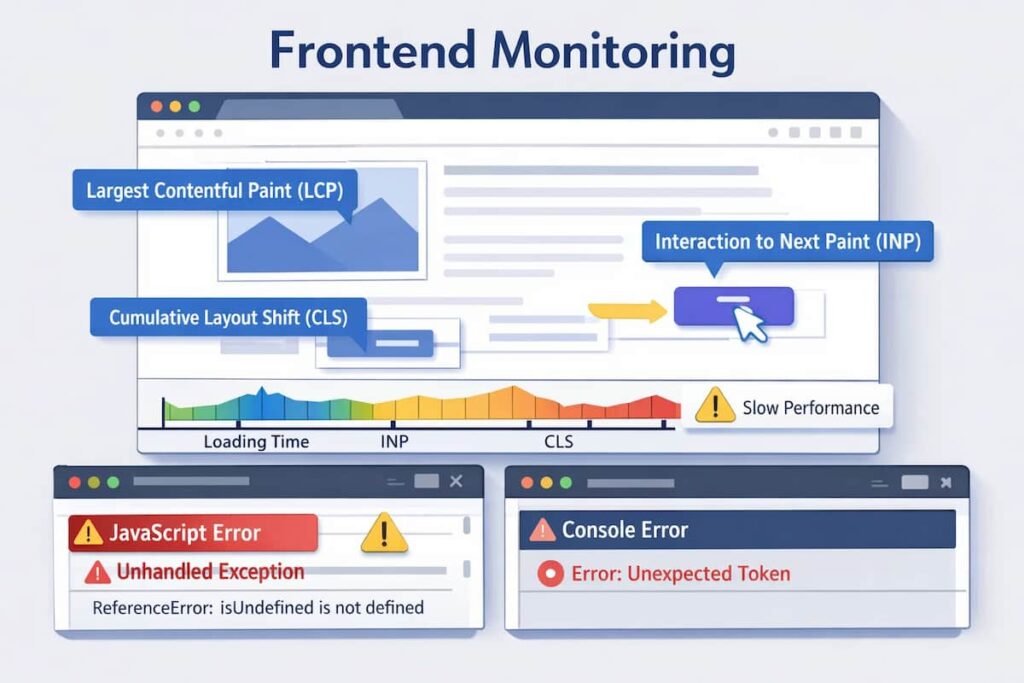
Frontend performance monitoring tracks how real users experience your website or web application. It focuses on client-side behaviour, everything that happens in the browser after a page loads. The goal is to help teams detect delays, layout shifts, and code inefficiencies that affect user experience and conversions.
It typically measures key metrics such as:
- Core Web Vitals: Largest Contentful Paint (LCP), First Input Delay (FID), and Cumulative Layout Shift (CLS)
- Page Load Time: Total time taken for the page to render interactive elements
- JavaScript Errors & Exceptions: Uncaught errors, crashes, and slow scripts
- Network Latency & API Timing: Delays caused by third-party requests and heavy assets
- Rendering Bottlenecks: Paint, reflow, and layout timing across devices
Unlike backend monitoring, which focuses on servers, APIs, and infrastructure, frontend monitoring captures what users actually experience on their screens.
Most modern tools combine Real User Monitoring (RUM) and Synthetic Monitoring to deliver this visibility:
- RUM continuously tracks performance from real users in production.
- Synthetic monitoring runs automated tests from different regions and browsers to simulate real-world journeys.
Together, they give engineering teams a complete picture of frontend performance across environments, helping them diagnose issues before users notice them.
Common Frontend Monitoring Challenges Teams Run Into
As frontend applications scale beyond simple single-page setups, monitoring challenges shift from basic uptime checks to understanding real user experience across devices, browsers, networks, and geographies. Performance behavior becomes highly variable, data volume grows rapidly, and errors become harder to isolate, making traditional lab metrics and isolated signals insufficient. In practice, these challenges tend to surface in a few recurring areas that directly affect how teams measure and debug frontend performance:
- Capturing reliable Core Web Vitals: Real-world performance varies significantly by device, geography, and network quality, making synthetic tests and lab metrics an incomplete representation of actual user experience.
- Managing high-volume real user data: Session replays, events, and performance timings generate large data volumes that are costly and difficult to analyze without aggregation, prioritization, and sampling controls.
- Reducing JavaScript error noise: Client-side exceptions, third-party script failures, and browser-specific issues often overwhelm error tracking, masking the errors that truly impact users.
- Correlating experience, performance, and errors: Without strong linkage between user sessions, Web Vitals, and frontend errors, teams are left with fragmented signals that slow root-cause analysis and incident response.
Why Teams Choose Different Frontend Performance Monitoring Tools
1. Core Web Vitals Coverage & Accuracy
Teams prioritize tools that report LCP, INP, and CLS at the 75th percentile (field data) and allow segmentation by device and network type. This reflects how Google evaluates site performance in real-world conditions and determines Core Web Vitals scores that impact SEO and user satisfaction.
2. RUM and Synthetic Balance
Most organizations combine Real User Monitoring (RUM) with Synthetic Monitoring. RUM captures actual user experiences, while Synthetic tests simulate sessions from multiple browsers or geographies. Tools that offer both give teams better visibility into live performance and pre-release testing.
3. OpenTelemetry Momentum & Vendor Neutrality
Engineering teams increasingly favor OpenTelemetry-first platforms to avoid vendor lock-in. OTel-native ingestion pipelines unify metrics, traces, and logs across multiple agents and environments, simplifying data collection and enabling cost transparency.
4. Pricing Model Predictability at Scale
Frontend telemetry RUM sessions, replays, and Synthetic runs can grow rapidly. Teams compare per-session, per-host, and per-GB ingestion models to find sustainable pricing. Predictable, ingestion-based billing helps prevent sudden cost spikes once traffic scales beyond a few terabytes per month.
5. Privacy & Session Replay Governance
Session replay is useful but risky without strong privacy controls. Teams prefer tools with automatic masking, granular redaction rules, and GDPR/CCPA compliance. Client-side filtering ensures sensitive information like passwords or form data never leaves the browser.
6. Breadth of Correlation Across the Stack
Frontend performance often depends on backend latency, API response times, or infrastructure load. Tools that let users pivot seamlessly between RUM data, traces, logs, and metrics enable faster root-cause analysis and reduce mean time to resolution (MTTR).
What Frontend Monitoring Looks Like at Scale
At scale, frontend monitoring shifts from basic page load tracking to continuous measurement of real user experience. Teams rely on real user monitoring to observe Core Web Vitals across browsers, devices, and network conditions, while tying performance changes to releases, experiments, and feature flags.
High-volume session data must be sampled intelligently to remain cost-effective without losing visibility into slow or broken experiences. Effective frontend monitoring platforms correlate performance metrics with JavaScript errors and user interactions, allowing teams to identify which issues affect the most users and where they originate. As traffic grows, the goal becomes maintaining consistent, actionable insight into user experience without overwhelming engineering teams with noisy data.
Top 8 Frontend Performance Monitoring Tools
1. CubeAPM
Known For
CubeAPM is an OpenTelemetry-native observability platform built for full-stack visibility across modern web and cloud environments. It simplifies frontend performance monitoring with an ingestion-based pricing model and offers deep browser insights and unlimited data retention. Designed for engineering teams that value transparency and control, CubeAPM helps capture every performance signal without unpredictable billing or vendor lock-in.
Frontend Performance Monitoring Features
- Tracks Core Web Vitals (LCP, INP, CLS) and detailed page load metrics.
- Detects JavaScript errors, long tasks, and rendering bottlenecks across browsers and devices.
- Provides network timing analysis for identifying slow resources and third-party scripts.
- Supports Synthetic Monitoring for pre-deployment testing and uptime validation.
- Real User Monitoring (RUM) dashboards visualize live sessions and user journeys.
Key Features
- Unified MELT platform (Metrics, Events, Logs, Traces).
- Smart sampling for efficient trace capture without losing visibility.
- Multi-agent compatibility supporting Datadog, New Relic, Prometheus, Elastic, and OpenTelemetry.
- Bring-Your-Own-Cloud setup with full data localization compliance.
- Slack and WhatsApp-based support with response times in minutes.
Pros
- Predictable $0.15/GB ingestion-based pricing for all telemetry types.
- Seamless correlation across frontend, backend, and infrastructure data.
- Smart sampling reduces storage and compute overhead by up to 70%.
- Compliant with regional data laws, with data stored inside the user’s own cloud.
- Easy migration from legacy APM tools in under an hour.
Cons
- Not suited for teams looking for off-prem solutions
- Strictly an observability platform and does not support cloud security management.
Pricing
CubeAPM offers a single, transparent rate of $0.15 per GB ingested, covering logs, metrics, traces, and frontend telemetry, with no per-user, per-host, or feature-based charges.
CubeAPM Frontend Performance Monitoring Pricing at Scale
*All pricing comparisons are calculated using standardized Small/Medium/Large team profiles defined in our internal benchmarking sheet, based on fixed log, metrics, trace, and retention assumptions. Actual pricing may vary by usage, region, and plan structure. Please confirm current pricing with each vendor.
For a mid-sized SaaS company ingesting 45TB (~45,000) of total monthly data ingestion and 45,000TB of observability data outcharged by the cloud provider, the total cost will be about ~$7200/month.
Tech Fit
CubeAPM fits best for frontend-heavy teams using React, Angular, Vue, or Next.js that need accurate Core Web Vitals tracking, real-user visibility, and cost predictability. It’s particularly suitable for organizations adopting OpenTelemetry and modern multi-agent observability architectures that demand ownership of their data and consistent pricing at scale.
2. Datadog
Known For
Datadog is one of the most established enterprise observability platforms, offering extensive integrations across infrastructure, applications, and frontend systems. It’s known for its feature depth, broad ecosystem support, and mature dashboards that help DevOps and SRE teams track performance across distributed environments. For frontend teams, Datadog provides browser-level monitoring, synthetic checks, and session replay, though its complex pricing and host-based model can make large-scale deployments costly.
Frontend Performance Monitoring Features
- Real User Monitoring (RUM) for browser and mobile applications with page load, network timing, and interaction tracking.
- Synthetic Monitoring for scripted workflows and uptime testing across multiple regions.
- Session Replay for visual playback of user sessions and interaction analysis.
- Error tracking for JavaScript exceptions and slow resource loading.
- Integration with backend APM for end-to-end correlation of frontend and backend performance.
Key Features
- Unified platform for metrics, logs, traces, network, and infrastructure monitoring.
- 900+ native integrations across cloud, container, and on-prem environments.
- AI-based anomaly detection and performance baselining.
- Advanced alerting and dashboard customization for web and mobile performance.
- Enterprise-grade role management and team collaboration features.
Pros
- Robust RUM and Synthetic testing for frontend visibility.
- Mature visualization and alerting capabilities across all telemetry layers.
- Seamless correlation between frontend events and backend traces.
- Large ecosystem of integrations for faster adoption in enterprise setups.
Cons
- Pricing complexity due to per-host, per-user, and per-GB billing.
- Costs scale steeply with data volume and synthetic test frequency.
- Learning curve for smaller teams due to UI complexity and dense configuration.
Pricing
- APM (Pro Plan): $35/host/month
- Infra (Pro Plan): $15/host/month
- Ingested Logs: $0.10 per ingested or scanned GB per month
Datadog Frontend Performance Monitoring Pricing at Scale
*All pricing comparisons are calculated using standardized Small/Medium/Large team profiles defined in our internal benchmarking sheet, based on fixed log, metrics, trace, and retention assumptions. Actual pricing may vary by usage, region, and plan structure. Please confirm current pricing with each vendor.
For a mid-sized SaaS company operating 125 APM hosts, 40 profiled hosts, 100 profiled container hosts, 500,000,000 indexed spans, 200 infra hosts, 1,500,000 container hours, 300,000 custom metrics, and ingesting around 10 TB (~10,000 GB) of logs per month with 3500 indexed logs, the monthly cost would be around ~$27,475/month.
Tech Fit
Datadog suits large enterprises that already rely on its ecosystem for infrastructure and backend monitoring and want to extend that visibility into browser-level metrics. It’s best for organizations with established DevOps workflows, large host counts, and budget flexibility.
3. New Relic
Known For
New Relic is a veteran in the observability space, widely recognized for its all-in-one monitoring platform that spans applications, infrastructure, and frontend performance. It combines deep analytics with interactive dashboards and advanced alerting, making it a popular choice among enterprise engineering teams. For frontend observability, New Relic offers powerful browser monitoring, Core Web Vitals tracking, and synthetic checks.
Frontend Performance Monitoring Features
- Browser agent captures Core Web Vitals such as LCP, INP, and CLS across devices and regions.
- Synthetic monitoring for scripted user journeys and page load validation.
- Session-level analysis with error tracking and resource performance metrics.
- Correlation between frontend behavior and backend trace spans for full transaction visibility.
- Advanced anomaly detection and AI-based alerts through New Relic Applied Intelligence.
Key Features
- Unified observability for metrics, logs, traces, and APM within a single platform.
- Real User Monitoring (RUM) and Synthetic Monitoring for browser and mobile apps.
- Visualization through New Relic One dashboards and query builder (NRQL).
- AI-assisted troubleshooting to detect anomalies and regressions automatically.
- Integrations across cloud, CI/CD, and DevOps ecosystems.
Pros
- Excellent dashboards and visualization tools for real-time monitoring.
- Strong AI-powered insights that reduce manual triage effort.
- Integrates both frontend and backend telemetry for complete observability.
- Offers a free 100 GB monthly ingest allowance, ideal for low-traffic apps or testing.
Cons
- Users find that the cost can escalate quickly with New Relic
- New users may find the learning curve steep due to the platform’s vast features
- Users find the complex setup process overwhelming
Pricing
- Free Tier: 100 GB per month data ingested
- Logs: $0.40 per GB beyond the free 100 GB limit
- Full Platform Users: $418.80 per user per month
New Relic Frontend Performance Monitoring Pricing at Scale
*All pricing comparisons are calculated using standardized Small/Medium/Large team profiles defined in our internal benchmarking sheet, based on fixed log, metrics, trace, and retention assumptions. Actual pricing may vary by usage, region, and plan structure. Please confirm current pricing with each vendor.
For a mid-sized SaaS company ingesting 45TB (~45,000 GB) of telemetry data per month and with 10 full users, the cost would come to around ~$25,990/month.
Tech Fit
New Relic is best suited for enterprise environments that need deep analytics, AI-driven anomaly detection, and unified monitoring across applications and infrastructure. It fits teams that value visual insights and mature reporting capabilities over pricing simplicity and is ideal for organizations already invested in the New Relic ecosystem for backend and infrastructure monitoring.
4. Dynatrace
Known For
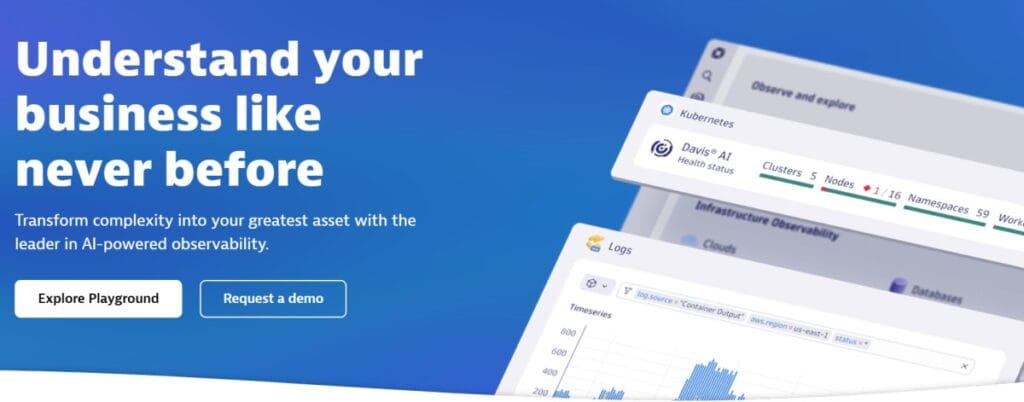
Dynatrace is an AI-powered observability platform designed for enterprises that require automation, scalability, and deep application intelligence. It combines full-stack monitoring with predictive analytics, helping teams detect anomalies before they impact users. For frontend performance, Dynatrace provides detailed browser visibility through its Digital Experience Monitoring suite, allowing engineers to trace every user interaction down to the exact JavaScript execution and API call.
Frontend Performance Monitoring Features
- Real User Monitoring (RUM) for web and mobile apps with Core Web Vitals measurement.
- Synthetic Monitoring for scripted journeys, uptime, and page availability.
- Automatic dependency discovery between frontend and backend services.
- Code-level diagnostics for JavaScript, AJAX, and third-party resource performance.
- Session Replay for reproducing user issues and slow-loading experiences.
Key Features
- Davis AI engine for automated root-cause analysis and anomaly prediction.
- Unified visibility across applications, infrastructure, and networks.
- Continuous discovery and mapping of dependencies with minimal manual setup.
- Powerful dashboards for tracking frontend latency, errors, and slow transactions.
- Extensive integration ecosystem for CI/CD pipelines, cloud, and security tools.
Pros
- Extremely scalable and automation-driven observability platform.
- Real-time AI insights help reduce manual investigation time.
- Deep frontend-to-backend correlation through unified trace data.
- Reliable synthetic monitoring across global test locations.
Cons
- Complex licensing model; pricing is difficult to predict without usage data.
- Users find the learning curve steep, with difficulties in configuring automations
- Cost can rise sharply for teams ingesting large log or trace volumes.
Pricing
- Infrastructure Monitoring: $29/mo/host
- Full-Stack Monitoring: $58/mo/8 GiB host
Dynatrace Frontend Performance Monitoring Pricing at Scale
*All pricing comparisons are calculated using standardized Small/Medium/Large team profiles defined in our internal benchmarking sheet, based on fixed log, metrics, trace, and retention assumptions. Actual pricing may vary by usage, region, and plan structure. Please confirm current pricing with each vendor.
For a midsized SaaS company operating 125 APM hosts, 200 infra hosts, 10TB (~10,000 GB) of ingested logs, 300,000 custom metrics, 1,500,000 container hours, and 45,000 GB of observability data out (charged by the cloud provider), the cost would be ~$21,850/month.
Tech Fit
Dynatrace is best suited for large enterprises and digital-first organizations that need predictive monitoring, AI-driven insights, and cross-system correlation across massive distributed systems. It’s ideal for teams that prioritize automation and proactive anomaly detection.
5. Sentry
Known For
Sentry is a developer-first monitoring tool built primarily for frontend and client-side applications. It’s best known for its powerful JavaScript error tracking, performance profiling, and Core Web Vitals monitoring capabilities. Designed with developers in mind, Sentry helps teams detect performance regressions, trace slow transactions, and reproduce issues in real time with minimal setup, making it one of the most popular choices for frontend observability.
Frontend Performance Monitoring Features
- Real User Monitoring (RUM) that tracks page load, interaction delay, and slow transactions.
- Core Web Vitals monitoring (LCP, INP, CLS) to assess real-world performance.
- JavaScript error tracking with detailed stack traces and source map support.
- Session Replay for reproducing user issues and interaction sequences.
- Integration with frontend frameworks like React, Angular, Vue.js, and Next.js.
Key Features
- Automatic correlation of errors, performance data, and user sessions.
- Transaction tracing for identifying bottlenecks across components.
- Release tracking and regression detection for faster rollbacks.
- Integration with GitHub, Slack, Jira, and other developer tools.
- Lightweight SDKs for web, mobile, and hybrid apps.
Pros
- Highly focused on frontend and client-side visibility.
- Intuitive interface with clean visualization for performance data.
- Affordable and flexible pricing plans for teams of all sizes.
- Excellent error debugging with contextual information and stack traces.
- Quick setup with minimal instrumentation required.
Cons
- Users find complex configuration processes challenging.
- Users experience an ineffective alerting system with delayed error notifications.
- Expensive as data volumes grow
Pricing
- Free Plan: Up to 5,000 events per month
- Team Plan: Starts at $26 per month (billed annually)
- Business Plan: From $80 per month per user with extended retention and advanced features
Sentry Frontend Performance Monitoring Pricing at Scale
*All pricing comparisons are calculated using standardized Small/Medium/Large team profiles defined in our internal benchmarking sheet, based on fixed log, metrics, trace, and retention assumptions. Actual pricing may vary by usage, region, and plan structure. Please confirm current pricing with each vendor.
A midsized SaaS company operating 125 APM hosts, 200 infra hosts, 10TB (~10,000 GB) of ingested logs, 300,000 custom metrics, 1,500,000 container hours, and 45,000GB of observability data out (charged by the cloud provider), the cost would come around ~$21,850/month.
Tech Fit
Sentry fits best for frontend-focused teams, startups, and developers who want actionable insights into web performance and real-time error tracking without enterprise complexity. It’s ideal for organizations using modern JavaScript frameworks and seeking fast feedback loops on frontend performance regressions and user experience issues.
6. SpeedCurve
Known For
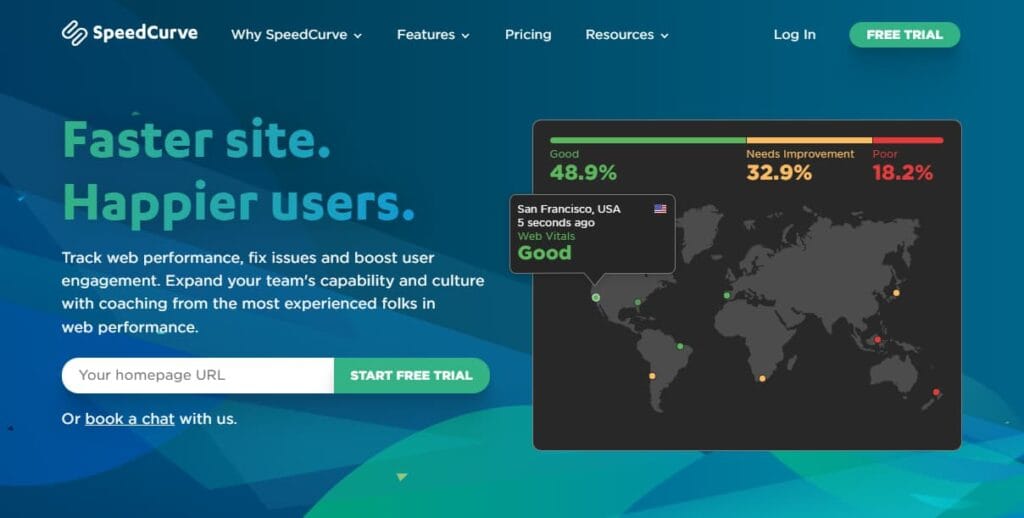
SpeedCurve is a performance-focused monitoring platform purpose-built for frontend and user experience optimization. It’s widely recognized for its combination of Real User Monitoring (RUM) and Synthetic Testing, offering developers clear insight into how design and code changes affect real-world performance and Core Web Vitals. SpeedCurve is a favourite among performance engineers who want detailed frontend metrics rather than general-purpose observability data.
Frontend Performance Monitoring Features
- Real User Monitoring that measures Core Web Vitals (LCP, INP, CLS) directly from real browsers.
- Synthetic testing with filmstrips and video playback to visualize rendering progress.
- Performance budgets for page weight, render time, and user-centric metrics.
- Visualization of layout shifts, image load timings, and font rendering.
- Long-term tracking for comparing site changes and deploy impact on UX.
Key Features
- Combines RUM and Synthetic data into unified dashboards.
- Supports performance budget alerts for Core Web Vitals.
- Easy integration with Lighthouse and Chrome UX Report.
- Historical trend analysis with up to 13 months of retention.
- Simple setup using a lightweight JS snippet and global test locations.
Pros
- Highly focused on frontend performance and Core Web Vitals tracking.
- Combines synthetic filmstrips with real-user data for context.
- Great visual insights into layout shifts, paint timings, and page structure.
- Provides actionable reports for developers, designers, and DevOps teams.
Cons
- It can get expensive as usage grows
- Complex UI can feel overwhelming for new users
- Complex initial setup and configuration
Pricing
- Starter Plan: $90 per month for RUM + 5 synthetic test sites
- Growth Plan: $576 per month for 10 sites and higher test frequencies
- Enterprise Plans: Custom pricing with expanded retention and API access
SpeedCurve Frontend Performance Monitoring Pricing at Scale
The following estimate is based on publicly available SpeedCurve pricing and a modeled frontend-focused monitoring setup. Actual costs may vary based on RUM session volume, synthetic test frequency, and data retention.
For a media company tracking around 1 million RUM sessions monthly with 10 synthetic test sites, the typical monthly cost would fall between $500 and $700, depending on data retention and test frequency. This makes SpeedCurve cost-effective for teams focused solely on frontend performance and Core Web Vitals, without the additional expense of infrastructure or APM features.
Tech Fit
SpeedCurve is best suited for frontend developers, UX engineers, and performance specialists focused on improving Core Web Vitals and visual rendering speed. It’s ideal for teams that care deeply about how design decisions affect load time, layout stability, and user perception of speed, rather than backend or system-level metrics.
7. Raygun
Known For
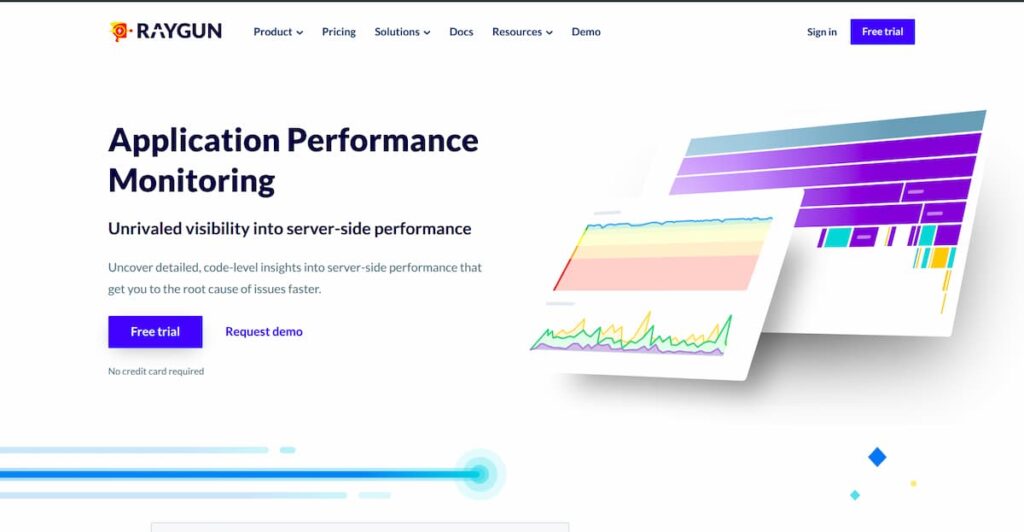
Raygun is a developer-friendly performance monitoring and error tracking platform known for its precision in identifying frontend performance bottlenecks. It offers rich Real User Monitoring (RUM), detailed JavaScript error analysis, and in-depth session diagnostics, making it a preferred tool for frontend and product teams that want actionable insights without overpaying for backend-heavy observability suites.
Frontend Performance Monitoring Features
- Real User Monitoring that tracks page load, interaction timing, and Core Web Vitals.
- Session-level performance data with geographic and device breakdowns.
- JavaScript error tracking with stack traces, user impact, and frequency.
- Deployment tracking to monitor performance regressions after releases.
- Support for single-page applications (SPA) like React, Angular, and Vue.js.
Key Features
- Combines crash reporting, performance tracking, and RUM in one platform.
- Provides detailed flame charts and load time breakdowns by component.
- Segment performance metrics by geography, browser, and OS.
- Alerts and anomaly detection for slow pages, scripts, and APIs.
- Integrates with CI/CD and issue-tracking tools like Jira and GitHub.
Pros
- Tailored for frontend performance visibility and real-user experience.
- Lightweight setup with simple SDK integration.
- Clean and easy-to-navigate UI for developers.
- Real-time insights with low overhead and fast data ingestion.
- Supports multiple environments and frameworks.
Cons
- Overwhelming UI, especially for those new to observability
- Steep learning curve for new users
Pricing
- Free Trial available
- RUM Plans(including front-end monitoring)
- Basic: start at $80 per 100,000 sessions per month
- Team: starts at $160 per 200,000 sessions per month
- Business: starts at $800 per 1,000,000 sessions per month
- APM (optional) from $8 per 10,000 traces per month
Raygun Frontend Performance Monitoring Pricing at Scale
The following estimate is based on Raygun’s published usage-based pricing and models a mid-sized SaaS application with typical frontend traffic and moderate error rates. Actual costs vary depending on session volume, error frequency, and configuration
For a mid-sized SaaS application processing approximately 12 million user sessions per month, Raygun’s RUM usage alone contributes roughly $9,600 per month at $8 per 10,000 sessions. Frontend error tracking costs vary widely based on application stability and logging behavior; at moderate error rates of 5–10 million events per month, Crash Reporting typically adds $2,000 to $4,000 monthly. In total, realistic monthly frontend monitoring costs commonly fall in the $12,000 to $14,000 range, excluding optional APM tracing.
Tech Fit
Raygun is best suited for frontend development teams, SaaS products, and digital businesses focused on real-user experience and application speed. It fits teams that want affordable yet powerful monitoring with detailed RUM insights and error tracking, especially those running modern single-page applications and needing visibility across browsers and devices.
8. Sematext
Known For
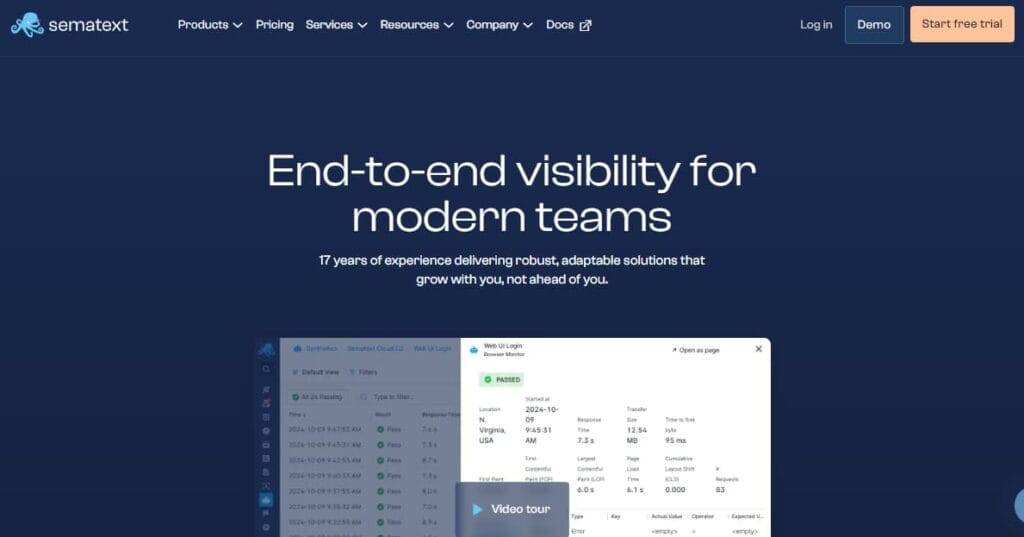
Sematext is a lightweight, cloud-based frontend monitoring solution built for teams that want actionable Real User Monitoring (RUM) insights without complex setup. It’s known for its accurate Core Web Vitals tracking, flexible alerting, and transparent pay-as-you-go pricing. Unlike heavy APM platforms, Sematext focuses solely on the browser experience, giving developers and DevOps teams visibility into how users actually perceive performance.
Frontend Performance Monitoring Features
- Real User Monitoring for tracking Core Web Vitals (LCP, INP, CLS) and interaction metrics.
- Synthetic Monitoring for simulating web transactions and uptime checks.
- Error tracking and JavaScript exception monitoring with context.
- Geo-based performance data to identify slow regions or ISPs.
- Integration with logs and infrastructure metrics through the broader Sematext Cloud suite.
Key Features
- Simple setup using a single JavaScript snippet.
- Unified dashboards for RUM and Synthetic data correlation.
- Alerts for slow transactions, page load spikes, and Web Vitals degradation.
- API and webhook integrations for Slack, PagerDuty, and other tools.
- Clear visualizations that combine frontend metrics with backend context.
Pros
- Transparent, usage-based pricing with no host or user fees.
- Quick setup and minimal performance overhead.
- Combines real-user data with synthetic testing in a single view.
- Works well for small to mid-sized teams that need fast insights.
Cons
- Expensive, especially when data volumes grow
- Overwhelming UI for new users
- A steep learning curve might impede onboarding
Pricing
- Free plan available for small projects.
- Synthetic Monitoring: starts at $2 per monitor per month.
- Additional usage is billed on a pay-as-you-go basis.
Sematext Frontend Performance Monitoring Pricing at Scale
The following estimate is based on Sematext’s published RUM and synthetic monitoring pricing and models a mid-sized SaaS application with sustained frontend traffic. Actual costs may vary depending on traffic growth, sampling, and pay-as-you-go usage.
For a mid-sized SaaS application generating approximately 5 million frontend page views per month, Sematext’s RUM pricing alone results in monthly costs of around $10,000 (5 million page views at $2 per 1,000 views). Synthetic monitoring adds a comparatively small incremental charge, starting at $2 per monitor per month, depending on the number of configured tests. Overall pricing scales directly with traffic volume, making frontend usage the primary cost driver as applications grow.
Tech Fit
Sematext Experience is ideal for digital teams, developers, and startups looking for clear browser performance insights without heavy infrastructure costs. It’s a great fit for teams that want to measure Core Web Vitals, test synthetic flows, and monitor user experience in real time.
Conclusion
Frontend monitoring is now essential for modern web applications as client-side complexity and user expectations continue to increase. Tools in this category vary widely in how they measure usage, price consumption, and scale with real-world traffic, making cost behavior an important factor in evaluation.
Session- and page-view-based pricing can work at smaller scales but often grows quickly as applications mature. Choosing the right frontend monitoring tool requires aligning pricing models and data coverage with actual usage patterns and long-term growth expectations.
Disclaimer: The information in this article reflects the latest details available at the time of publication and may change as technologies and products evolve.
FAQs
1. What is frontend performance monitoring, and why is it important?
Frontend performance monitoring helps teams understand how fast and stable their applications are for real users. It tracks metrics like Core Web Vitals, page load time, and JavaScript errors to ensure smooth interactions and a better user experience.
2. What are the most important metrics to measure in frontend performance monitoring?
The key metrics include Core Web Vitals (LCP, INP, CLS), Time to Interactive (TTI), First Contentful Paint (FCP), and error rates. Monitoring these gives developers a clear picture of responsiveness, stability, and perceived speed.
3. How do frontend performance monitoring tools differ from backend APM tools?
Frontend monitoring focuses on real user experience, browser rendering, network latency, and UI responsiveness, while backend APM tools measure API latency, server health, and database performance.
4. Are free or open-source frontend monitoring tools effective for production use?
Free tools like Lighthouse or Chrome UX Report are excellent for testing, but lack continuous tracking. For live environments, solutions such as CubeAPM or SpeedCurve offer real-time monitoring, alerting, and historical trend analysis, ideal for production workloads.
5. How can I choose the right frontend performance monitoring tool for my needs?
Look for a tool that fits your data scale, budget, and observability requirements. Platforms like CubeAPM provide predictable ingestion-based pricing and OpenTelemetry support, while others like Sentry or Raygun focus more on lightweight JavaScript error tracking.


