Angular powers dynamic single-page applications where frontend issues like delayed rendering, heavy bundles, and failed API calls can directly affect user experience. Monitoring these client-side metrics is critical, yet most traditional APM tools overlook browser-level performance, Core Web Vitals, and route transitions unique to Angular.
CubeAPM delivers purpose-built Angular monitoring through OpenTelemetry-native tracing, real-user monitoring, and smart sampling. It captures JavaScript errors, tracks route performance, and correlates frontend spans with backend traces — giving teams complete visibility into Angular performance within a predictable $0.15/GB ingestion model.
In this guide, we’ll explore the best Angular monitoring tools available, analyzing their features, scalability, and cost efficiency to help you choose the best fit for your applications.
Best Angular Monitoring Tools
- CubeAPM
- Honeycomb
- Datadog
- Sentry
- New Relic
- Grafana
- AppSignal
- Highlight.io
- Dynatrace
What Is Angular Monitoring
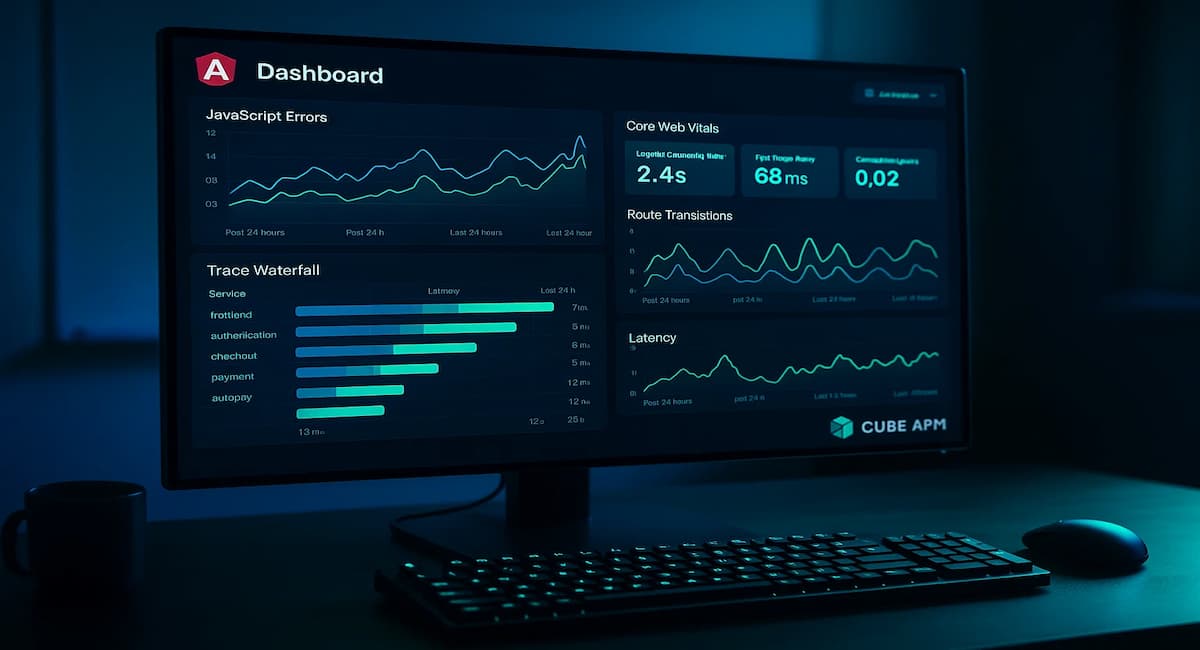
Angular monitoring refers to tracking the performance, stability, and user experience of applications built using the Angular framework. Unlike backend monitoring, which focuses on servers and APIs, Angular monitoring captures real-time activity inside the browser — including page loads, route changes, rendering time, and user interactions.
Modern Angular applications rely heavily on dynamic rendering, client-side routing, and API-driven data flows. This makes visibility into Core Web Vitals, JavaScript errors, and network latency essential for maintaining responsiveness and reliability. Angular monitoring tools collect telemetry from the browser — such as metrics, logs, traces, and user session data — to detect slow components, unhandled exceptions, or long-running change detection cycles.
Comprehensive Angular monitoring typically includes:
- Real User Monitoring (RUM): Tracks actual user sessions, load times, route transitions, and interactions across devices and networks.
- Frontend Tracing: Links user actions (like clicks or navigations) with backend service traces to show where latency originates.
- Error Tracking: Detects unhandled exceptions, failed API calls, and script errors for faster debugging.
- Performance Metrics: Measures First Contentful Paint (FCP), Time to Interactive (TTI), Largest Contentful Paint (LCP), and other Core Web Vitals that define perceived speed.
- Network and API Insights: Monitors outbound HTTP calls, GraphQL or REST requests, and their effect on frontend responsiveness.
In short, Angular monitoring bridges the gap between frontend user experience and backend service performance — helping teams identify performance regressions, reduce mean time to resolution (MTTR), and optimize the overall digital experience.
Example: How CubeAPM Handles Angular Application Monitoring
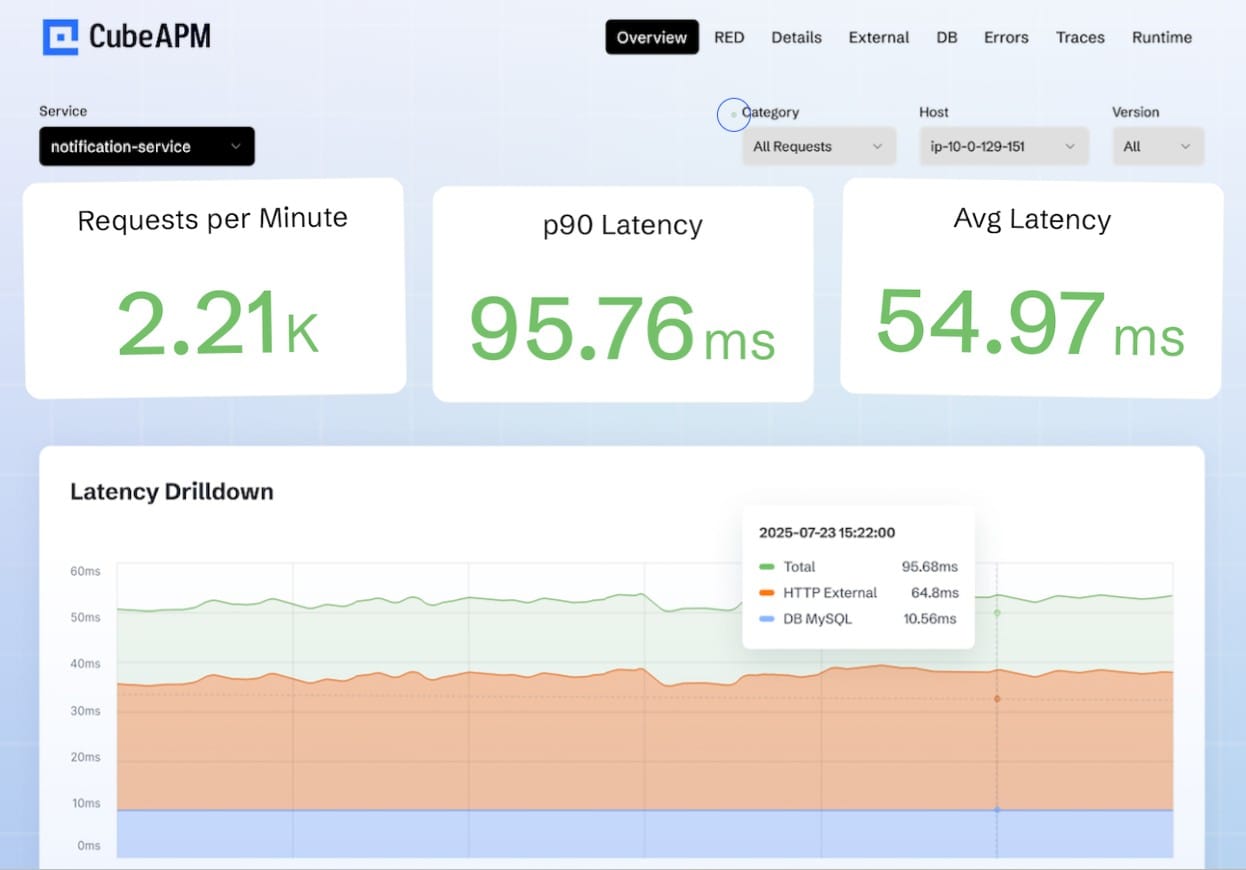
CubeAPM provides a complete Angular monitoring workflow built on OpenTelemetry (OTEL) standards. It enables developers to capture user-side performance data, JavaScript errors, and browser traces — then correlate them with backend spans to visualize the full user journey.
Using the CubeAPM Angular SDK, telemetry from the browser is automatically instrumented without complex setup. The agent records route transitions, component render times, API latency, and Core Web Vitals such as LCP, CLS, and FID. This data is then enriched with context like browser type, device, and geographic region for real-user insights.
CubeAPM also supports distributed tracing for Angular applications that communicate with backend microservices. Each frontend span (e.g., route load or button click) can be linked to backend services such as APIs, databases, or queues. This helps teams pinpoint whether slowness originates in the browser, network, or infrastructure layer.
With smart sampling, CubeAPM retains high-value Angular telemetry while controlling ingestion costs — ensuring detailed visibility even during peak traffic. Dashboards display frontend latency, error rates, and API response trends in real time, helping developers detect regressions before users are impacted.
Key highlights for Angular monitoring with CubeAPM:
- Real-user monitoring with full Core Web Vitals tracking
- Automatic tracing of route transitions and component renders
- JavaScript error aggregation and stack trace analysis
- Session-level correlation between frontend and backend spans
- Predictable $0.15/GB ingestion model with no per-user or feature fees
In short, CubeAPM turns Angular telemetry into actionable insights — combining performance data, logs, and traces into one observability platform designed for speed, scalability, and developer clarity.
Why Teams Choose Different Angular Application Monitoring Tools
1. Cost Model and Predictability
Different teams prioritize predictable billing when choosing an observability platform. Pricing models vary — some tools charge by data volume, while others use host or user-based tiers. Predictable per-GB pricing helps organizations avoid unexpected cost spikes as traffic and telemetry grow.
2. Frontend vs. Backend Visibility
Many tools focus mainly on backend metrics, leaving frontend gaps. Angular teams, however, need deep insight into client-side performance — including route transitions, rendering speed, and Core Web Vitals. A good monitoring solution should track how these frontend metrics affect real user experience.
3. Data Control and Retention
As Angular telemetry increases, storage and retention policies become critical. Teams often look for solutions that allow flexible data retention, cost-efficient storage, and compliance-friendly data ownership — especially for regulated industries.
4. Open Standards and Interoperability
Vendor lock-in remains a common concern. Platforms built on open standards like OpenTelemetry (OTEL) allow teams to reuse instrumentation, migrate data easily, and maintain compatibility with existing observability pipelines.
5. Troubleshooting Speed
Angular performance issues often appear in specific routes, browsers, or user sessions. Teams value fast, high-cardinality queries and responsive dashboards that make it easier to isolate slow components or failed API calls in real time.
6. Team Size and Access
Large development teams prefer flexible user access. Unlimited or role-based viewing options ensure engineers, QA, and product teams can collaborate without additional license costs.
7. Sampling and Noise Reduction
Frontend telemetry can generate large data volumes. Intelligent sampling filters repetitive or low-value events, helping teams reduce noise while keeping visibility for critical user sessions.
8. User Experience and Replay Features
Session replays and UX monitoring provide valuable context for debugging Angular applications. Teams that focus on product performance and usability often prioritize tools that combine RUM data with user behavior tracking.
Top 9 Angular Monitoring Tools
1. CubeAPM

Known For
CubeAPM is known for its OpenTelemetry-native observability platform that unifies logs, metrics, traces, and RUM under a transparent per-GB pricing model. It provides deep visibility into Angular applications, capturing route performance, frontend traces, and real-user experience in real time. Its focus on simplicity, scalability, and predictable costs makes it ideal for teams running performance-critical Angular frontends at scale.
Angular Monitoring Features
- Core Web Vitals tracking (LCP, CLS, FID, INP)
- Route transition and navigation timing
- JavaScript error and stack trace capture
- API latency and network request monitoring
- Real-user session and device-level performance metrics
- Frontend-to-backend span correlation
- Smart sampling for high-signal telemetry
Key Features
- OpenTelemetry-native ingestion and dashboards
- Unified observability for frontend and backend visibility
- Real-time alerting and error aggregation
- Self-host or BYOC deployment flexibility
- No per-user or feature-based limitations
Pros
- Transparent $0.15/GB pricing across all telemetry types
- Native correlation between Angular spans and backend services
- Unlimited users and flexible deployment options
- Scalable architecture suited for large telemetry volumes
Cons
- Not suited for teams looking for off-prem solutions
- Strictly an observability platform and does not support cloud security management
Pricing
CubeAPM uses a flat $0.15 per GB ingestion model, covering logs, traces, metrics, and RUM without hidden or tiered charges.
CubeAPM Angular Monitoring Pricing at Scale
*All pricing comparisons are calculated using standardized Small/Medium/Large team profiles defined in our internal benchmarking sheet, based on fixed log, metrics, trace, and retention assumptions. Actual pricing may vary by usage, region, and plan structure. Please confirm current pricing with each vendor.
For a mid-sized SaaS company ingesting 45TB(~45,000) total monthly data ingestion and 45,000TB of observability data outcharged by the cloud provider, the total cost will be about ~$7200/month.
Tech Fit
CubeAPM fits Angular-centric engineering teams seeking precise frontend performance visibility, Core Web Vitals tracking, and full backend correlation in one platform. It’s best suited for organizations that prioritize OpenTelemetry compatibility, self-host options, and transparent pricing while maintaining full control over observability data.
2. Honeycomb
Known For
Honeycomb is known for its high-cardinality observability platform built for debugging complex, event-driven applications. It specializes in rapid querying, trace visualization, and root-cause analysis across millions of events. For Angular monitoring, Honeycomb provides detailed visibility into frontend spans, API latency, and user interactions through native OpenTelemetry instrumentation.
Angular Monitoring Features
- OpenTelemetry browser SDK support for Angular SPAs
- Route transition and render time tracking
- Frontend-to-backend distributed tracing
- Real-user monitoring with performance metrics
- JavaScript error and exception tracking
- Query-based dashboards for Core Web Vitals
- High-cardinality filters for user, device, and region
Key Features
- Fast, columnar event store for trace analysis
- Query builder for ad-hoc debugging and visualization
- Built-in SLO management and burn-rate alerts
- Powerful correlation between spans and events
- Seamless OpenTelemetry ingestion
Pros
- Exceptional speed for high-cardinality queries
- Strong support for event-driven debugging
- Unlimited user access across teams
- Transparent usage-based pricing
Cons
- Missing features, users desire more in-product control over quota management
- Steep learning curve for new users unfamiliar with Honeycomb’s data model
- Expensive, especially when data volumes grow
Pricing
- Free Tier: 20 million events/month
- Pro Tier: $130/month per 100 million events
Honeycomb Angular Monitoring Pricing at Scale
For a company ingesting 45 TB/month of Angular telemetry — roughly 10 billion events — the estimated monthly cost is about $8,000 using the Pro Tier plan. This figure is based on Honeycomb’s pricing of $130 per 100 million events, adjusted for enterprise volume discounts typically applied at scale. It includes all frontend events, traces, and query capabilities with standard 60-day retention.
Tech Fit
Honeycomb fits frontend and SRE teams that rely on fast, data-rich querying to debug Angular performance issues. It’s ideal for organizations using OpenTelemetry-based pipelines and event-driven architectures, where flexible, high-cardinality queries matter more than session replay or UX visualization.
3. Datadog
Known For
Datadog is known for its enterprise-grade cloud observability platform that integrates infrastructure monitoring, APM, logs, security, and RUM into a unified SaaS solution. It’s widely used for distributed tracing and alerting but is often considered complex and costly at scale. For Angular monitoring, Datadog provides strong browser-side visibility and correlates frontend RUM data with backend services in one dashboard.
Angular Monitoring Features
- Real User Monitoring (RUM) for Angular SPAs
- JavaScript error and session tracking
- Core Web Vitals and load time metrics
- Frontend-to-backend trace correlation
- Network and API call monitoring
- Session replay and user journey analysis
- Synthetic tests for route or API uptime
Key Features
- Unified APM, infrastructure, and frontend observability
- 900+ integrations across cloud and application ecosystems
- Advanced alerting and anomaly detection
- AI-driven performance insights (Watchdog)
- Role-based dashboards and visualization tools
Pros
- Comprehensive platform covering full-stack observability
- Mature integrations with CI/CD, cloud, and container systems
- Session replay and real-user monitoring included
- Reliable enterprise-grade support
Cons
- Pricing complexity due to multiple SKUs
- Steep learning curve, which impedes onboarding
- Complex initial setup
Pricing
- APM (Pro Plan): $35/host/month
- Infra (Pro Plan): $15/host/month
- Ingested Logs: $0.10 per ingested or scanned GB per month
Datadog Angular Monitoring Pricing at Scale
For a mid-sized SaaS company running 125 APM hosts, 40 profiled hosts, and 100 profiled container hosts, processing approximately 500 million indexed spans, 200 infrastructure hosts, 1.5 million container hours, and 300,000 custom metrics—while ingesting about 10 TB (≈10,000 GB) of logs per month with 3,500 indexed logs—the total monthly cost would be approximately $27,475.
Tech Fit
Datadog suits large engineering organizations that need unified observability across infrastructure, backend, and frontend Angular applications. It’s best for teams operating at enterprise scale.
4. Sentry
Known For
Sentry is known for its real-time error tracking and performance monitoring platform, widely adopted by frontend developers and JavaScript frameworks such as Angular, React, and Vue. It focuses on helping teams detect, diagnose, and resolve frontend errors quickly while providing performance visibility into route transitions, load times, and API latency.
Angular Monitoring Features
- Native Angular SDK for automatic error capture
- Real User Monitoring (RUM) for frontend performance
- Route change and component render tracking
- JavaScript error grouping and source map integration
- Core Web Vitals (LCP, FID, CLS) visualization
- API latency and network request timing
- Session replay for user journey debugging
Key Features
- Real-time exception tracking with full stack traces
- Frontend performance monitoring and transaction tracing
- Session replay with console logs and user actions
- Custom dashboards and performance thresholds
- Release health tracking for new Angular builds
Pros
- Excellent for frontend error tracking and debugging
- Simple setup for Angular via SDK
- Session replay adds UX context to performance issues
- Predictable data-based pricing and alerting
Cons
- Shorter default data retention in lower plans
- Costs scale quickly with high error volume
Pricing
- Developer: free includes 1 user, error monitoring, and tracing.
- Team: $26/month
- Business: $80/month
Sentry Angular Monitoring Pricing at Scale
For a mid-sized SaaS company ingesting 10,000 TB (~10,000GB) of logs, 500,000,000 indexed spans, and 45,000GB of observability data (charged by the cloud provider), the cost would come around $12,100/month.
Tech Fit
Sentry fits frontend and product engineering teams focused on Angular user experience and release stability. It’s ideal for organizations that prioritize JavaScript error monitoring, session replay, and Core Web Vitals tracking, but don’t require deep backend observability or infrastructure metrics.
5. New Relic
Known For
New Relic is known for its data-driven observability platform that consolidates APM, logs, metrics, and RUM under a single usage-based pricing model. It offers robust analytics, flexible dashboards, and AI-assisted anomaly detection. For Angular applications, New Relic provides detailed frontend insights, capturing user interactions, JavaScript errors, and Web Vitals alongside backend traces.
Angular Monitoring Features
- Real User Monitoring (RUM) for Angular SPAs
- JavaScript error detection and stack trace capture
- Route transition timing and frontend latency tracking
- Core Web Vitals (LCP, FID, CLS) measurement
- Network and API call performance analysis
- Session replay and user journey mapping
- Correlation between Angular spans and backend services
Key Features
- Unified observability across logs, traces, and metrics
- OpenTelemetry-native ingestion and instrumentation support
- AI-driven anomaly and regression detection
- Flexible dashboarding with NRQL queries
- Usage-based single-platform billing
Pros
- Comprehensive frontend and backend visibility
- Transparent, usage-based billing with 100 GB free per month
- Simple onboarding for JavaScript and SPA frameworks
- AI-powered performance analytics through New Relic Groks
Cons
- Per-user fees add up for larger teams
- Limited data retention in free tiers
- Complex billing structure for large multi-service environments
Pricing
- Free Tier: 100GB/month ingested
- Pro plan: $0.40/GB ingested beyond the free 100GB limit
- Pro Plan: $349/user for full platform user
New Relic Angular Monitoring Pricing at Scale
A mid-sized SaaS company ingesting 45TB (~45,000 GB) of telemetry data per month and with 10 full users, the cost would come around ~$25,990/month.
Tech Fit
New Relic fits data-driven engineering teams looking for real-time analytics and granular Angular performance data in a single platform. It’s well-suited for organizations with moderate-to-large telemetry volumes that value AI-assisted insights.
6. Grafana Cloud
Known For
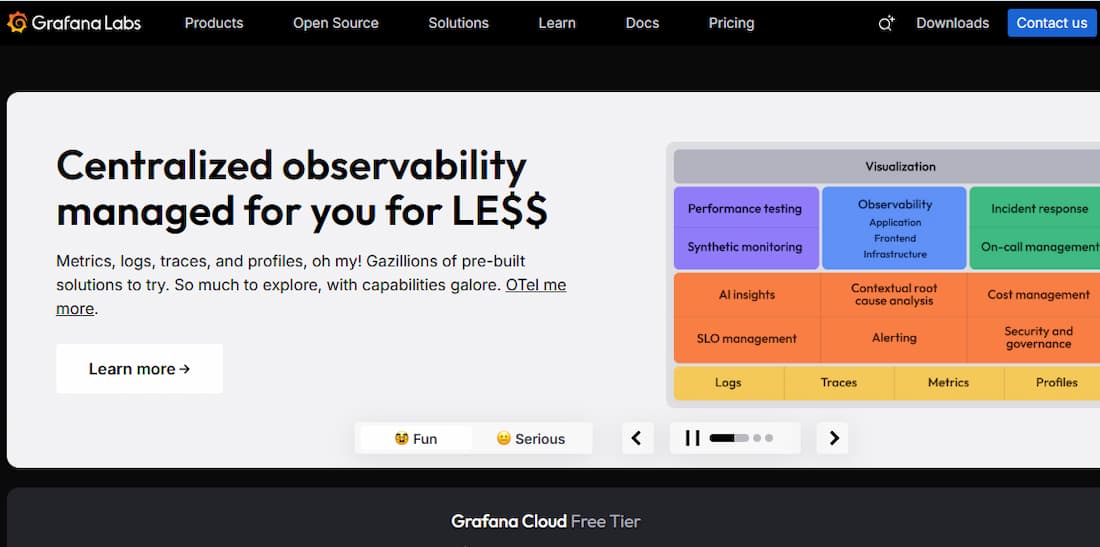
Grafana Cloud is known for its open and composable observability platform that combines metrics, logs, and traces using Prometheus, Loki, and Tempo. It offers strong OpenTelemetry compatibility, flexible dashboards, and powerful query capabilities. For Angular applications, Grafana Cloud provides real-user performance tracking, browser spans via OTEL instrumentation, and seamless correlation with backend services through Tempo traces.
Angular Monitoring Features
- OpenTelemetry browser SDK integration for Angular SPAs
- Route transition and render performance tracking
- Core Web Vitals visualization using Prometheus metrics
- JavaScript error and console log ingestion via Loki
- Real User Monitoring (RUM) using Grafana Faro agent
- Frontend-to-backend trace correlation in Tempo
- Alerting and anomaly detection with Grafana Alerting
Key Features
- Unified metrics, logs, and traces in one platform
- Custom, interactive dashboards and visualization panels
- Built-in RUM through Grafana Faro
- Synthetic and uptime monitoring integrations
- Flexible ingestion and retention options
Pros
- Strong OpenTelemetry and OTLP support
- Highly customizable dashboards and alerts
- Scalable cloud or self-hosted options
- Transparent, modular pricing across telemetry types
Cons
- Requires setup effort for Angular OTEL instrumentation
- Separate pricing per data type (logs, metrics, traces)
Pricing
- Logs (Loki): $0.50/GB (Pro plan), custom for Enterprise
- Traces (Tempo): $0.50/GB (Pro plan), custom for Enterprise
- Metrics (Prometheus/Mimir): billed separately
Grafana Cloud Angular Monitoring Pricing at Scale
For a mid-sized company operating 125 APM hosts, 200 infra hosts, 10TB(~10,000 GB) of ingested logs, and 45,000GB of observability data out(charged by cloud provider), the cost would come around ~$11,875/month.
Tech Fit
Grafana Cloud fits engineering teams that need OpenTelemetry-native Angular observability with complete dashboard flexibility. It’s ideal for organizations already using Prometheus or Loki who want to extend monitoring to Angular applications while maintaining full control over data visualization and retention.
7. AppSignal
Known For
AppSignal is known for its developer-friendly performance monitoring platform built for simplicity and clarity. It focuses on helping engineering teams track application errors, performance, and metrics without complex setup or billing. For Angular monitoring, AppSignal provides lightweight browser instrumentation to capture page load times, JavaScript errors, and API latency directly from the client side.
Angular Monitoring Features
- Native JavaScript and Angular SDK support
- Real User Monitoring (RUM) for frontend performance
- Route transition and page load timing
- JavaScript error tracking and stack traces
- Core Web Vitals and rendering metrics
- API latency and network request visualization
- Uptime and deployment tracking for Angular builds
Key Features
- Simple, prebuilt dashboards for application health
- Unified error and performance monitoring
- Custom metrics via AppSignal API
- Anomaly detection and alerting
- Straightforward integration for frontend and backend apps
Pros
- Very easy setup and minimal configuration
- Transparent, predictable pricing
- Clear dashboards and error analytics
- Lightweight SDK suitable for Angular SPAs
Cons
- Overwhelming UX/UI that hinders usability for beginners
- High costs, especially for high traffic
Pricing
- APM: $25/month (covers 250K requests)
- Logging: free add-on (1 GB/month included)
- Enterprise SAML SSO: $599/month
- Long-term log storage: $99/month
- HIPAA compliance: $99/month
AppSignal Angular Monitoring Pricing at Scale
For a company running Angular applications with high traffic, AppSignal’s pricing starts at $25 per 250K requests/month. For a production-scale Angular app handling around 100 million requests per month, the estimated APM cost is about $10,000/month (400 × $25). Logging is free up to 1 GB, with optional long-term storage at $99/month and SAML/SSO or HIPAA compliance add-ons for enterprise use. This model provides predictable billing and lightweight monitoring for both frontend and backend Angular services.
Tech Fit
AppSignal fits small to mid-sized teams building Angular applications that need straightforward monitoring, real-user insights, and predictable billing. It’s ideal for startups and product teams that prioritize simplicity and fast setup over complex enterprise-scale configurations.
8. Highlight.io
Known For
Highlight.io is known for its open-source frontend observability platform designed for developers building modern web apps. It combines session replay, error tracking, and performance monitoring in one lightweight package. For Angular teams, it provides clear visibility into JavaScript errors, route-level performance, and user session behavior without the overhead of enterprise APM tools.
Angular Monitoring Features
- Native SDK for Angular and other frontend frameworks
- Session replay with DOM, console, and network events
- Core Web Vitals (LCP, FID, CLS) and render timing metrics
- Route transition and SPA navigation tracking
- JavaScript error detection and stack traces
- API latency and failed request insights
- User session heatmaps and replay timeline
Key Features
- Full frontend observability in an open-source stack
- Real-user and synthetic monitoring in one interface
- Easy self-hosting or managed cloud option
- Integration with Slack, Discord, and PagerDuty
- OpenTelemetry export for backend correlation
Pros
- Completely open-source and developer-friendly
- Lightweight SDK ideal for Angular SPAs
- Session replay gives strong UX context
- Transparent, usage-based pricing
Cons
- Expensive as usage grows
- Overwhelming UI for new users
Pricing
- Free: $0/month — includes 500 monthly sessions, up to 15 seats, and 7-day retention.
- Pay-as-you-go: starts at $50/month — up to 3 dashboards and 2 projects.
- Business: $800/month — unlimited projects, dashboards, and retention customization.
Highlight.io Angular Monitoring Pricing at Scale
For a company monitoring Angular applications at production scale, the Business Plan at $800/month provides full coverage — including session replay, JavaScript error tracking, and frontend performance data. Enterprise pricing scales based on session volume and retention period. For a large Angular app with ~5–10 million sessions/month and 30–60 day retention, the cost can be around ~$6,000.
Tech Fit
Highlight.io fits frontend-focused Angular teams that want deep visibility into user experience without enterprise licensing complexity. It’s ideal for startups, SaaS products, and open-source-driven organizations that value transparency, replay-based debugging, and cost-efficient Angular performance monitoring.
9. Dynatrace
Known For
Dynatrace is known for its AI-powered observability and automation platform that combines APM, infrastructure, RUM, and security monitoring. Its strength lies in automated dependency discovery and Davis AI, which identifies performance anomalies across complex architectures. For Angular monitoring, Dynatrace offers deep browser visibility with automatic instrumentation for frontend performance and route-level tracing.
Angular Monitoring Features
- Automatic instrumentation for Angular SPAs
- Real User Monitoring (RUM) and session analysis
- Core Web Vitals and frontend load time tracking
- JavaScript error grouping and diagnostics
- End-to-end tracing from Angular components to backend APIs
- Network request timing and resource waterfall visualization
- User session replay and conversion journey analysis
Key Features
- Davis AI engine for automatic root-cause detection
- Full-stack observability with Smartscape topology mapping
- Log management, APM, and RUM in a single platform
- Auto-discovery of microservices and dependencies
- Synthetic testing and SLA-based alerting
Pros
- Powerful AI-assisted performance insights
- Deep automation for tracing and topology visualization
- Excellent correlation between frontend and backend telemetry
- Enterprise-ready compliance and security monitoring
Cons
- High cost for ingest and enterprise licensing
- Can be complex to configure for smaller teams
Pricing
- Infrastructure Monitoring: $29/mo/host
- Full-Stack Monitoring: $58/mo/8 GiB host
Dynatrace Pricing at Scale for Angular Monitoring
A midsized SaaS company operating 125 APM hosts, 200 infra hosts, 10TB(~10,000 GB) of ingested logs, 300,000 custom metrics, 1,500,000 container hours, and 45,000GB of observability data out(charged by cloud provider), the cost would come around ~$21,850/month.
Tech Fit
Dynatrace fits enterprise-scale Angular environments where automation, AI-assisted analysis, and full-stack topology mapping are priorities. It’s best for teams managing distributed microservices and large user traffic that need predictive insight into frontend and backend performance.
Conclusion
Angular monitoring is essential for understanding real-user performance, not just backend uptime. While tools like Datadog, New Relic, and Grafana Cloud offer solid visibility, they often come with complex pricing or limited control.
CubeAPM delivers a simpler approach — combining OpenTelemetry-native tracing, real-user monitoring, and flat $0.15/GB pricing for full Angular visibility. It tracks Core Web Vitals, route transitions, and frontend errors, linking them seamlessly with backend traces.
For teams running modern Angular applications, CubeAPM offers the best balance of clarity, cost-efficiency, and control — making it a clear choice for scalable frontend observability.
Disclaimer: The information in this article reflects the latest details available at the time of publication and may change as technologies and products evolve.
FAQs
1. What is Angular monitoring used for?
Angular monitoring tracks frontend performance, JavaScript errors, and Core Web Vitals in real time. It helps developers understand how users experience their Angular applications and quickly detect issues that impact speed or reliability.
2. How do you monitor Angular application performance?
You can monitor Angular performance using Real User Monitoring (RUM) and distributed tracing tools like CubeAPM. These tools capture route transitions, API latency, and rendering time, giving full visibility from the browser to backend services.
3. What metrics should I track in Angular monitoring?
Key metrics include Largest Contentful Paint (LCP), First Input Delay (FID), Cumulative Layout Shift (CLS), route load time, and JavaScript error rates. Tracking these ensures your Angular app meets performance and UX benchmarks.
4. Is OpenTelemetry good for Angular applications?
Yes. OpenTelemetry (OTEL) provides a vendor-neutral way to collect and export frontend telemetry from Angular. Tools like CubeAPM natively support OTEL, allowing easy correlation between frontend spans and backend traces.
5. Why choose CubeAPM for Angular monitoring?
CubeAPM offers complete Angular visibility with OpenTelemetry support, smart sampling, and flat $0.15/GB pricing. It simplifies performance tracking, error monitoring, and user experience analysis — all without per-user or tiered fees.


