










Apache Flink powers real-time stream processing for thousands of organizations, from fraud detection pipelines at PayPal to recommendation engines at Alibaba. But monitoring Flink in production introduces challenges that generic APM tools miss: checkpoint alignment delays, backpressure propagation across operators, watermark lag at scale, and task manager restarts that cascade across jobs.
According to the CNCF Annual Survey 2023, 31% of organizations now use stream processing in production, yet most monitoring tools treat Flink like any other Java application, missing the streaming-specific signals that actually predict failures. When checkpoint duration spikes from 4 seconds to 40 seconds during a traffic surge, most platforms surface it as a generic latency increase. Flink-aware tools surface it as a checkpoint alignment bottleneck at operator X, caused by backpressure from downstream Kafka partition lag.
This guide compares 10 Flink monitoring tools across pricing models, deployment options, streaming metrics depth, and real operational complexity. Each tool is assessed on whether it actually understands Flink’s runtime behavior or just collects generic JVM metrics.
Quick Comparison: 10 Flink Monitoring Tools at a Glance
| Tool | Best For | Pricing | Flink-Native? | On-Prem? |
|---|---|---|---|---|
| CubeAPM | Self-hosted unified Flink + infra + logs | $0.2/GB ingestion | Strong | ✓ Yes |
| Datadog | Managed multi-cloud with 700+ integrations | $15/host/mo + $31/host APM | Moderate | ✗ SaaS only |
| Prometheus + Grafana | Open source, full control, DIY required | Free OSS | Strong with config | ✓ Yes |
| Dynatrace | Enterprise AI-driven root cause | $0.08/GiB + host-based | Moderate | ✓ Yes |
| New Relic | Full platform observability, per-user seat cost | $49-$99/user/mo or CCU-based | Moderate | ✗ SaaS only |
| Elastic APM | Teams already on ELK stack | Free OSS; Cloud from $95/mo | Moderate | ✓ Self-hosted |
| Instana | Auto-discovery, 1-second granularity | Custom pricing | Moderate | ✓ Hybrid |
| AppDynamics | Business transaction focus, Cisco stack | Custom pricing | Moderate | ✓ On-prem option |
| Splunk | Log-heavy enterprise SIEM + observability | $15/host/mo base + ingest fees | Weak | ✓ Yes |
| InfluxDB | Time series native, IoT + streaming use cases | Free OSS; Cloud from $50/mo | Strong with Telegraf | ✓ Yes |
Flink-native means the tool natively exposes Flink-specific metrics like checkpoint alignment time, records lag per partition, backpressure status, and watermark progression without requiring custom exporters or complex configuration.
1. CubeAPM
CubeAPM is a self-hosted observability platform covering APM, logs, infrastructure, and Flink-specific streaming metrics in one unified deployment. It runs inside your cloud or on-premises, keeping all Flink telemetry local with no data egress.
Key Features:
- Native OpenTelemetry and Prometheus integration for Flink metrics reporters
- Checkpoint duration, alignment time, and failure tracking at job and operator level
- Backpressure detection correlated with downstream Kafka lag and task manager resource saturation
- Watermark progression monitoring per source partition with lag visualization
- Task manager and job manager health dashboards showing GC pauses, heap usage, network buffer pool exhaustion
Pricing: $0.2/GB for all ingested metrics, logs, and traces. No per-host fees, no user seat limits. Self-hosted deployment on your infrastructure.
Pros:
- Full data residency, no telemetry leaves your VPC
- Unlimited retention with predictable flat pricing
- Correlates Flink metrics with application traces and infrastructure signals in one query
- Faster than cloud SaaS for high-cardinality Flink metric queries
Cons:
- Requires infrastructure provisioning and initial deployment setup
- Smaller third-party integration ecosystem compared to Datadog
Best for: Engineering teams running Flink on-premises or in regulated clouds (HIPAA, GDPR, SOC 2) who need unified observability without SaaS vendor lock-in or unpredictable egress costs.
2. Datadog
Datadog provides managed Flink monitoring through its APM and infrastructure products, with built-in integration for Flink’s Datadog metrics reporter. It offers broad ecosystem integrations and a mature alerting system.
Key Features:
- Pre-built Flink dashboard templates covering checkpoint metrics, task failures, and throughput
- Distributed tracing for Flink jobs when instrumented with Datadog APM agents
- Alerting on checkpoint duration, job restarts, and operator-level backpressure
- Native Kafka integration to correlate Flink consumer lag with upstream partition metrics
- Log aggregation from Flink task manager and job manager logs
Pricing: Infrastructure monitoring starts at $15/host/month. APM adds $31/host/month. Custom metrics beyond 100 per host cost extra. For a 50-node Flink cluster with APM enabled, monthly cost starts around $2,300 before logs or additional metrics.
Pros:
- Fully managed SaaS with no operational overhead
- Mature anomaly detection and composite alerting
- Strong ecosystem integrations with cloud providers and CI/CD tools
Cons:
- Per-host pricing compounds quickly for large Flink clusters
- Custom Flink metrics (per-partition watermarks, fine-grained backpressure) require instrumentation and add cost
- Data egress from VPC to Datadog’s SaaS at ~$0.09/GB on AWS, $0.12/GB on Azure
Best for: Teams already on Datadog for broader infrastructure monitoring who want to add Flink visibility without deploying another tool.
3. Prometheus + Grafana
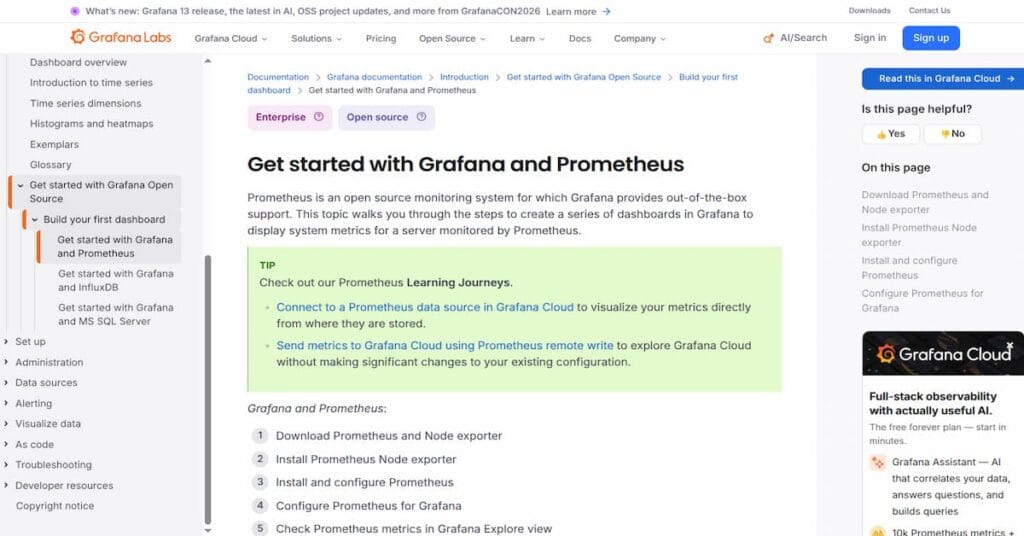
Prometheus with Grafana is the most common open source stack for Flink monitoring. Flink natively supports Prometheus via its built-in metrics reporter, and the community maintains comprehensive Grafana dashboards.
Key Features:
- Flink exports all metrics to the Prometheus endpoint without additional agents
- Community Grafana dashboards cover checkpoint latency, operator metrics, task manager resource usage, and job uptime
- PromQL queries enable custom alerting on Flink-specific thresholds
- Fully self-hosted with complete data control
- Horizontal scalability through federation and remote storage backends
Pricing: Free and open source. Infrastructure cost depends on retention volume and query load. For ~5TB/month Flink metrics with 30-day retention, expect $200-$400/month in compute and storage on AWS/GCP.
Pros:
- Zero software licensing cost
- Complete metric ownership and query flexibility
- Strong community support with extensive Flink dashboard examples
- No vendor lock-in
Cons:
- Requires manual setup of Prometheus scraping, Grafana provisioning, and alert rules
- High-cardinality metrics (per-partition watermarks, per-operator state size) can cause query performance issues without tuning
- No built-in distributed tracing or log correlation
- Operational burden for upgrades, scaling, and retention management
Best for: Teams with existing Prometheus/Grafana expertise who want full control and have engineering capacity to manage the stack.
4. Dynatrace

Dynatrace provides enterprise-grade Flink monitoring with AI-driven root cause analysis and automatic baseline learning for streaming metrics. It supports both SaaS and managed on-premises deployments.
Key Features:
- Automatic discovery and instrumentation of Flink jobs and dependencies
- AI-powered anomaly detection that learns normal checkpoint duration and backpressure patterns
- Distributed tracing across Flink operators and external services
- Real-time topology visualization showing data flow and bottlenecks
- Problem detection that correlates Flink slowdowns with infrastructure or downstream service issues
Pricing: Host-based licensing with full-stack monitoring at $0.08/GiB ingested plus host unit fees. For a 50-node Flink cluster processing 10TB telemetry/month, costs start around $6,000/month. Enterprise contracts include discounts.
Pros:
- Strong AI-driven root cause analysis reduces mean time to resolution
- Comprehensive full-stack visibility from Flink job to infrastructure to external APIs
- Mature alerting with low false positive rates
Cons:
- Expensive at scale compared to open source or ingestion-based pricing
- Steeper learning curve for teams unfamiliar with Dynatrace’s Davis AI and terminology
- Limited customization of Flink-specific dashboards compared to open source tools
Best for: Large enterprises running business-critical Flink pipelines who need automated root cause analysis and can justify the cost.
5. New Relic

New Relic offers Flink monitoring through its unified observability platform, supporting metrics, logs, and distributed tracing with Flink’s built-in integrations.
Key Features:
- Pre-built Flink quickstart with dashboards for checkpoint health, throughput, and resource usage
- NRQL queries for custom Flink metric analysis and alerting
- Distributed tracing when Flink jobs are instrumented with New Relic APM agents
- Log aggregation from Flink task managers correlated with metrics
- Alerting on checkpoint failures, job restarts, and watermark lag
Pricing: Per-user model at $49-$99/user/month (Standard to Enterprise) or consumption-based CCU pricing. For a 20-person team with moderate Flink telemetry ingestion, expect $7,000-$12,000/month. Verify current rates at New Relic’s pricing page.
Pros:
- Unified platform for Flink metrics, logs, traces, and infrastructure
- Strong query language (NRQL) for custom metric analysis
- Pre-built integrations with major cloud providers and Kafka
Cons:
- Per-user pricing penalizes larger engineering teams
- CCU model creates unpredictable bills during traffic spikes that increase telemetry processing
- NRQL lock-in makes migration difficult
- Cloud-only SaaS, no on-premises option
Best for: Teams already using New Relic for application monitoring who want to add Flink visibility without deploying another platform.
6. Elastic APM

Elastic APM (part of the Elastic Stack) provides Flink monitoring through Metricbeat and custom Elasticsearch indexing. It integrates naturally with teams already using Elasticsearch for logs or search.
Key Features:
- Metricbeat Flink module collects job metrics, task manager stats, and checkpoint data
- Custom Kibana dashboards for visualizing Flink performance over time
- Elasticsearch Query DSL for flexible metric analysis and aggregation
- Alerting through Kibana Watcher or Elasticsearch alerting rules
- Self-hosted or Elastic Cloud deployment options
Pricing: Free and open source for self-hosted Elastic Stack. Elastic Cloud hosted deployment starts at $95/month for small clusters. For production Flink monitoring with 5TB/month metric ingestion, expect $800-$1,500/month on Elastic Cloud.
Pros:
- Natural fit for teams already using ELK stack for logs
- Flexible schema and query capabilities through Elasticsearch
- Self-hosted option with full data control
- No per-host or per-user fees
Cons:
- Requires Elasticsearch expertise for schema design, retention management, and query optimization
- High-cardinality Flink metrics can cause indexing performance issues without careful field mapping
- Operational complexity managing Elasticsearch cluster scaling and upgrades
- Weaker out-of-the-box Flink dashboards compared to Prometheus/Grafana community templates
Best for: Teams already operating Elasticsearch who want to consolidate Flink metrics into their existing ELK stack.
7. IBM Instana
IBM Instana provides automated Flink monitoring with 1-second metric granularity and automatic dependency mapping across distributed Flink jobs and external services.
Key Features:
- Automatic discovery of Flink jobs, operators, and task managers without manual configuration
- Real-time streaming analytics with 1-second granularity for rapid incident detection
- Distributed tracing across Flink pipeline stages and external API calls
- Automatic baseline learning for checkpoint duration and throughput anomalies
- Dynamic graph visualization of Flink topology and data flow
Pricing: Custom enterprise pricing based on host count and feature set. Publicly disclosed estimates suggest $20-$40/host/month for full-stack monitoring. Contact Instana for current rates.
Pros:
- Fastest metric collection interval (1-second) among commercial tools
- Strong automatic dependency mapping reduces manual configuration
- Hybrid deployment supports both SaaS and on-premises
Cons:
- Premium pricing compared to open source or ingestion-based tools
- Less mature Flink-specific features compared to Prometheus or Datadog
- Smaller user community and fewer public integration examples
Best for: Enterprises needing sub-second monitoring granularity and automated service dependency mapping.
8. Splunk AppDynamics
AppDynamics (Cisco) offers Flink monitoring focused on business transaction visibility, linking streaming job performance to revenue-impacting workflows.
Key Features:
- Business transaction monitoring that traces Flink job latency to downstream user-facing APIs
- Automatic baselining and anomaly detection for Flink throughput and checkpoint metrics
- Code-level diagnostics when Flink jobs are instrumented with AppDynamics agents
- Correlated infrastructure metrics showing task manager CPU, memory, and network usage
- On-premises and SaaS deployment options
Pricing: Custom enterprise pricing, typically $50-$70/vCPU core/month for infrastructure monitoring plus application performance modules. Verify with AppDynamics sales.
Pros:
- Strong business transaction focus helps justify Flink performance investments to business stakeholders
- Mature enterprise support and professional services
- Hybrid deployment model
Cons:
- Expensive compared to alternatives, particularly for large Flink clusters
- Steeper learning curve and heavier agent overhead
- Weaker community support and public documentation for Flink-specific use cases
Best for: Cisco-standardized enterprises needing business transaction visibility tied to streaming job performance.
9. Splunk Observability Cloud
Splunk provides Flink monitoring primarily through log aggregation and custom metric indexing, with a stronger focus on security and compliance use cases than real-time streaming observability.
Key Features:
- Log aggregation from Flink task managers and job managers with full-text search
- Custom Splunk Processing Language (SPL) queries for metric analysis from JSON-formatted Flink logs
- Alerting on log patterns indicating checkpoint failures or job restarts
- Integration with Splunk’s SIEM capabilities for security-focused Flink deployments
- On-premises and cloud deployment options
Pricing: Infrastructure monitoring starts at $15/host/month. Data ingestion billed separately, typically $0.15-$0.25/GB depending on volume commitments. For a 50-node Flink cluster with 5TB/month log ingestion, expect $1,500-$2,000/month. Verify at Splunk’s pricing page.
Pros:
- Strong log search and correlation capabilities
- Mature SIEM integration for compliance-heavy environments
- Flexible SPL query language
Cons:
- Not purpose-built for streaming metrics, requires custom log parsing
- Expensive at scale for metric-heavy Flink monitoring
- Weaker real time visualization compared to time series databases
- Splunk Query Language creates vendor lock-in
Best for: Organizations already using Splunk for security monitoring who need basic Flink job visibility through log aggregation.
10. InfluxDB
InfluxDB is a time series database optimized for high-frequency metric ingestion, commonly used with Telegraf to collect Flink metrics via the Prometheus endpoint or JMX.
Key Features:
- Native time series storage optimized for Flink’s high-cardinality metrics
- Telegraf input plugin for Flink JMX metrics or Prometheus scraping
- InfluxQL and Flux query languages for custom metric analysis
- Grafana integration for visualization
- Self-hosted or InfluxDB Cloud deployment
Pricing: Free open source version. InfluxDB Cloud starts at $50/month for 30-day retention with usage-based pricing above free tier limits. For 5TB/month Flink metrics with 90-day retention, expect $600-$1,200/month on InfluxDB Cloud.
Pros:
- Purpose-built for time series data with efficient compression
- Strong performance for high-cardinality Flink metrics
- Flexible query languages (InfluxQL and Flux)
- Self-hosted option with full data control
Cons:
- Requires separate visualization tool (typically Grafana)
- No built-in distributed tracing or log correlation
- Operational complexity managing retention policies and shard management at scale
- Smaller Flink-specific community compared to Prometheus
Best for: Teams already using InfluxDB for IoT or time series workloads who want to consolidate Flink metrics into the same platform.
How to Choose the Right Flink Monitoring Tool
Selecting a Flink monitoring tool depends on four primary factors: deployment model requirements, existing stack familiarity, budget constraints, and streaming metrics depth needed.
Deployment Model: SaaS vs. Self-Hosted vs. Hybrid
If you have strict data residency requirements (HIPAA, GDPR, financial services compliance), self-hosted tools like CubeAPM, Prometheus, or Elastic APM keep all telemetry inside your infrastructure. SaaS tools like Datadog and New Relic require data egress, which adds ~$0.09-$0.12/GB in cloud transfer fees on top of vendor pricing.
Hybrid tools like Dynatrace and Instana offer both models but typically at premium pricing.
Streaming Metrics Depth: Generic JVM vs. Flink-Aware
Generic APM tools collect JVM heap usage, GC pauses, and thread counts but miss Flink-specific signals like checkpoint alignment time, per-operator backpressure status, and watermark lag per source partition.
Flink-aware tools (CubeAPM, Prometheus with Flink exporter, Datadog with Flink integration) surface these metrics natively. Without them, you’ll diagnose a 10-second checkpoint spike as “high CPU usage” instead of “backpressure from Kafka partition 7 causing checkpoint alignment timeout.”
Budget: Predictable vs. Variable Cost Models
Open source tools (Prometheus, InfluxDB) have zero software cost but require engineering time for setup, maintenance, and scaling. Budget $200-$800/month in infrastructure plus 0.25-0.5 FTE for operational ownership.
Ingestion-based tools (CubeAPM at $0.20/GB, Splunk at $0.15-$0.25/GB) offer predictable monthly bills. Per-host tools (Datadog at $15-$31/host, Dynatrace with host units) compound costs as Flink clusters scale horizontally during traffic surges.
Per-user tools (New Relic at $49-$99/user/month) penalize larger engineering teams. A 20-person team pays $11,880-$23,760 annually in seat fees before any data is ingested.
Existing Stack Integration
If your team already uses Grafana for infrastructure dashboards, adding Prometheus for Flink metrics requires minimal rework. If you’re standardized on Datadog for application monitoring, adding Flink visibility through Datadog’s integration avoids tool sprawl.
Conversely, if you have no existing observability stack, starting with a unified platform like CubeAPM or Elastic avoids the complexity of stitching together separate tools for metrics, logs, and traces.
Monitoring Flink with CubeAPM: Deployment and Metrics Coverage
CubeAPM provides unified Flink monitoring through native OpenTelemetry and Prometheus integration. It collects Flink’s built-in metrics via the Prometheus reporter, correlates them with application traces and infrastructure signals, and stores everything in a single queryable platform.
Setup Process
Enable Flink’s Prometheus metrics reporter in flink-conf.yaml:
metrics.reporter.prom.class: org.apache.flink.metrics.prometheus.PrometheusReporter
metrics.reporter.prom.port: 9249
Configure CubeAPM’s Prometheus scraper to collect from Flink job managers and task managers on port 9249. CubeAPM automatically discovers and labels metrics by job name, operator, and task manager host.
Key Metrics Surfaced
CubeAPM dashboards surface checkpoint duration per job, alignment time per operator, backpressure status propagated across the topology, watermark lag per source partition, task manager resource saturation (CPU, heap, network buffers), and job restart frequency with failure reasons.
Correlation with application traces shows how Flink job latency impacts downstream API response times. For example, if a Kafka source operator’s watermark lags by 2 minutes due to upstream partition lag, CubeAPM links that directly to increased API latency in services consuming Flink’s output.
Cost Comparison
For a 50-node Flink cluster generating 8TB/month of metrics, logs, and traces, CubeAPM costs $1,600/month ($0.20/GB × 8TB) with unlimited retention and no per-host or per-user fees. Datadog for the same workload would cost approximately $2,300/month in host fees plus custom metric charges. New Relic with a 20-person team would cost $11,880/year in seat fees before any telemetry is ingested.
Disclaimer: The information in this article reflects the latest details available at the time of publication and may change as technologies and products evolve. Features, pricing, and plan limits can change over time. Always verify the latest information directly with the vendor before making purchasing or deployment decisions.
Frequently Asked Questions
Is Apache Flink still relevant?
Yes. Apache Flink remains the leading open source stream processing framework in 2026, widely adopted for real time analytics, fraud detection, recommendation engines, and event driven architectures. According to the CNCF, 31% of organizations now use stream processing in production, and Flink’s stateful processing model with exactly-once guarantees makes it the default choice for mission-critical streaming workloads.
Does Netflix use Flink?
Netflix uses Flink for parts of its real time data processing infrastructure, particularly for anomaly detection and operational analytics. However, Netflix also heavily uses its own internally developed streaming systems. Flink is more prominently used at Alibaba, Uber, and LinkedIn for large-scale production streaming pipelines.
How to improve Flink performance?
Flink performance optimization focuses on reducing checkpoint duration, eliminating backpressure, and tuning parallelism. Key steps include increasing checkpoint interval to reduce overhead, enabling incremental checkpoints for large state, adjusting parallelism to match partition count, tuning buffer timeout and network buffer pool size, using RocksDB state backend for large state with async snapshots, and monitoring watermark progression to detect slow sources.
What is the AWS equivalent of Flink?
AWS offers Amazon Managed Service for Apache Flink (formerly Kinesis Data Analytics), which provides fully managed Flink runtime. Alternatively, AWS Kinesis Data Streams with AWS Lambda offers a serverless alternative for simpler stream processing use cases, though with fewer stateful processing capabilities than Flink.
What are the most important Flink metrics to monitor?
The five most critical Flink metrics are checkpoint duration (should stay below timeout threshold), checkpoint alignment time (indicates backpressure), number of failed checkpoints (reliability indicator), watermark lag per source partition (shows event time skew), and numRecordsInPerSecond per operator (throughput baseline). These metrics predict failures before they cascade across the job topology.