










FastAPI has become the framework of choice for building production APIs in Python. Its async-first design and automatic OpenAPI generation make it fast to build with and fast to run. But that speed advantage disappears the moment a memory leak, a slow database query, or a downstream service timeout quietly degrades performance in production. Without proper monitoring, you’re flying blind until users complain or revenue drops.
According to the Python Developers Survey 2024 by the Python Software Foundation and JetBrains, FastAPI is now the most popular web framework among Python developers, surpassing Django and Flask. That widespread adoption means more teams are hitting the same wall: FastAPI’s built-in /docs endpoint and basic logging are not enough once you’re handling real traffic, multiple services, and production incidents.
This guide compares 9 FastAPI monitoring tools across APM signal depth, pricing transparency, OpenTelemetry compatibility, and deployment model. Each tool is assessed on how well it handles distributed tracing, error tracking, request/response logging, performance metrics, and infrastructure visibility for FastAPI applications specifically.
Quick Comparison: 9 FastAPI Monitoring Tools at a Glance
| Tool | Best For | Pricing | OTel-Native? | On-Prem? |
|---|---|---|---|---|
| CubeAPM | Full-stack monitoring inside your cloud, cost-predictable | $0.20/GB, unlimited users | ✓ Native | ✓ Self-hosted |
| Prometheus + Grafana | Open source teams, custom metrics, DIY stacks | Free OSS | ✓ Strong | ✓ Self-hosted |
| Datadog | Enterprises needing breadth across cloud, APM, logs | $31/host/mo APM + add-ons | Partial | ✗ SaaS only |
| New Relic | Managed observability, AI-assisted analysis | $0.40/GB ingest, user seats $99+/mo | Partial | ✗ SaaS only |
| Elastic APM | Teams already on ELK, deep log correlation | Free OSS, Elastic Cloud from $99/mo | Partial | ✓ Self-hosted |
| SigNoz | OTel-first open source, self-hosted or cloud | Free OSS, Cloud $0.30/GB | ✓ Native | ✓ Yes |
| Apitally | FastAPI-specific, lightweight API analytics | Free tier, Pro from $49/mo | ✓ Native | ✗ SaaS only |
| Sentry | Error tracking, exception monitoring, alerts | Free tier, Team $29/mo+ | ✓ Strong | ✓ Self-hosted option |
| AppSignal | Developer-friendly APM, low-noise alerts | $79/mo for 5M requests | Partial | ✗ SaaS only |
Why FastAPI Applications Need More Than Basic Logging
FastAPI’s automatic logging via Uvicorn and Starlette middleware gives you request timestamps and status codes. But when a production incident happens, those logs don’t tell you:
Which downstream service caused the 500 error: In a microservices architecture, a single FastAPI endpoint might call three other services. Without distributed tracing, you can’t see which one timed out or returned a 500.
Why the same endpoint is fast for some users and slow for others: High-cardinality data like user IDs, tenant IDs, or API keys are usually stripped from logs for privacy. But without them, you can’t isolate which specific customer or account is experiencing degraded performance.
What database query is causing the bottleneck: FastAPI logs show you that /api/users/{user_id} took 2.3 seconds, but they don’t surface that the underlying PostgreSQL query did a full table scan because an index was missing.
When a memory leak started and which endpoint triggered it. Python’s garbage collector and async event loops can mask memory growth for hours. By the time your logs show MemoryErrorthe root cause is buried in traces from three hours earlier.
This is where application performance monitoring tools designed for distributed systems become essential. They correlate traces, metrics, logs, and errors across services, giving you the full context needed to debug FastAPI applications in production.
1. CubeAPM

CubeAPM is a self-hosted, OpenTelemetry-native observability platform covering APM, logs, infrastructure, Kubernetes, RUM, synthetic monitoring, and error tracking. It runs inside your cloud or on-prem, so there’s no data egress and no external dependency during incidents.
Key Features:
- Native OpenTelemetry support with automatic FastAPI instrumentation via
opentelemetry-instrumentation-fastapi - Distributed tracing with full context correlation across microservices
- High-cardinality trace search by endpoint, user ID, tenant, or any custom attribute
- Real-time error tracking with stack traces and contextual logs
- Infrastructure monitoring integrated with APM: see pod restarts, CPU throttling, and memory saturation alongside trace data
- Custom dashboards, alerting, and SLO tracking built in
Pricing: $0.20/GB ingested, all signals included. No per-user, per-host, or per-metric charges. Unlimited retention at the same rate.
Pros:
- Predictable pricing; single dimension means no surprise bills from user growth or host scaling
- Self-hosted deployment keeps telemetry data inside your infrastructure, critical for HIPAA, GDPR, or data residency requirements
- Works with OpenTelemetry, Datadog, New Relic, Prometheus agents; migration is incremental
- Engineering-level support via WhatsApp and Slack, not ticket queues
Cons:
- Requires BYOC or on-prem infrastructure; your team manages the compute and storage
- SSO/RBAC features less mature than enterprise SaaS platforms
- No autonomous anomaly detection; alerts are rule-based, not AIOps-driven
Best for: DevOps and platform teams that want full-stack observability inside their own cloud without SaaS data egress, pricing sprawl, or DIY self-hosting overhead.
2. Prometheus + Grafana
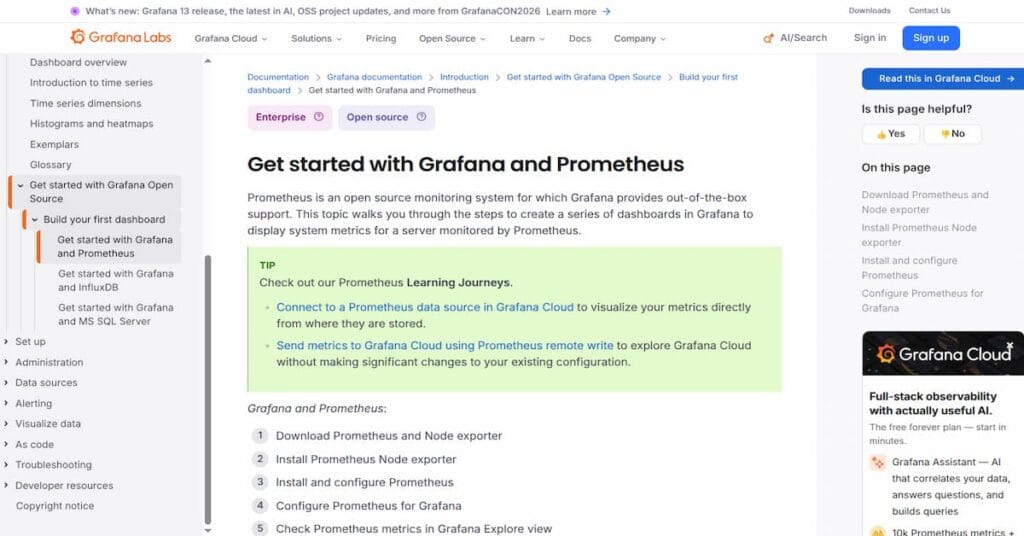
Prometheus collects metrics via HTTP scraping; Grafana visualizes them. This is the most common open-source monitoring stack for FastAPI applications, especially in Kubernetes environments.
Key Features:
prometheus-fastapi-instrumentatorlibrary provides RED metrics (Rate, Errors, Duration) out of the box- Native Kubernetes service discovery and scraping
- PromQL for flexible metric queries
- Grafana dashboards for visualization, alerting via Alertmanager
- Add Loki for logs, Tempo for traces to build a full observability stack
Pricing: Free, open source. Infrastructure costs vary; small teams can run on a single node; larger deployments need dedicated storage and high-availability clusters.
Pros:
- Zero licensing cost, full control over data
- Deep Kubernetes integration, widely used in cloud native stacks
- Massive community, thousands of pre-built dashboards on Grafana Labs
Cons:
- Requires significant operational effort; Prometheus HA, long-term storage (Thanos/Cortex), log aggregation (Loki), and trace backends (Tempo) are separate systems to deploy and maintain
- High-cardinality labels (like user IDs) cause cardinality explosions and performance issues
- No built-in distributed tracing; must integrate Tempo or Jaeger separately
- Alert fatigue is common without careful tuning
Best for: Teams with strong DevOps expertise who want full control and are willing to manage infrastructure complexity.
3. Datadog
Datadog is a fully managed SaaS observability platform with APM, infrastructure monitoring, logs, RUM, synthetics, and security monitoring. It has 700+ integrations and strong multi-cloud support.
Key Features:
- Automatic FastAPI instrumentation via
ddtracePython library - Distributed tracing with flame graphs and dependency maps
- Error tracking with stack traces linked to traces and logs
- Application Security Monitoring (ASM) for OWASP Top 10 detection
- Watchdog AI for anomaly detection and root cause suggestions
Pricing: APM costs $31/host/month for Pro tier (15-month retention). Infrastructure monitoring is $18/host/month. Logs are $0.10/GB ingested plus $1.70/million events indexed. Enterprise tier raises APM to $42/host/month with 15-month retention.
A 50-node FastAPI cluster ingesting 10TB of logs monthly costs approximately $1,550/month for APM, $900/month for infrastructure, and $5,700/month for logs, totaling $8,150/month before custom metrics or RUM.
Pros:
- Fully managed, no infrastructure to maintain
- Deep cloud integration (AWS, Azure, GCP) with automatic tagging
- Strong community and extensive documentation
- Watchdog AI reduces noise by surfacing anomalies automatically
Cons:
- Costs scale unpredictably; per-host pricing compounds with auto-scaling, and log indexing doubles storage costs
- SaaS-only deployment; no option for on-prem or VPC-hosted
- Proprietary agents and query language create lock-in
- Egress fees when sending data to Datadog can add ~$0.10/GB in AWS/GCP charges
Best for: Large enterprises with budget for managed services and need for breadth across cloud, security, and observability.
4. New Relic
New Relic offers a unified observability platform with APM, logs, infrastructure, RUM, synthetics, and error tracking. It uses a consumption-based pricing model called Compute Capacity Units (CCU).
Key Features:
- Automatic FastAPI instrumentation via
newrelicPython agent - Distributed tracing with service maps and transaction traces
- NRQL query language for custom analytics
- Applied Intelligence for anomaly detection and incident correlation
- Vulnerability Management and error inbox integrated
Pricing: Data ingest costs $0.40/GB after 100 GB free monthly. User seats range from $49/month (Standard) to $99/month (Pro) per user. A 20-person team ingesting 15TB monthly pays approximately $6,000/month for data plus $1,980/month for seats—totaling $7,980/month.
Pros:
- Single platform for all signals; no separate billing for logs, metrics, traces
- Strong AI-assisted root cause analysis
- Good Kubernetes and cloud native support
Cons:
- CCU billing model is opaque; hard to predict costs before you’re on the platform
- NRQL lock-in; dashboards and alerts are not portable to other tools
- Cloud-only deployment; no on-prem or VPC option
- Per-seat charges compound fast as teams grow
Best for: Teams already invested in New Relic who value unified billing and don’t need on-prem deployment.
5. Elastic APM
Elastic APM is part of the Elastic Stack (Elasticsearch, Logstash, Kibana). It provides distributed tracing, error tracking, and metrics alongside centralized log management.
Key Features:
elastic-apmPython agent with FastAPI support- Distributed tracing with service maps and transaction details
- Deep log correlation; traces link directly to logs in Kibana
- Machine learning for anomaly detection (X-Pack license required)
- Supports self-hosted or managed Elastic Cloud
Pricing: Open source version is free. Elastic Cloud Standard plan starts at $99/month for 60 GB RAM and 240 GB storage. Enterprise features (ML, RBAC, alerting) require paid licenses.
Pros:
- Full control with self-hosted deployment
- Excellent log correlation; traces, logs, metrics in one Kibana interface
- Strong community and ecosystem
Cons:
- Elasticsearch requires significant operational expertise; cluster tuning, index management, shard optimization
- High resource consumption at scale; Elasticsearch clusters can be expensive to run
- OpenTelemetry support is partial; Elastic APM agents use proprietary format
- Alert fatigue is common without careful threshold tuning
Best for: Teams already running Elasticsearch who want APM integrated with their log aggregation stack.
6. SigNoz
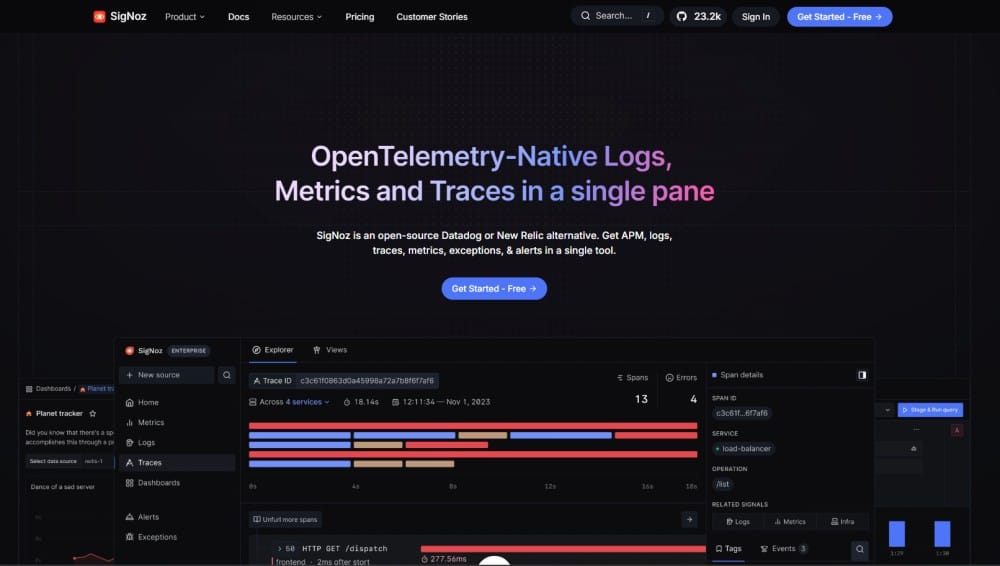
SigNoz is an open-source, OpenTelemetry-native APM platform. It offers self-hosted deployment or managed cloud, with APM, logs, and infrastructure monitoring built in.
Key Features:
- Native OpenTelemetry support; uses OTLP for all signals
- Distributed tracing with flamegraphs and dependency graphs
- Metrics and logs aggregation with ClickHouse backend
- Exceptions monitoring and error tracking
- Custom dashboards and alerting
Pricing: Open source is free. SigNoz Cloud costs $0.30/GB ingested, with a free tier of 1 GB/month. Teams edition adds SSO, SAML, and advanced RBAC.
Pros:
- OpenTelemetry-first design; no vendor lock-in, fully portable instrumentation
- Cost-effective compared to Datadog or New Relic
- Active open source community and transparent roadmap
- Self-hosted option gives full data control
Cons:
- Smaller ecosystem than Elastic or Datadog; fewer pre-built integrations
- Cloud offering is newer; less mature than incumbents
- ClickHouse backend requires tuning for high-cardinality workloads
- Documentation less comprehensive than commercial platforms
Best for: OpenTelemetry-first teams that want open source flexibility with option for managed cloud.
7. Apitally
Apitally is a specialized API monitoring tool built specifically for REST APIs. It integrates with FastAPI using lightweight middleware and focuses on API traffic, errors, and performance.
Key Features:
- FastAPI-specific middleware with automatic endpoint detection
- API traffic analytics and usage tracking per consumer
- Request/response logging with configurable PII filtering
- Uptime monitoring with synthetic checks
- Consumer identification and per-tenant analytics
Pricing: Free tier includes 10,000 requests/month. Pro plan starts at $49/month for 1 million requests. Custom pricing for higher volumes.
Pros:
- Extremely easy setup; add middleware, deploy, done
- Built specifically for REST APIs, not adapted from broader APM tools
- Request logging includes headers, body, and correlated application logs
- Consumer tracking helps identify which API clients cause issues
Cons:
- Narrow focus; no infrastructure monitoring, no Kubernetes visibility
- Not suitable for microservices architectures; tracks individual APIs, not distributed traces
- SaaS-only; no self-hosted option
- Limited alerting compared to full APM platforms
Best for: Small teams building FastAPI REST APIs who need simple usage analytics and error tracking without full observability complexity.
8. Sentry
Sentry is an error tracking and performance monitoring platform with strong support for Python and FastAPI. It captures exceptions, stack traces, and performance transactions.
Key Features:
- Automatic error capture with
sentry-sdk[fastapi]integration - Performance monitoring with transaction traces and spans
- Release tracking; correlate errors with deployments
- Issue grouping and prioritization by frequency and user impact
- Alerts via Slack, PagerDuty, and email with customizable thresholds
Pricing: Free tier includes 5,000 errors/month and 10,000 transactions/month. Team plan starts at $29/month for 50,000 errors. Performance monitoring adds $12/month per 100,000 transactions.
Pros:
- Best-in-class error tracking; intelligent grouping reduces noise
- Fast setup; under 10 minutes from install to first error capture
- Source map support for readable stack traces
- Self-hosted option available for data sovereignty
Cons:
- Performance monitoring is newer, less mature than dedicated APM tools
- No infrastructure monitoring; focused on application layer only
- Transaction volume pricing can scale unexpectedly with traffic spikes
- Not designed for distributed tracing across microservices
Best for: Teams that prioritize error tracking and want fast, reliable exception monitoring with optional performance insights.
9. AppSignal
AppSignal is a developer-friendly APM platform focused on low-noise alerting and fast issue resolution. It supports Python, Ruby, Elixir, Node.js, and front-end monitoring.
Key Features:
- Automatic FastAPI instrumentation with
appsignalPython package - Performance monitoring with slow query detection
- Error tracking with stack traces and contextual data
- Anomaly detection and smart alerting to reduce noise
- Host metrics and custom dashboards
Pricing: Standard plan costs $79/month for 5 million requests and 10 hosts. Scale plan starts at $199/month for 20 million requests and 25 hosts.
Pros:
- Clean, focused UI; easy to navigate and understand
- Low alert fatigue; anomaly detection surfaces real issues
- Good documentation and responsive support
- Transparent pricing with no hidden fees
Cons:
- OpenTelemetry support is partial; uses proprietary agent
- SaaS-only; no self-hosted deployment option
- Smaller ecosystem than Datadog or New Relic; fewer integrations
- Less suitable for large-scale distributed systems
Best for: Small to mid-size teams who want straightforward APM without operational complexity.
How to Choose the Right FastAPI Monitoring Tool
Selecting a monitoring tool depends on five key dimensions: deployment model, cost predictability, OpenTelemetry compatibility, signal depth, and operational overhead.
Deployment model: If you have data residency, HIPAA, or GDPR requirements, SaaS-only tools like Datadog and New Relic are non-starters. CubeAPM, SigNoz, Prometheus + Grafana, and Elastic APM all support self-hosted deployment. If managed services simplify operations and compliance is not a blocker, SaaS platforms reduce operational burden.
Cost predictability: Per-host pricing (Datadog, AppSignal) compounds with auto-scaling. Per-user pricing (New Relic) punishes team growth. Ingestion-based pricing (CubeAPM, SigNoz) is more predictable but requires estimating data volume. Open source tools (Prometheus + Grafana, Elastic) have zero licensing cost but significant infrastructure and operational overhead.
OpenTelemetry compatibility: Native OpenTelemetry support (CubeAPM, SigNoz, Prometheus) ensures portability; you can switch tools without re-instrumenting your application. Partial support (Datadog, New Relic, Elastic) means vendor lock-in through proprietary agents and data formats.
Signal depth: If you need distributed tracing, infrastructure monitoring, logs, RUM, and synthetics in one platform, full-stack tools (CubeAPM, Datadog, New Relic, Elastic) provide unified visibility. If you only need error tracking or API analytics, specialized tools (Sentry, Apitally) are simpler and cheaper.
Operational overhead: Managed SaaS platforms (Datadog, New Relic, AppSignal) eliminate infrastructure management but lock you into their architecture. Self-hosted platforms (CubeAPM, SigNoz) give control but require BYOC. Open source stacks (Prometheus + Grafana, Elastic) demand significant DevOps expertise to operate reliably at scale.
A decision matrix for common scenarios:
Small team (5-10 engineers), simple FastAPI API, limited budget: Start with Apitally or Sentry for error tracking, add Prometheus + Grafana if you need custom metrics.
Mid-size team (20-50 engineers), microservices, growing traffic: CubeAPM or SigNoz if you want cost-predictable, self-hosted observability. Better Stack or AppSignal if you prefer managed SaaS with straightforward pricing.
Large enterprise (100+ engineers), multi-cloud, compliance requirements: CubeAPM for self-hosted with predictable pricing. Datadog or Dynatrace if budget allows and cloud-only SaaS is acceptable.
Teams already on ELK stack: Elastic APM is the natural extension—logs, traces, metrics in one Kibana interface.
Teams prioritizing OpenTelemetry and portability: CubeAPM, SigNoz, or Prometheus + Grafana ensure you’re not locked into proprietary instrumentation.
Integrating OpenTelemetry with FastAPI
OpenTelemetry is the CNCF standard for observability instrumentation. It provides vendor-neutral APIs and SDKs for traces, metrics, and logs. For FastAPI, the opentelemetry-instrumentation-fastapi package adds automatic instrumentation with minimal code changes.
Basic OpenTelemetry setup for FastAPI:
from fastapi import FastAPI
from opentelemetry import trace
from opentelemetry.instrumentation.fastapi import FastAPIInstrumentor
from opentelemetry.sdk.trace import TracerProvider
from opentelemetry.sdk.trace.export import BatchSpanProcessor
from opentelemetry.exporter.otlp.proto.grpc.trace_exporter import OTLPSpanExporter
# Initialize tracer provider
trace.set_tracer_provider(TracerProvider())
tracer = trace.get_tracer(__name__)
# Configure OTLP exporter (works with CubeAPM, SigNoz, Grafana Tempo)
otlp_exporter = OTLPSpanExporter(endpoint="http://localhost:4317")
trace.get_tracer_provider().add_span_processor(BatchSpanProcessor(otlp_exporter))
# Create FastAPI app
app = FastAPI()
# Instrument FastAPI
FastAPIInstrumentor.instrument_app(app)
@app.get("/api/users/{user_id}")
async def get_user(user_id: int):
return {"user_id": user_id, "name": f"User {user_id}"}This setup automatically creates spans for every incoming request, including route, method, status code, and latency. It works with any OpenTelemetry-compatible backend: CubeAPM, SigNoz, Grafana Tempo, Jaeger, or Zipkin.
For custom spans to track specific operations like database queries or external API calls:
from opentelemetry import trace
tracer = trace.get_tracer(__name__)
@app.get("/api/orders/{order_id}")
async def get_order(order_id: int):
    with tracer.start_as_current_span("fetch_order_from_db"):
        # Database query here
        order = await db.fetch_order(order_id)

    with tracer.start_as_current_span("call_payment_service"):
        # External API call here
        payment_status = await payment_service.get_status(order.payment_id)

return {"order": order, "payment_status": payment_status}This produces a distributed trace showing the full request flow: FastAPI handler → database query → external API call, with latency for each span. CubeAPM, SigNoz, and other OpenTelemetry-native platforms automatically correlate these spans without additional configuration.
FastAPI Monitoring Best Practices
Instrument at multiple layers. FastAPI automatic instrumentation captures HTTP requests, but most production issues originate deeper: database queries, message queue consumers, background workers. Add custom spans for any operation taking over 100ms.
Track high-cardinality attributes carefully. User IDs, tenant IDs, and API keys are essential for debugging multi-tenant applications, but they cause cardinality explosions in metrics systems like Prometheus. Use traces for high-cardinality data, metrics for aggregated signals.
Correlate traces with logs. FastAPI applications typically use uvicorn or gunicorn for logging. Configure your logger to include trace IDs so every log line can be linked back to its originating request. OpenTelemetry logging instrumentation does this automatically.
Set up SLOs for critical endpoints. Define service level objectives (SLOs) for latency and error rate on business-critical endpoints. Alert when SLO burn rate accelerates, not just when a single request fails.
Monitor database query performance. Most FastAPI performance issues trace back to N+1 queries, missing indexes, or connection pool exhaustion. Use APM tools that surface query-level spans and highlight slow queries.
Test monitoring before incidents. Trigger intentional errors and latency spikes in staging to validate that alerts fire, traces capture root cause, and dashboards surface the issue quickly. If your monitoring doesn’t catch synthetic failures, it won’t catch real production incidents.
Use synthetic monitoring for uptime checks. Tools like infrastructure monitoring platforms provide synthetic monitoring to test critical endpoints from multiple regions every few minutes. This catches issues before customers report them.
Disclaimer: The information in this article reflects the latest details available at the time of publication and may change as technologies and products evolve. Features, pricing, and plan limits can change over time. Always verify the latest information directly with the vendor before making purchasing or deployment decisions.
Frequently Asked Questions
What is the best free monitoring tool for FastAPI?
Prometheus + Grafana is the most capable free option, providing metrics, dashboards, and alerting with full control over data. Sentry’s free tier (5,000 errors/month) works well for error tracking. For full APM, SigNoz open source is the best free self-hosted platform.
Do FastAPI applications need distributed tracing?
If your FastAPI app calls other services, databases, or external APIs, distributed tracing is essential. Without it, you can see that an endpoint is slow but not which downstream dependency caused the delay. Tools like CubeAPM, SigNoz, and Datadog provide distributed tracing automatically.
How much does Datadog cost for a FastAPI application?
Datadog APM costs $31/host/month for Pro tier. A 50-node FastAPI cluster costs $1,550/month for APM alone, before logs, infrastructure monitoring, or custom metrics. Log indexing adds $1.70/million events indexed. Total monthly cost for a mid-size deployment often exceeds $8,000.
Can I use OpenTelemetry with any monitoring tool?
Most modern tools support OpenTelemetry, but implementation quality varies. CubeAPM and SigNoz are OpenTelemetry-native and use OTLP directly. Datadog and New Relic support OpenTelemetry but prefer their proprietary agents. Prometheus works well with OpenTelemetry metrics but requires separate exporters.
What is the difference between APM and error tracking?
APM (Application Performance Monitoring) tracks latency, throughput, and resource usage across your application. Error tracking captures exceptions, stack traces, and failure context. Tools like Sentry focus on error tracking. Tools like CubeAPM and Datadog provide both in one platform.
How do I monitor FastAPI in a Kubernetes cluster?
Use OpenTelemetry instrumentation to send traces to a collector running as a DaemonSet or sidecar. Tools like CubeAPM, SigNoz, and Prometheus have native Kubernetes support with automatic pod discovery and correlation. Docker monitoring tools also work well for containerized FastAPI applications.
Does FastAPI monitoring affect application performance?
Minimal instrumentation overhead is typically under 5% CPU and memory. OpenTelemetry uses asynchronous exporters to avoid blocking application threads. Avoid excessive custom spans in hot paths—instrument only operations taking over 100ms.