










The OpenTelemetry Collector sits between every instrumented application and the observability backend that stores the data. It receives telemetry, processes it, and routes it wherever it needs to go, which makes it one of the most important pieces of infrastructure a team never talks about until something breaks.
And something usually does break. A Collector configuration that runs cleanly in a demo often buckles under real production traffic. Memory climbs, spans get refused, and the failure stays invisible until an incident hits and the exact traces needed are simply missing.
None of this is unpredictable. A production-grade Collector setup follows a known pattern, and getting the ordering, the queuing, and the self-monitoring right up front prevents most of what catches teams off guard. Adoption backs up how seriously teams now take this. According to OpenTelemetry’s survey, 65 percent of teams now run more than 10 Collector instances in production, up sharply from the year before.
This guide covers what a production OpenTelemetry Collector setup actually requires: architecture, deployment patterns, a working pipeline configuration, scaling, security, and the failure modes that catch unprepared teams before they know what hit them.
What Is the OpenTelemetry Collector?
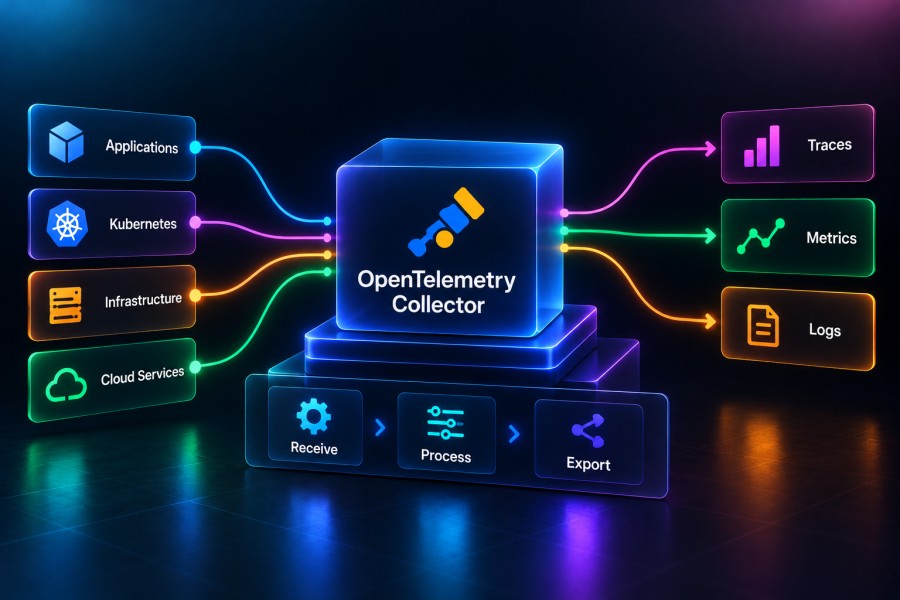
The OpenTelemetry Collector is a standalone, vendor-neutral service that sits between instrumented applications and the observability backend. It receives telemetry data, processes it in flight, and exports it to one or more destinations, decoupling how data gets collected from where it eventually ends up.
That decoupling is the entire point. Applications send telemetry to the Collector once, and the Collector decides what happens next, filtering, enriching, and routing to multiple backends, without any of that logic living inside the application code itself. Change a backend, adjust a sampling rule, or add a second destination, and none of it touches a single service’s instrumentation.
Receivers, processors, and exporters: How data moves through the OTel Collector
Telemetry moves through the Collector in one fixed order, and that order matters more than most people assume when they first start configuring pipelines.
- Receivers accept incoming data, OTLP being the most common, though the Collector supports dozens of other formats through contrib receivers
- Processors transform that data in flight, batching it, filtering it, adding or stripping attributes, before it goes anywhere
- Exporters send the processed data onward to one or more backends
Extensions support the Collector, not the data
Extensions sit outside the pipeline entirely. They don’t touch telemetry data; they support the Collector’s own operation.
- health_check exposes a readiness and liveness endpoint, essential for Kubernetes to know whether the Collector is actually functioning
- zpages provides in-process debugging pages, useful when a pipeline is misbehaving, and you need visibility into what the Collector is doing internally, right now, without waiting on external metrics to catch up
Core vs contrib vs custom distributions: Choosing a distribution
The OpenTelemetry project ships more than one distribution, and picking the wrong one is a common early mistake.
- Core includes only the most essential components, and it is genuinely too minimal for most real production pipelines. It lacks components like tail_sampling and k8sattributes that most teams end up needing almost immediately
- Contrib bundles in the broader ecosystem of community-maintained receivers, processors, and exporters, and it is the practical default most teams should start with
- A custom build, assembled through the OpenTelemetry Collector Builder, makes sense once a configuration has stabilized and a team wants to ship a binary containing only the components it actually references, trimming attack surface and binary size at the same time
Starting on contrib and narrowing down later, once real usage patterns are clear, tends to work better than trying to predict a custom build’s requirements on day one.
Agent vs Gateway: Choosing a Deployment Pattern
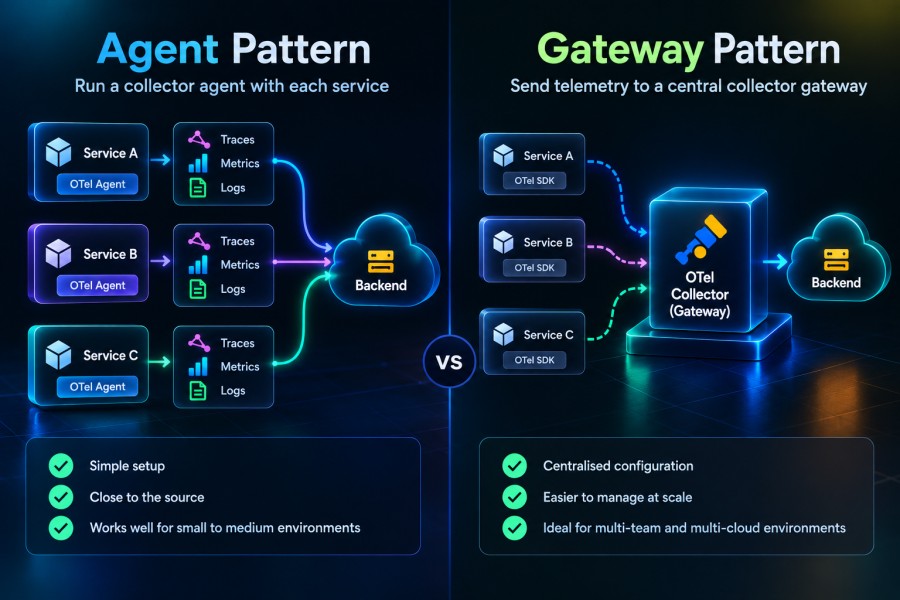
Once the architecture makes sense, the next decision is where the Collector actually runs. This is one of the first choices a team gets wrong, usually by picking one pattern when the situation calls for both.
Agent mode
An agent-mode Collector runs close to the workload, typically deployed as a DaemonSet so every node in a Kubernetes cluster gets its own instance.
- Sits right next to the application, keeping network hops and latency minimal
- Handles local enrichment well, attaching host metadata and node-level context before data leaves the machine
- Scales naturally with the cluster, since a new node automatically gets its own Collector instance
Gateway mode
A gateway-mode Collector runs centrally, aggregating telemetry from many sources before doing anything heavier with it.
- Better suited to processing that needs a broader view, tail sampling being the clearest example, since it requires seeing every span of a trace before deciding whether to keep it
- Acts as a single point for backend routing and credential management, instead of every agent instance needing its own export configuration
- Easier to scale independently from application workloads, since gateway capacity depends on telemetry volume, not node count
Why most production setups use both
Treating this as an either-or choice is where a lot of deployments go wrong. The pattern that actually holds up at scale is agents at the edge, feeding a centralized gateway tier, and this is the deployment model OpenTelemetry itself recommends for larger environments.
The division of labor between the two tiers is straightforward once you see it laid out:
- Agents handle local collection and lightweight enrichment, right where the data originates
- The gateway handles the heavier lifting, tail sampling, final routing, and backend-specific processing, all centralized in one place instead of duplicated across every node
What deployment data shows
Deployment patterns back up how dominant this combination has become, and where it is spreading.
- Kubernetes remains the primary deployment target at 81 percent, largely unchanged year over year
- VM-based deployment jumped sharply from 33 to 51 percent over the same period, according to OpenTelemetry’s survey
That VM growth is worth noting specifically. It means the agent and gateway pattern is no longer a Kubernetes-only concern. Teams running mixed infrastructure need the same two-tier thinking regardless of what is running underneath it.
A Production-Grade Pipeline Configuration
Architecture and deployment decisions only get a team halfway there. The actual pipeline configuration is where most production incidents originate, and it is almost never a receiver misconfiguration or an exotic edge case. It is a handful of predictable, well-documented mistakes that keep repeating across teams that skipped this step. This section builds one complete, working pipeline, piece by piece, so every decision is visible rather than buried in a config file nobody fully understands six months later.
Why memory_limiter has to come first
There is exactly one processor ordering mistake that causes more production outages than every other Collector misconfiguration combined, and it is putting memory_limiter anywhere but first.
What happens without it
Traffic spikes, maybe a deploy goes out, maybe it is just Friday afternoon, and nobody planned for the load.
- The Collector keeps accepting everything coming in, because nothing told it not to
- Memory climbs past what the container was allocated
- Kubernetes notices and kills the process outright, mid-pipeline, with whatever was buffered simply gone
- Every service exporting through that Collector instance loses visibility at exactly the moment an incident is most likely to be happening
What memory_limiter changes
Placed first in the pipeline, before batch, before anything else touches the data, it watches the Collector’s own memory usage and intervenes before Kubernetes has to.
- Refuses new data at the receiver level once a threshold is crossed
- That refusal shows up as refused spans in the Collector’s internal metrics, loud and visible
- A team seeing refused spans knows exactly what happened and can act on it, unlike a silent OOM kill that only surfaces as a gap in the dashboards afterward
Configuring it correctly
The processor uses two thresholds rather than one, and getting the relationship between them right matters as much as enabling the processor at all.
- limit_mib sets the hard memory ceiling the processor enforces, and this should sit close to, but under, the container’s actual memory limit, leaving room for memory the processor itself can’t see
- spike_limit_mib defines how far below that hard limit the soft limit sits. Once usage crosses the soft limit, the processor starts refusing data and forcing garbage collection before the hard limit is ever reached
- Alongside the processor, OpenTelemetry’s own documentation recommends setting the GOMEMLIMIT environment variable as well, to 80 percent of limit_mib specifically. GOMEMLIMIT controls the Go runtime’s own garbage collection behavior, and running memory_limiter without it means the processor is doing this job alone when the runtime could be helping
Both settings, memory_limiter and GOMEMLIMIT, are described as necessary together, not as alternatives to each other. A production Collector should never ship with only one of them configured.
Tuning the batch processor without guessing
Once memory protection is in place, batching is what makes the Collector efficient rather than merely functional. Every export call carries fixed overhead: connection setup, serialization, network round trip, and sending telemetry one record at a time multiplies that overhead by however many records exist.
The tuning question that trips up most teams is not whether to batch; it is how large a batch should get before it is sent. Two settings control this, and they work against each other by design:
- send_batch_size caps how many records accumulate before triggering an export, giving predictable batch sizes under steady, high-volume traffic
- timeout forces an export after a fixed duration even if the batch never fills, which matters for low traffic services that would otherwise sit waiting for a batch that never completes
Getting this balance wrong produces two different symptoms from the same root cause:
- Batch size too high, paired with a generous timeout, means a quiet service holds telemetry in memory for uncomfortably long stretches, which shows up as delayed data during an investigation exactly when someone needs it now
- Batch size too low defeats the purpose of batching entirely, generating almost as much per-record overhead as no batching at all, with extra processing layered on top for no real gain
A sensible starting point for most production traffic is an 8192 record batch size with a 5 second timeout, then adjust based on what the Collector’s own export latency metrics show once real traffic is flowing through it. Guessing at these numbers up front rarely lands right. Watching them under real load and adjusting does.
What actually happens to data during a backend outage
This is the part of the pipeline configuration that gets treated as an afterthought, and it is the one most likely to cause a quiet, undetected data loss incident rather than a loud one.
Backends go down. Not often, but production runs long enough that it eventually happens, and the question that matters is what the Collector does with telemetry arriving during that window. Without the right exporter settings, the answer is simple and unforgiving: it gets dropped, immediately, with no attempt to hold onto it until the backend recovers.
Two settings change that outcome:
- sending_queue gives the exporter a buffer to hold data in while a backend is slow or unreachable, rather than failing the export attempt the instant something goes wrong
- retry_on_failure layers backoff-based retries on top of that queue, so a failed export attempt gets tried again, with increasing delay between attempts, instead of being abandoned after one failure
Neither setting alone is enough for a backend outage lasting more than a few seconds, which is where persistent queuing earns its place:
- A queue backed only by memory disappears the moment the Collector process restarts, whether that restart comes from a deploy, a crash, or a node eviction
- A queue backed by disk storage, through the file_storage extension, survives that restart, so data sitting in the queue when the Collector goes down is still there, waiting to export when it comes back up
The complete pipeline
Here is what all three pieces look like combined into one working traces pipeline, the configuration this guide treats as the production floor, not the ceiling:
receivers:
  otlp:
    protocols:
      grpc:
      http:

processors:
  memory_limiter:
    check_interval: 1s
    limit_mib: 1600
    spike_limit_mib: 400
  batch:
    timeout: 5s
    send_batch_size: 8192

exporters:
  otlp/backend:
    endpoint: "backend-endpoint:4317"
    sending_queue:
      enabled: true
      storage: file_storage
    retry_on_failure:
      enabled: true
      initial_interval: 5s
      max_interval: 30s

extensions:
  file_storage:
    directory: /var/lib/otelcol/queue

service:
  extensions: [file_storage]
  pipelines:
    traces:
      receivers: [otlp]
      processors: [memory_limiter, batch]
exporters: [otlp/backend]For a container with a 2Gi memory limit, this pairs with a GOMEMLIMIT environment variable set to roughly 1280MiB, 80 percent of the 1600 MiB limit_mib value above, set alongside the Collector’s container spec rather than inside this YAML.
Every line here earns its place, and the order they appear in is not incidental.
- Memory protection comes first because nothing else matters if the Collector is dead
- Batching comes second because efficiency only matters once stability is handled
- The exporter queues and retries instead of dropping the moment a backend hiccups, because a pipeline that loses data silently during the exact window an incident is happening has already failed at its one job
This is the baseline a production pipeline should never fall below, regardless of whatever gets layered on top of it as requirements grow.
Scaling the Collector Horizontally
A single Collector instance has a ceiling, and most teams find it the hard way, watching queue metrics climb during a traffic spike rather than planning capacity ahead of time. Knowing what to watch for, and how tail sampling changes the scaling calculus entirely, separates a Collector tier that scales cleanly from one that becomes a bottleneck the moment traffic doubles.
Signs a single instance has stopped being enough
Scaling decisions should be driven by the Collector’s own internal metrics, not by guesswork or a fixed traffic threshold picked in advance.
- Sustained growth in otelcol_exporter_queue_size relative to its configured capacity, indicating the exporter cannot keep pace with incoming volume
- A rising rate of otelcol_receiver_refused_spans, meaning memory_limiter is actively rejecting data rather than an occasional, expected blip
- Export latency climbing steadily rather than settling back down after a traffic spike passes
Any one of these sustained over time, not a brief spike during a deploy, is the signal to add capacity rather than tune existing settings further.
Why tail sampling changes the scaling math
Head sampling, deciding whether to keep a trace at the moment the first span arrives, scales horizontally without complication. Any Collector instance can make that decision independently, since it never needs to see the rest of the trace.
Tail sampling works differently, and it is where naive horizontal scaling breaks.
- Tail sampling decides whether to keep a trace only after seeing every span belonging to it, including the error or the slow span that made the trace worth keeping in the first place
- If spans from the same trace land on different Collector instances, no single instance has the complete picture needed to make that decision correctly
- Scaling a tail sampling tier requires a load balancing exporter upstream, routing all spans for a given trace ID to the same downstream Collector instance, consistently, regardless of which instance received them first
Skipping this step while running tail sampling does not cause an obvious failure. It causes a subtler one, incomplete or incorrectly sampled traces, which tends to surface only when someone goes looking for a specific trace during an incident and can’t find the full picture.
Kubernetes HPA considerations specific to the Collector
Horizontal Pod Autoscaling works well for the Collector, but applying default assumptions built for typical request-driven services tends to produce a poorly tuned autoscaler.
- CPU-based scaling alone is often a weak signal, since Collector CPU usage does not always track telemetry volume the way a web service’s CPU tracks request volume
- Custom metrics based on queue depth or export latency, scraped from the Collector’s own Prometheus endpoint, produce a far more accurate scaling signal than CPU utilization alone
- Scale-down behavior needs its own care, since terminating a Collector instance mid-export, without allowing its queue to drain first, reintroduces exactly the data loss the queuing configuration was built to prevent
A Collector tier that scales on the right signals, respects trace affinity where tail sampling requires it, and drains gracefully on scale-down handles a traffic spike as a routine event instead of an incident.
Securing the Collector in Production
Security here rarely gets the attention pipeline tuning does, and it’s not hard to see why. A misconfigured pipeline fails loudly, dropping spans in a way that shows up in a dashboard within minutes. A security gap doesn’t fail at all. It just sits there, quietly, until something finds it.
The hop teams forget to encrypt
Most teams secure the connection between the application and the Collector without much thought, since it’s the obvious one. What gets missed more often is everything downstream of that first hop.
TLS needs to cover both directions, receivers accepting data and exporters sending it onward, not just the inbound side. For deployments where the network between services isn’t fully trusted, which describes most production Kubernetes clusters running multiple namespaces or tenants, mTLS is worth the added setup effort. Mutual authentication on both ends closes a gap that one-directional TLS leaves open.
A gateway-mode Collector is where this tends to slip through unnoticed. Securing the agent-to-application hop feels complete, and the agent-to-gateway hop, aggregating traffic from dozens of agent instances, gets treated as implicitly trusted internal traffic. It shouldn’t be.
Running with the least access it needs
The Collector process should carry no more privilege than its job strictly requires. A few habits enforce that in practice.
- Run as a non-root user, removing an entire class of privilege escalation risk if the process is ever compromised
- Mount configuration files read-only, so a compromised process cannot rewrite its own pipeline to disable protections like memory_limiter or quietly exfiltrate data
- Keep credentials and API keys in Kubernetes secrets or a dedicated secrets manager, never as plaintext values sitting inside the Collector’s own YAML
RBAC scope in Kubernetes specifically
The Collector’s service account deserves the same scrutiny any other workload’s would get, and it often doesn’t receive it.
What it needs depends entirely on what it’s doing. A Collector purely receiving OTLP over the network needs a narrow set of permissions. One scraping Kubernetes events for enrichment needs a different, broader set, and that difference should be reflected explicitly in its RBAC configuration rather than granted as one generic, overly permissive role applied to every Collector in the cluster.
Cluster-wide read access as a default is the mistake worth naming directly. It’s convenient, it avoids permission errors during setup, and it turns a compromised Collector into a far more valuable target than it needed to be. RBAC scope isn’t a set-and-forget decision either. Every time a new receiver or processor gets added to a pipeline, permission requirements shift, and the service account’s scope should be revisited alongside that change, not left as whatever was granted on day one.
None of this replaces the reliability work covered earlier in this guide. A Collector that queues, retries, and protects its own memory under load is still a liability if it’s running with more access than it needs and trusting every connection by default.
Common Production Failures and the Metrics That Catch Them
Most Collector incidents trace back to one of a small number of recurring failure patterns. Knowing the specific internal metric that reveals each one, before it turns into a missing trace during an actual incident, is the difference between catching a problem early and finding out about it during a postmortem.
- Undersized Collector: The Collector cannot process and export data as fast as it arrives, usually after traffic grows past whatever the instance was originally sized for. Watch otelcol_receiver_refused_spans for a sustained, non-zero rate, which signals memory_limiter is actively rejecting incoming data rather than the Collector quietly keeping up.
- Exporter queue overflow: Data enters the export queue faster than the exporter can drain it to the backend, usually during a backend slowdown or a sudden traffic spike. Watch otelcol_exporter_enqueue_failed_spans, since a rising rate here means spans are failing to even enter the queue before retry logic gets a chance to run.
- Backend slow or unreachable: The exporter is retrying against a backend that isn’t responding in time, and the buffer meant to absorb that slowdown is running out of room. Watch otelcol_exporter_queue_size against its configured otelcol_exporter_queue_capacity, since utilization approaching that ceiling means queue overflow, and outright data loss, is close behind.
- Missing memory limits: No memory_limiter processor, or one placed anywhere but first in the pipeline, leaves the Collector with no defense against a traffic spike. Kubernetes eventually intervenes with an OOM kill, and unlike a refused span, an OOM kill takes the entire pipeline down at once, with no warning metric preceding it.
Production usage backs up how common these problems actually are. According to OpenTelemetry’s own survey, 83 percent of respondents already run OpenTelemetry in production, yet debugging Collector configuration and exporter failures was named among the most common pain points reported.
That statistic matters more than it first appears to. Most teams running the Collector in production are still fighting configuration and failure visibility, not the concept of collecting telemetry itself. A Collector that silently drops data is worse than no Collector at all, because it creates false confidence in dashboards built on data that never actually arrived. Alerting directly on the four metrics above, rather than waiting to notice a gap during an incident, is what turns that risk into a routine, catchable event instead of a surprise.
Where CubeAPM Fits Into a Production Collector Setup
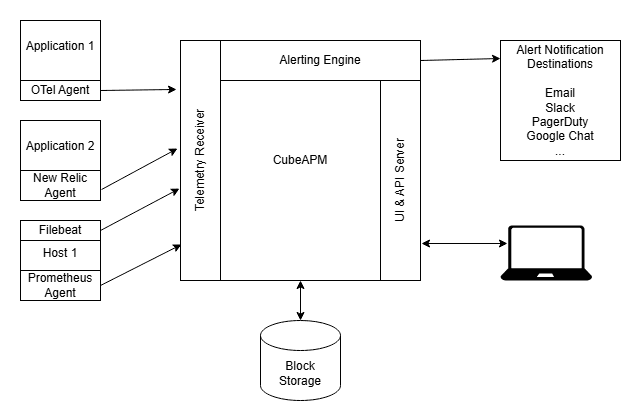
Everything covered so far concerns the Collector itself, how it processes and protects telemetry in flight. The final connection matters just as much. A pipeline is only as clean as the backend receiving its output.
What the backend adds to the exporter block
An exporter configuration is only as simple as the backend allows it to be, and that varies more than teams expect until they’ve configured both kinds.
- A backend accepting OTLP natively needs nothing more than a standard otlp exporter block, the same one used throughout this guide
- A backend requiring a proprietary exporter, or translating OTLP into its own internal format on ingest, adds an extra dependency and an extra point of failure to every pipeline sending data to it
- That extra component sits exactly where this guide spent an entire section preparing for failure: the exporter, which means it inherits every risk covered in the queuing and retry discussion earlier, plus one more moving part
How CubeAPM connects
CubeAPM ingests traces, metrics, and logs natively over OTLP. A Collector configured using the patterns in this guide connects to it directly:
- memory_limiter first, protecting the Collector regardless of backend
- Batching tuned to the actual traffic pattern
- A queued, retrying otlp exporter, with no vendor-specific plugin and no translation layer in between
Why this is worth checking regardless of backend
This distinction applies to any backend under evaluation, not only this one. It determines whether the exporter block stays as simple as the rest of this pipeline, or becomes one more component that can silently fail during exactly the kind of backend slowdown this guide has spent several sections preparing for.
Conclusion
The Collector is critical infrastructure. The gap between a demo setup and a production one comes down to a handful of decisions: memory protection first, queuing that survives a backend outage, scaling that respects trace affinity, and metrics watched before an incident forces the issue.
Get those right, and a traffic spike becomes a routine Tuesday instead of a missing trace during a postmortem.
If your Collector is already configured this way, the next question is whether your backend is holding up its end. CubeAPM ingests OTLP natively, so the pipeline you just built connects to it without adding one more thing that can quietly fail.
FAQ
Should I use the OpenTelemetry Collector or export directly from my SDK?
Direct export works fine for a single service or a small, low-volume setup. Once you’re running multiple services, need centralized sampling or filtering, or want your telemetry to survive a backend outage, the Collector earns its place.
What is the difference between agent and gateway mode in the OpenTelemetry Collector?
An agent runs close to the workload, usually as a DaemonSet, handling local collection and enrichment. A gateway runs centrally, aggregating data from many agents and handling heavier processing like tail sampling before export.
Why does the OpenTelemetry Collector drop data in production?
Usually one of a few causes: an undersized instance that can’t keep pace with volume, a slow or unreachable backend without proper queuing, or a missing memory_limiter processor letting Kubernetes OOM-kill the process outright.
How do I scale the OpenTelemetry Collector for high traffic?
Scale on queue depth and export latency from the Collector’s own metrics, not CPU alone. If you’re running tail sampling, add a load balancing exporter first, so spans from the same trace land on the same instance.
Which OpenTelemetry Collector distribution should I use in production?
Contrib is the practical default, since core lacks components most production pipelines need. Move to a custom build through the OpenTelemetry Collector Builder once your configuration has stabilized and you want a leaner binary.
Disclaimer: This guide reflects OpenTelemetry Collector configuration options, defaults, and survey statistics as of the publish date. Verify current settings and version behavior against OpenTelemetry’s official documentation before deploying to production.