










Retrieval-Augmented Generation (RAG) pipelines introduce latency and cost at every stage: embedding generation, vector search, context augmentation, and LLM generation. Without monitoring, you cannot tell whether a slow response is caused by a vector database query taking 800ms, an embedding model taking 600ms, or the LLM itself taking 3 seconds.
This guide covers what to monitor in RAG pipelines, how to measure latency at each stage, how to track retrieval quality and cost, and which tools simplify observability for production RAG systems.
What Is Monitoring for RAG Pipelines?
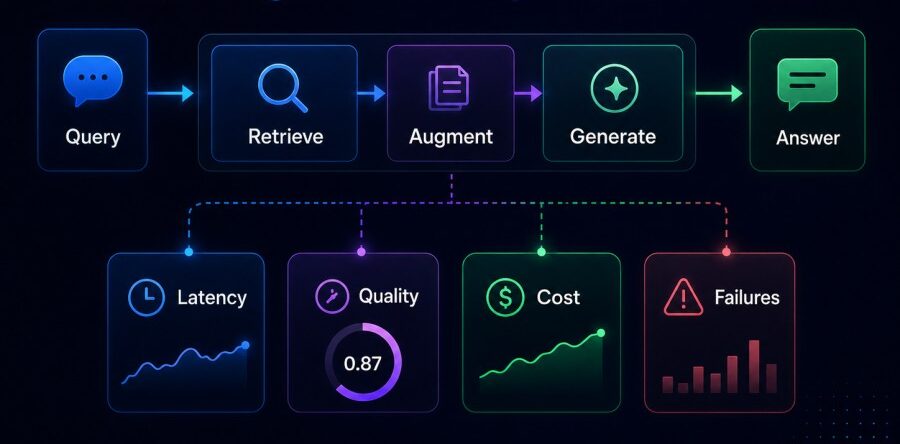
Monitoring for RAG pipelines is the practice of tracking latency, cost, retrieval quality, and error rates across the four core stages of a RAG workflow: embedding generation, vector search, context augmentation, and LLM generation. The goal is to identify bottlenecks, detect quality degradation, and control cost before they impact end users.
RAG pipelines are fundamentally different from traditional application monitoring. A typical API request has a single execution path. A RAG query has four sequential stages, each with different performance profiles, cost drivers, and failure modes. Embedding generation might take 200ms for a small query but 800ms for a long question. Vector search latency depends on index size, number of vectors, search parameters (top-k, filters), and whether the database supports hybrid search. Context augmentation involves token counting and prompt assembly, which can silently exceed LLM context windows if not tracked. LLM generation latency varies by model size, prompt complexity, and load on the API endpoint.
Without stage-specific monitoring, a 5-second response time is an unactionable alert. With it, you know exactly where the time went: 300ms embedding, 150ms vector search, 50ms augmentation, 4.5 seconds LLM generation. That clarity makes optimization possible.
How RAG Pipeline Monitoring Works
Monitoring a RAG pipeline requires instrumenting each of the four stages to capture latency, cost, and quality signals. The standard approach is to use OpenTelemetry tracing to create a parent span for the full query and child spans for each stage. Every span records start time, end time, and stage-specific attributes like model name, token count, vector count, or database query parameters. The result is a trace that shows the full request timeline and makes bottlenecks visible.
The Four Stages and What to Measure
Embedding generation converts the user query into a vector. Measure embedding model name, input text length, token count, vector dimensions, latency, and whether the call succeeded. Track whether you are calling an external API (OpenAI, Cohere) or running a local model (Sentence Transformers, FastEmbed). External API calls add network latency and API rate limits. Local models add infrastructure cost and GPU utilization.
Vector search queries the vector database to find the most similar documents to the query embedding. Measure database type (Pinecone, Weaviate, Qdrant, Chroma, pgvector), index size, search type (cosine, dot product, Euclidean), top-k parameter, filter conditions, number of results returned, search latency, and whether the search succeeded. Track whether results include the documents you expect. Low-quality retrieval often shows up as searches returning irrelevant documents or missing known-relevant content.
Context augmentation assembles the retrieved documents into a prompt for the LLM. Measure number of documents retrieved, total token count of retrieved context, final prompt token count, whether the prompt fits within the LLM’s context window, and deduplication or re-ranking applied. If the prompt exceeds the context window, the LLM call fails or silently truncates context. That failure mode is invisible without token-level monitoring.
LLM generation sends the augmented prompt to the language model and returns the response. Measure model name, prompt tokens, completion tokens, total tokens, cost per token, total cost, latency (time to first token and total generation time), and whether the response was successful. Track temperature, top-p, max tokens, and any sampling parameters. These affect cost and output quality.
Distributed Tracing for RAG Queries
The cleanest way to instrument a RAG pipeline is with OpenTelemetry. You create a parent trace for the full user query and child spans for each stage. Each span captures stage-specific attributes as span tags. The trace shows the full query timeline in a single view. If vector search takes 800ms and LLM generation takes 4 seconds, the trace makes that visible immediately.
Here is what a minimal instrumented RAG query looks like:
from opentelemetry import trace
tracer = trace.get_tracer("rag-pipeline")
def query_rag(user_query: str):
    with tracer.start_as_current_span("rag.query") as query_span:
        query_span.set_attribute("query.text", user_query)

        # Stage 1: Generate embedding
        with tracer.start_as_current_span("rag.embedding") as emb_span:
            embedding = generate_embedding(user_query)
            emb_span.set_attribute("embedding.model", "text-embedding-3-small")
            emb_span.set_attribute("embedding.dimensions", len(embedding))

        # Stage 2: Vector search
        with tracer.start_as_current_span("rag.vector_search") as search_span:
            results = vector_db.search(embedding, top_k=5)
            search_span.set_attribute("search.top_k", 5)
            search_span.set_attribute("search.results_count", len(results))

        # Stage 3: Augment prompt
        with tracer.start_as_current_span("rag.augment") as aug_span:
            context = "\n".join([r.text for r in results])
            prompt = f"Context: {context}\n\nQuestion: {user_query}"
            aug_span.set_attribute("augment.context_tokens", count_tokens(context))
            aug_span.set_attribute("augment.prompt_tokens", count_tokens(prompt))

        # Stage 4: LLM generation
        with tracer.start_as_current_span("rag.llm") as llm_span:
            response = llm_client.complete(prompt)
            llm_span.set_attribute("llm.model", "gpt-4")
            llm_span.set_attribute("llm.prompt_tokens", response.usage.prompt_tokens)
            llm_span.set_attribute("llm.completion_tokens", response.usage.completion_tokens)
            llm_span.set_attribute("llm.cost", response.usage.total_tokens * 0.00003)

return response.textThis structure captures latency and cost for every stage. When you send these traces to an APM tool, you can filter by slow queries, high-cost queries, or queries where vector search returned zero results. Without this instrumentation, you are flying blind.
Key Metrics to Track in RAG Pipelines
Latency Metrics
Track P50, P95, and P99 latency for the full query and for each stage individually. Full query latency tells you what users experience. Stage-specific latency tells you where to optimize. If P95 latency is 8 seconds and 6 seconds of that is LLM generation, switching to a faster model or caching similar queries will have more impact than optimizing vector search.
Track time to first token for streaming LLM responses. Users perceive a response that starts streaming in 500ms as faster than a response that takes 3 seconds to start even if total generation time is the same.
Track embedding generation latency separately for single queries vs. batch indexing. Batch embedding has different performance characteristics. A batch of 100 documents might take 2 seconds total, but the per-document latency is 20ms. Single-query embedding for the same model might take 300ms because of API round-trip overhead.
Retrieval Quality Metrics
Latency is meaningless if retrieval quality is poor. Track these signals to measure whether your vector search is returning the right documents:
Top-k accuracy: For queries with known correct answers, measure whether the correct document appears in the top-k results. If you retrieve 5 documents but the correct answer is ranked 8th, your top-k is too low or your embeddings do not capture the query intent well.
Retrieval precision: What percentage of retrieved documents are relevant? If you retrieve 10 documents and only 3 are relevant, precision is 30%. Low precision means the LLM is seeing noise, which increases cost and lowers answer quality.
Retrieval recall: What percentage of relevant documents were retrieved? If 5 documents are relevant and you only retrieved 2, recall is 40%. Low recall means the LLM is missing context it needs to answer correctly.
Re-ranking effectiveness: If you use a re-ranker after vector search, track how often re-ranking changes the top result. If re-ranking never changes the top result, it is not adding value and is just adding latency.
Empty result rate: What percentage of queries return zero results? This is a strong signal that embeddings are misaligned, the query is malformed, or the vector database does not contain relevant content.
Track these metrics over time. If retrieval precision drops from 80% to 50% after a model update or data refresh, you caught a quality regression.
Cost Metrics
RAG pipelines have three cost centers: embedding API calls, vector database queries, and LLM generation. Track cost per query and cost per stage.
Embedding cost: OpenAI charges $0.00002 per 1,000 tokens for text-embedding-3-small. A 500-token query costs $0.00001. That is cheap per query but adds up at scale. If you process 1 million queries per month, embedding cost alone is $10,000. Track embedding tokens per query and total monthly embedding cost.
Vector database cost: This depends on the database. Pinecone charges per pod per month plus read/write units. Weaviate charges per query volume. pgvector is free but requires infrastructure cost for Postgres hosting. Track queries per second, index size, and database-specific cost metrics.
LLM cost: This is usually the largest cost driver. GPT-4 charges $0.03 per 1,000 prompt tokens and $0.06 per 1,000 completion tokens. If your augmented prompt is 8,000 tokens and the completion is 500 tokens, cost per query is $0.27. At 10,000 queries per day, that is $2,700 per day or $81,000 per month. Track prompt tokens, completion tokens, model name, and cost per query. If cost spikes, you can trace it to queries that used unexpectedly long prompts or generated long completions.
Error and Availability Metrics
Track error rate for each stage. Embedding API calls can fail due to rate limits, timeouts, or invalid input. Vector search can fail due to database downtime, connection timeouts, or malformed queries. LLM calls can fail due to API rate limits, context window overflows, or safety filter rejections.
Track the percentage of queries that complete successfully end-to-end. If 95% of queries succeed, 5% are failing somewhere in the pipeline. Drill into traces for failed queries to see which stage failed and why.
Best Practices for Monitoring RAG Pipelines
Instrument Every Stage with OpenTelemetry
Use OpenTelemetry to create spans for embedding, vector search, augmentation, and LLM generation. Capture model name, token counts, cost, and latency as span attributes. Export traces to an APM tool that supports high-cardinality search. You need to filter traces by model, cost range, latency range, or error type. Tools that do not support high-cardinality filtering make trace analysis slow and frustrating.
Track Cost and Latency Together
A query that costs $0.50 and takes 2 seconds is very different from a query that costs $0.01 and takes 8 seconds. Track both dimensions together. Build dashboards that show cost vs. latency scatter plots. Identify queries that are both slow and expensive. Those are the ones to optimize first.
Monitor Retrieval Quality Separately from Latency
A fast RAG pipeline that returns wrong answers is worse than a slow pipeline that returns correct answers. Track retrieval precision and recall for a labeled evaluation set. Run these evaluations weekly or after every model or data update. If precision drops, investigate whether embeddings changed, vector database configuration changed, or source documents changed.
Set Alerts on Latency, Cost, and Quality
Alert on P95 latency crossing a threshold (for example, if P95 full query latency exceeds 5 seconds). Alert on hourly or daily cost exceeding a budget (for example, if hourly LLM cost exceeds $50). Alert on retrieval quality dropping below a threshold (for example, if top-5 precision on your evaluation set drops below 70%).
Do not alert on every slow query. Alert on sustained increases in P95 latency or on cost spikes that indicate a configuration change or query pattern shift.
Use Sampling for High-Volume Pipelines
If your RAG pipeline processes millions of queries per day, storing every trace is expensive and slow. Use tail-based sampling to keep traces for slow queries, expensive queries, and failed queries while sampling out fast, cheap, successful queries. Most APM tools support sampling rules based on span attributes. For example, keep 100% of traces where llm.cost > 0.10 or query.duration > 3s, but sample 10% of traces where both are below those thresholds.
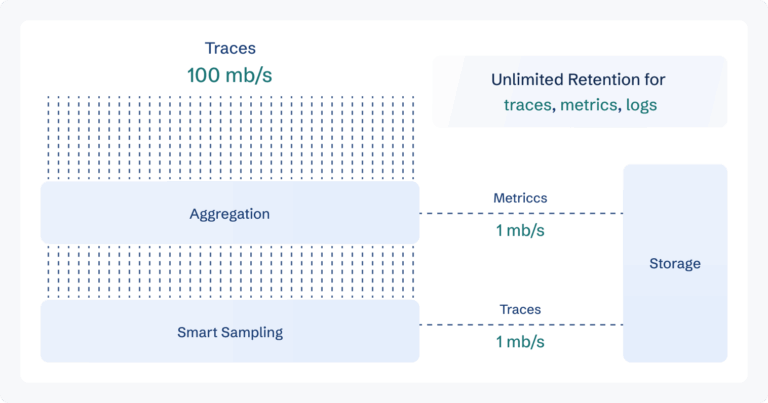
CubeAPM uses AI-driven smart sampling that retains traces based on latency, error status, and cost while reducing storage by up to 95%. This keeps useful traces without storing millions of identical successful queries.
Correlate RAG Metrics with Application Metrics
RAG pipelines do not run in isolation. Correlate RAG query latency with user session data, conversion rates, or support ticket volume. If RAG latency spikes correlate with increased bounce rates or support tickets, that is evidence that latency impacts user experience. Use that correlation to justify optimization work.
Track Embedding and LLM Model Versions
Embedding models and LLMs change over time. OpenAI releases new models. You might switch from text-embedding-ada-002 to text-embedding-3-small to reduce cost. Track model version in every span. If retrieval quality or latency changes after a model update, you can correlate it directly.
Tools and Implementation
CubeAPM for RAG Pipeline Monitoring
CubeAPM provides full-stack observability for RAG pipelines with native OpenTelemetry support, distributed tracing, and cost tracking. It runs on your infrastructure, so embedding vectors and retrieved documents never leave your cloud. That matters for teams with data residency requirements or PII concerns.
CubeAPM captures traces for embedding, vector search, augmentation, and LLM generation stages. You can filter traces by model name, token count, cost, or latency. Dashboards show P95 latency per stage, cost per query, and error rates. Alerts trigger on latency spikes, cost overruns, or failed queries.
CubeAPM pricing is $0.2/GB of ingested telemetry, with unlimited retention and no per-seat fees. If your RAG pipeline generates 500 GB of telemetry per month (traces, logs, metrics), cost is $100 per month. No surprise charges for users, hosts, or queries.
OpenTelemetry for Instrumentation
OpenTelemetry is the standard for instrumenting RAG pipelines. It provides SDKs for Python, JavaScript, Go, and Java. You instrument each stage with spans, capture attributes, and export traces to any OpenTelemetry-compatible backend.
OpenTelemetry is vendor neutral. You can switch from one APM tool to another without rewriting instrumentation. It integrates with LangChain, LlamaIndex, and Haystack, so you can instrument RAG pipelines built with those frameworks with minimal code changes.
Prometheus for Metrics
Prometheus collects metrics for latency histograms, request counts, error rates, and cost. You expose metrics from your RAG pipeline using the Prometheus client library, and Prometheus scrapes them on a schedule. Combine Prometheus metrics with OpenTelemetry traces for full visibility.
Prometheus is free and self-hosted. It requires infrastructure to run but gives you full control over metric retention and query performance.
Grafana for Dashboards
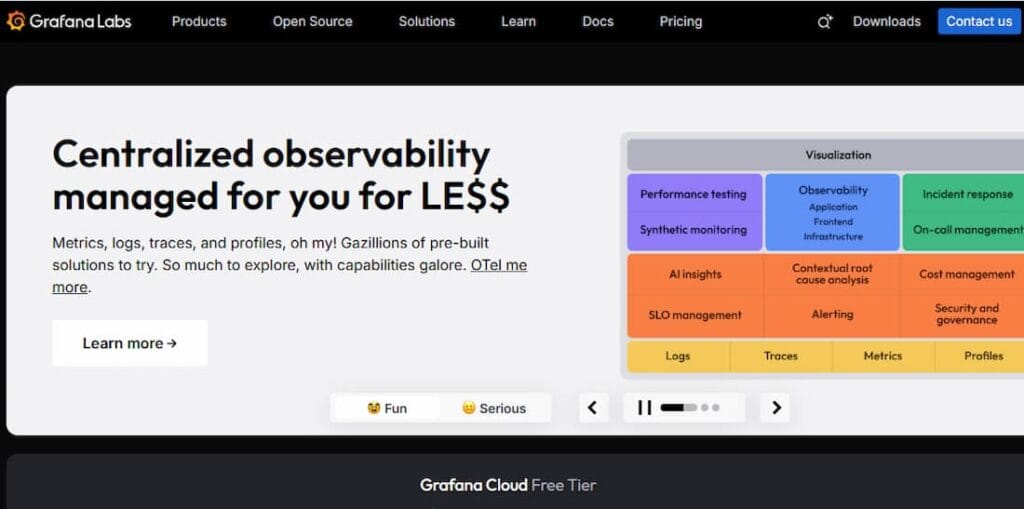
Grafana visualizes metrics from Prometheus, OpenTelemetry, or APM tools. Build dashboards that show RAG query latency per stage, cost per model, error rates, and retrieval quality metrics. Grafana is free and widely used.
Grafana requires manual dashboard configuration and does not provide tracing or log correlation out of the box. It is best used alongside a full APM tool like CubeAPM or as a visualization layer on top of Prometheus.
LangSmith for LLM-Specific Debugging
LangSmith is built by LangChain specifically for debugging LLM applications. It captures every LLM call, prompt, completion, token count, and cost. It provides a UI for browsing traces, comparing outputs, and identifying regressions.
LangSmith is strong for LLM-specific debugging but does not cover infrastructure metrics, vector database monitoring, or embedding generation in depth. It works well alongside a full-stack APM tool.
Datadog for Managed Full-Stack Monitoring
Datadog provides APM, infrastructure monitoring, and log management in one platform. It supports OpenTelemetry ingestion and provides pre-built dashboards for common frameworks.
Datadog is SaaS only, which means all telemetry data leaves your infrastructure. For RAG pipelines handling PII or proprietary data, this is a non-starter. Datadog pricing is based on hosts, indexed logs, and custom metrics. A 50-host deployment with 10 TB of logs per month costs $15,000 to $30,000 per month. Embedding vectors and retrieved documents are high-cardinality data, which drives up indexing costs fast.
Disclaimer: Datadog pricing based on [publicly available information](https://www.datadoghq.com/pricing/) as of current month. Enterprise discounts, custom contracts, and negotiated rates are not reflected here.
New Relic for SaaS APM

New Relic provides APM, logs, and infrastructure monitoring with a unified query language (NRQL). It supports OpenTelemetry ingestion and provides dashboards for distributed tracing.
New Relic charges per GB of ingested data and per user seat. Pricing starts at $0.40/GB beyond the free tier. A RAG pipeline ingesting 10 TB of telemetry per month costs $3,500 per month before user seats. NRQL creates lock-in because dashboards and alerts are not portable to other tools.
Disclaimer: New Relic pricing based on [publicly available information](https://newrelic.com/pricing) as of current month. Enterprise discounts and custom contracts are not reflected here.
Honeycomb for High-Cardinality Events
Honeycomb specializes in high-cardinality event data and distributed tracing. It provides fast queries across billions of events with arbitrary filters. For RAG pipelines with millions of queries per day, Honeycomb handles the scale well.
Honeycomb is SaaS only and charges per event volume. Pricing starts at $130 per month for the Pro plan. High-volume RAG pipelines can exceed $1,000 per month quickly.
Disclaimer: Honeycomb pricing is based on [publicly available information](https://www.honeycomb.io/pricing) as of the current month. Actual costs depend on event volume and retention.
Monitoring Embedding-Driven Search with CubeAPM
CubeAPM simplifies monitoring for RAG pipelines by providing distributed tracing, cost tracking, and quality metrics in one platform that runs on your infrastructure.
You instrument your RAG pipeline with OpenTelemetry. CubeAPM ingests traces and automatically extracts latency, token counts, cost, and error rates per stage. Dashboards show P95 latency for embedding, vector search, augmentation, and LLM generation. You can filter traces by model name, cost range, or latency range to identify expensive or slow queries.
- CubeAPM calculates cost per query based on token counts and model pricing. You see total daily cost, cost per model, and cost per user session. Alerts trigger when hourly cost exceeds a threshold or when P95 latency crosses a limit.
- CubeAPM runs in your VPC or on-prem, so embedding vectors, retrieved documents, and LLM prompts never leave your infrastructure. This is critical for teams in healthcare, finance, or regulated industries where data residency and PII protection are mandatory.
- The pricing is $0.2/GB of ingested telemetry with unlimited retention. A RAG pipeline generating 1 TB of telemetry per month costs $175 per month. No per-seat fees, no per-host fees, no indexing surcharges.
Disclaimer: The information in this article reflects the latest details available at the time of publication and may change as technologies and products evolve. Features, pricing, and plan limits can change over time. Always verify the latest information directly with the vendor before making purchasing or deployment decisions.
Frequently Asked Questions
What is the most important metric to track in a RAG pipeline?
P95 latency per stage. It tells you where bottlenecks are and whether users are experiencing slow responses. Cost per query is the second most important metric because RAG pipelines can become expensive fast without cost visibility.
How do you track retrieval quality in production?
Use a labeled evaluation set with known correct answers. Run retrieval queries against this set weekly and measure top-k accuracy, precision, and recall. Track these metrics over time to detect regressions after model or data updates.
What is the biggest hidden cost in RAG pipelines?
LLM token usage. A single long-context query can cost $0.50 if the augmented prompt is 10,000 tokens. Without per-query cost tracking, you will not notice until the monthly bill arrives.
Should you use sampling for RAG pipeline traces?
Yes, if you process millions of queries per day. Use tail-based sampling to keep traces for slow, expensive, or failed queries while sampling out fast, cheap, successful queries. This reduces storage cost without losing visibility into problems.
How do you monitor vector database performance?
Track search latency, number of results returned, and empty result rate. If search latency spikes, check index size and database load. If empty result rate increases, check embedding alignment and query quality.
What tools are best for monitoring RAG pipelines?
CubeAPM for full-stack observability with data residency, OpenTelemetry for vendor-neutral instrumentation, Prometheus for metrics, and LangSmith for LLM-specific debugging. Avoid tools that require sending PII or proprietary data to external SaaS platforms.
How do you alert on RAG pipeline issues without noise?
Alert on sustained P95 latency increases, hourly cost exceeding budget, or retrieval quality dropping below a threshold. Do not alert on individual slow queries unless they cross an extreme threshold like 10 seconds.