









Apache Tomcat quietly becomes a production liability the moment thread pools saturate and requests start queuing. A single slow servlet holding a worker thread for 30 seconds can cascade into a full thread exhaustion event, returning 503s to every new client, while your infrastructure dashboards show CPU at 20% and memory well within bounds. The problem is invisible without the right telemetry.
This guide covers how Tomcat exposes performance data through JMX, what thread pool and request metrics actually mean in production, what thresholds signal real trouble, and how to wire this into a monitoring stack that catches problems before users notice.
According to the CNCF Annual Survey 2023, Java remains one of the most widely used languages for production workloads running on cloud native infrastructure, making Tomcat observability a persistent operational concern for platform teams.
What Is Tomcat Monitoring?
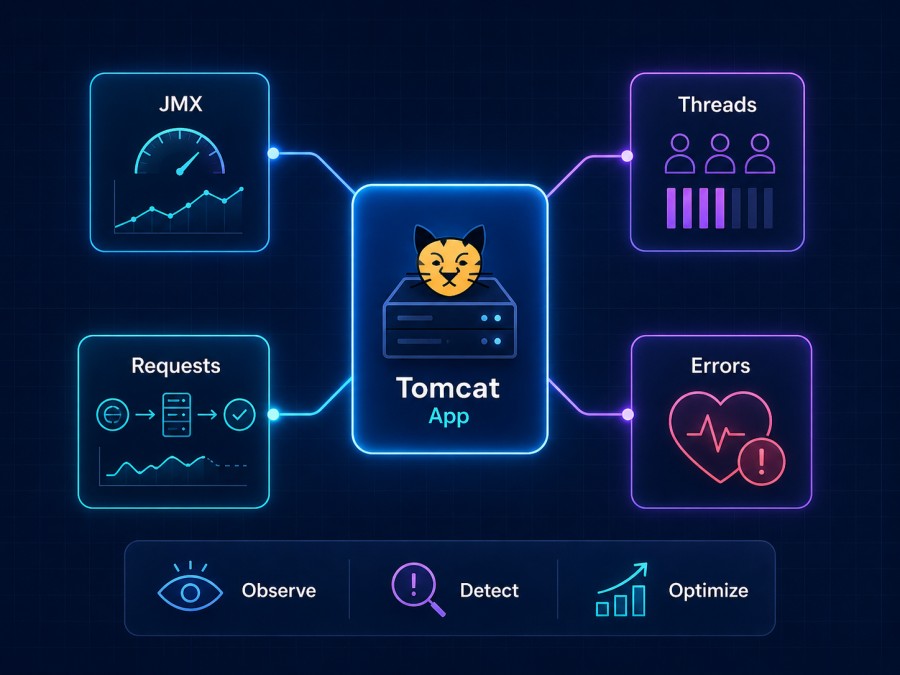
Tomcat monitoring is the practice of continuously collecting and analyzing performance signals from Apache Tomcat’s runtime components – connectors, thread pools, request processors, JVM memory, and web application contexts so that engineering teams can detect saturation, latency spikes, and error conditions before they affect end users.
Tomcat is not a passive server. It actively manages worker thread pools, connection queues, and request lifecycles through its Catalina engine. Each of these subsystems has a finite capacity, and when any one of them hits its ceiling, the failure mode is sudden rather than gradual. Monitoring gives you visibility into how close each subsystem is running to its limit at any given moment.
The scope of Tomcat monitoring spans three layers:
- JVM layer: heap memory, garbage collection pause duration, thread states, class loading
- Connector layer: active connections, connection queue depth, thread pool utilization per connector
- Application layer: request throughput, error rates, session counts, servlet response times
Missing any one of these layers produces blind spots. A GC pause that freezes all threads for 2 seconds shows up as a latency spike on the request layer but has no connector-level signature. Thread pool exhaustion shows on the connector layer but not in JVM heap metrics. Full coverage requires all three.
How Tomcat Monitoring Works
Tomcat exposes its internal state through Java Management Extensions (JMX), which is the standard Java mechanism for runtime instrumentation. When JMX remote access is enabled, management clients and monitoring agents can connect to Tomcat’s MBean server and query metrics in real time.
The JMX Architecture in Tomcat
Tomcat registers its internal components as MBeans (Managed Beans) in the platform’s MBean server. Each MBean corresponds to a Tomcat component, a connector, a thread pool, a request processor, or a web application context, and exposes attributes that reflect that component’s current state.
The primary domains you interact with are:
Catalina: contains MBeans for connectors, engines, hosts, contexts, and thread poolsjava.lang: contains JVM MBeans for memory, garbage collection, and thread management
To query these over a network, Tomcat must be configured with a JMX remote port. A minimal configuration in catalina.sh or the JVM startup arguments looks like this:
JAVA_OPTS="$JAVA_OPTS \
  -Dcom.sun.management.jmxremote \
  -Dcom.sun.management.jmxremote.port=9090 \
  -Dcom.sun.management.jmxremote.rmi.port=9090 \
  -Dcom.sun.management.jmxremote.authenticate=false \
  -Dcom.sun.management.jmxremote.ssl=false \
-Djava.rmi.server.hostname=<your-host-ip>"In production, authentication and SSL should be enabled. The authenticate=false setting above is suitable only for isolated development environments.
How Monitoring Agents Consume JMX Data
Once JMX is exposed, monitoring agents collect metrics in one of two ways:
- Direct JMX polling: The agent connects to the MBean server and reads attribute values at a configured interval (typically 15 to 60 seconds). Tools like JConsole, JMX Exporter, and the OpenTelemetry JMX receiver all use this approach.
- Prometheus scraping via JMX Exporter: The Prometheus JMX Exporter runs as a Java agent inside the Tomcat JVM. It reads MBean values and exposes them as a Prometheus-compatible HTTP endpoint, which a Prometheus server scrapes. This is the most common pattern for teams running cloud native infrastructure.
The JMX Exporter agent is attached via the JVM startup flag:
-javaagent:/path/to/jmx_prometheus_javaagent.jar=8080:/path/to/config.yamlThe configuration YAML tells the exporter which MBeans to expose and how to name the resulting Prometheus metrics.
What Gets Monitored Through JMX
Every connector Tomcat runs (HTTP/1.1, AJP, NIO, NIO2) has its own MBean hierarchy. The thread pool serving that connector has a separate MBean. Request processors within the pool have their own MBeans. This hierarchy means you can isolate problems to a specific connector rather than seeing only aggregate Tomcat health.
The key MBean paths for monitoring are:
| Component | MBean ObjectName |
|---|---|
| Thread pool | Catalina:type=ThreadPool,name="http-nio-8080" |
| Global request processor | Catalina:type=GlobalRequestProcessor,name="http-nio-8080" |
| Connection pool (JDBC) | Catalina:type=DataSource,context=/app,host=localhost,class=javax.sql.DataSource,name=jdbc/mydb |
| JVM memory | java.lang:type=Memory |
| JVM GC | java.lang:type=GarbageCollector,name=G1 Young Generation |
Key JMX Metrics for Tomcat Monitoring
Understanding which metrics matter and what their values tell you is the core skill in Tomcat monitoring. Here is a breakdown of every significant metric group, what it measures, and what actionable thresholds look like in production.
Thread Pool Metrics
Thread pools are the most operationally critical component in Tomcat. Every HTTP request consumes one worker thread from the pool for the duration of that request. If all threads are busy, new requests queue (up to acceptCount) and then fail.
The thread pool MBean for a connector named http-nio-8080 exposes these key attributes:
| Metric | Attribute | What it means |
|---|---|---|
| Current threads | currentThreadCount | Total threads alive in the pool, including idle ones |
| Busy threads | currentThreadsBusy | Threads actively processing a request right now |
| Max threads | maxThreads | Pool ceiling – default 200 in Tomcat |
| Minimum spare threads | minSpareThreads | Threads kept alive even when idle – default 10 |
| Connection count | connectionCount | Active connections at the connector level |
| Max connections | maxConnections | Ceiling before new connections queue – default 10,000 for NIO |
| Accept count | acceptCount | Queue depth for connections waiting when max is reached – default 100 |
Thread utilization ratio is the most important derived metric:
Thread utilization = currentThreadsBusy / maxThreadsThresholds to alert on:
- Above 70% sustained for more than 5 minutes: investigate; you are likely approaching saturation under current load
- Above 85% sustained: high alert; one traffic spike will exhaust the pool
- At or near 100%: critical; new connections are already being queued or rejected
The unique production insight that most monitoring guides miss: thread pool saturation does not always correlate with CPU usage. If your servlets are doing synchronous database calls or external HTTP calls, threads spend most of their time blocked on I/O, not consuming CPU. A Tomcat instance at 10% CPU can be at 95% thread utilization and one slow downstream dependency away from a full outage. Watching CPU alone gives you false confidence.
A frequently surfaced concern in the Stack Overflow thread on Tomcat thread pool monitoring is that thread counts can appear healthy in dashboards while a subset of threads are permanently stuck waiting on a connection that never returns — a condition that only thread state analysis can reveal.
Request Metrics
The GlobalRequestProcessor MBean tracks aggregate request statistics since the last Tomcat restart. Because these are cumulative counters, monitoring systems compute rates by differencing successive readings.
| Metric | Attribute | What it means |
|---|---|---|
| Total requests | requestCount | Cumulative requests processed |
| Error count | errorCount | Cumulative requests that returned a 4xx or 5xx |
| Bytes received | bytesReceived | Total bytes received across all requests |
| Bytes sent | bytesSent | Total bytes sent in responses |
| Processing time | processingTime | Cumulative time (ms) spent processing requests |
| Max time | maxTime | Single slowest request since last reset |
Derived metrics to compute:
- Request rate:
(requestCount_now - requestCount_prev) / interval_seconds - Error rate:
(errorCount_now - errorCount_prev) / (requestCount_now - requestCount_prev) - Average response time:
(processingTime_now - processingTime_prev) / (requestCount_now - requestCount_prev)
Thresholds:
- Error rate above 1%: investigate: likely application errors or upstream failures
- Error rate above 5%: alert: users are actively experiencing failures
- Average response time above 500ms sustained: alert for most web applications
maxTimeabove 30,000ms (30 seconds): a thread held this long is either stuck or processing an unusually heavy request
JVM Memory and Garbage Collection Metrics
JVM memory pressure causes Tomcat performance degradation in two distinct ways. Heap exhaustion produces OutOfMemoryError, killing the JVM entirely. High GC pressure causes stop-the-world pauses that freeze all threads simultaneously — this shows up as coordinated latency spikes across all active requests.
Key JVM metrics from the java.lang:type=Memory MBean:
| Metric | Attribute | What it means |
|---|---|---|
| Heap used | HeapMemoryUsage.used | Current heap consumption |
| Heap committed | HeapMemoryUsage.committed | Heap allocated from OS |
| Heap max | HeapMemoryUsage.max | Maximum heap (set by -Xmx) |
| Non-heap used | NonHeapMemoryUsage.used | Metaspace, code cache, etc. |
GC metrics from java.lang:type=GarbageCollector:
| Metric | Attribute | What it means |
|---|---|---|
| GC collection count | CollectionCount | How many GC runs have occurred |
| GC collection time | CollectionTime | Total ms spent in GC |
Derived metric: GC overhead = CollectionTime_delta / elapsed_time_ms
Alert thresholds:
- Heap utilization above 80% of max: alert; approaching GC pressure zone
- GC overhead above 5%: alert; significant pause impact on response times
- GC overhead above 10%: critical; application is likely degrading for users
JDBC Connection Pool Metrics
When Tomcat applications use JDBC connection pools (via JNDI data sources), pool exhaustion is another common failure mode. A full JDBC pool causes application threads to block waiting for a connection, which then causes worker thread saturation, which then cascades to request queue growth.
The DataSource MBean (available when using Tomcat’s built-in connection pooling) exposes:
| Metric | Attribute | What it means |
|---|---|---|
| Active connections | numActive | Connections currently in use |
| Idle connections | numIdle | Connections available in pool |
| Max active | maxActive | Pool ceiling |
| Wait count | waitCount | Threads waiting for a connection |
Alert immediately when waitCount is above zero – any waiting indicates that the pool is full and application threads are stacking up behind it.
Best Practices for Tomcat Monitoring
Set Thread Pool Size Based on Measured Behavior, Not Defaults
The default maxThreads=200 is rarely the right number for a production workload. Too high, and you create thundering herd conditions during GC pauses. Too low, and you throttle request handling before the server is actually saturated.
The correct approach:
- Run load tests at expected peak throughput
- Measure
currentThreadsBusyat peak - Set
maxThreadsto 120–130% of measured peak busy threads - Set
minSpareThreadsto roughly 20% ofmaxThreadsto absorb sudden spikes without cold-starting threads
For IO-bound servlets (database calls, external APIs), threads spend most time waiting. Higher maxThreads (300–500) makes sense here. For CPU-bound servlets, more threads than CPU cores creates context-switching overhead; keep maxThreads closer to 2x CPU core count.
Monitor Per-Connector, Not Just Aggregate Totals
If Tomcat is running both an HTTP connector (port 8080) and an AJP connector (port 8009), each has its own thread pool. An AJP connector can be saturated while the HTTP connector is fine. Aggregate thread counts hide this. Instrument each connector’s MBean path separately and alert on each independently.
Track Request Tracking at the Span Level for Distributed Systems
When Tomcat is part of a microservices architecture, request tracking needs to extend beyond Tomcat’s own GlobalRequestProcessor counters. Distributed tracing, using OpenTelemetry’s Java agent, injects trace context into incoming requests and propagates it through every downstream service call. This gives you request latency broken down by which service contributed how much time, rather than just a single Tomcat response time.
Understanding how infrastructure monitoring connects to application observability helps frame where Tomcat-level JMX metrics fit within a broader monitoring strategy. JMX gives you the server’s internal state while distributed traces give you the user’s end-to-end experience.
Use JMX Exporter Configuration to Filter Noise
The JMX Exporter will happily expose hundreds of MBean attributes if unconfigured. Most of them are rarely useful in production dashboards. Define an explicit allowlist in your jmx_exporter_config.yaml to keep your Prometheus metrics set lean and query-efficient:
rules:
  - pattern: 'Catalina<type=ThreadPool, name="([-a-zA-Z0-9+&@#/%?=~_|!:.,;]*)"><>(currentThreadCount|currentThreadsBusy|maxThreads|connectionCount)'
    name: tomcat_threadpool_$2
    labels:
      connector: $1
  - pattern: 'Catalina<type=GlobalRequestProcessor, name="([-a-zA-Z0-9+&@#/%?=~_|!:.,;]*)"><>(requestCount|errorCount|processingTime|maxTime)'
    name: tomcat_request_$2
    labels:
      connector: $1
  - pattern: 'java.lang<type=Memory><>(HeapMemoryUsage|NonHeapMemoryUsage)'
    name: jvm_memory_$1
type: GAUGEAlert on Trends, Not Just Thresholds
A single spike in currentThreadsBusy to 180 out of 200 may be a momentary blip. Sustained utilization above 70% for 5+ minutes is a structural problem. Configure your alerting tool to alert on sustained conditions using moving averages rather than instantaneous values. This dramatically reduces false positive alert volume.
Teams working through how to combine uptime probing with internal JMX metrics often find that synthetic monitoring complements JMX monitoring by confirming that external users actually experience the degradation that internal metrics predict.
Correlate JMX Metrics with Access Logs
Tomcat’s access log valve (org.apache.catalina.valves.AccessLogValve) writes request-level data including response time, status code, and bytes sent. Shipping these logs to a centralized log management system and correlating them with JMX thread pool metrics lets you answer the question “which specific endpoints are consuming the most threads and for how long?”. It’s something JMX aggregate counters cannot answer alone.
Tools and Implementation for Tomcat Monitoring
JConsole: Immediate JMX Inspection
JConsole ships with the JDK and connects directly to a Tomcat JMX remote port. It shows thread pool attributes, JVM memory, and GC data in real time. It is the fastest way to investigate a suspected thread saturation event without any infrastructure setup.
Connect by running:
jconsole <host>:<jmx-port>Navigate to the MBeans tab and browse Catalina > ThreadPool > http-nio-8080 for live thread pool values. JConsole is not suitable for production alerting or dashboarding. It is a debugging and inspection tool only.
Prometheus JMX Exporter with Grafana
The most widely deployed Tomcat monitoring stack for teams running Prometheus-based infrastructure:
- Download the Prometheus JMX Exporter Java agent JAR
- Write a configuration YAML defining which MBeans to expose
- Add the
-javaagentflag to Tomcat’s JVM startup arguments - Configure Prometheus to scrape the exporter’s HTTP endpoint
- Build Grafana dashboards using the exposed metrics
This stack gives you full control over metric collection, alerting, and retention. The operational cost is maintaining Prometheus, Alertmanager, and Grafana as separate services.
OpenTelemetry Collector with JMX Receiver
The OpenTelemetry Collector JMX Receiver provides a vendor-neutral alternative to the Prometheus JMX Exporter. The collector connects to Tomcat’s JMX port, reads configured MBeans, and emits metrics in OTLP format to any compatible backend.
receivers:
  jmx:
    jar_path: /opt/opentelemetry-jmx-metrics.jar
    endpoint: service:jmx:rmi:///jndi/rmi://localhost:9090/jmxrmi
    target_system: tomcat
    collection_interval: 10s
exporters:
  otlp:
    endpoint: http://your-backend:4317
service:
  pipelines:
    metrics:
      receivers: [jmx]
exporters: [otlp]The target_system: tomcat setting activates the Collector’s built-in Tomcat metric definitions, covering thread pools, request processors, and key JVM metrics without requiring manual MBean configuration.
The OpenTelemetry approach is particularly valuable when Tomcat is one of multiple Java services being monitored. The same Collector can gather JMX data from Tomcat, Jetty, WildFly, and any other JMX-enabled service using a consistent pipeline and format.
CubeAPM: Full Stack Observability for Tomcat Environments
CubeAPM is a full-stack observability platform that ingests OpenTelemetry data from Tomcat deployments and correlates JMX metrics with distributed traces, application logs, and infrastructure metrics in a single unified view.
For Tomcat specifically, CubeAPM works in two complementary ways:
JMX metrics via OpenTelemetry Collector: Configure the OTel Collector JMX receiver as shown above, pointing the OTLP exporter at CubeAPM’s ingestion endpoint. CubeAPM surfaces thread pool utilization, request throughput, error rates, and JVM memory metrics in its infrastructure monitoring dashboards.
Distributed tracing via OpenTelemetry Java agent: Attach the OTel Java auto-instrumentation agent to Tomcat’s JVM. This automatically traces every incoming HTTP request through the servlet layer, capturing span-level latency, error status, and downstream dependency calls (JDBC, external APIs). Teams see exactly which endpoint is slow and which downstream call is causing it, not just aggregate Tomcat response times.
The combination means a thread pool saturation alert in CubeAPM can be clicked through to see which specific endpoints are consuming threads, then further to the traces showing which downstream database query is holding those threads open. This context chain, from JMX metric to trace to log, is what makes incidents resolvable in minutes rather than hours.
CubeAPM runs inside your own VPC or on-premises, so JMX data never leaves your infrastructure. Pricing is $0.20/GB of data ingested with no per-seat or per-host fees. A Tomcat environment emitting 100GB of metrics and traces monthly costs $15 in CubeAPM ingestion charges. Delhivery documented 75% cost savings after consolidating monitoring across services using CubeAPM.
For teams already using the OpenTelemetry Collector for Tomcat JMX collection, CubeAPM is a drop-in OTLP backend — no additional instrumentation required.
Pricing based on publicly available information as of June 2026. Verify current rates at [CubeAPM pricing](https://cubeapm.com/pricing/).
Dynatrace
Dynatrace’s OneAgent provides automated Tomcat discovery and instruments thread pools, request throughput, and JVM metrics without manual JMX configuration. It is one of the strongest options for teams that want zero-touch instrumentation across a mixed Java environment. Pricing is host-based and at enterprise scale becomes a significant line item. Verify current rates at Dynatrace’s pricing page.
Datadog APM with JMX Integration
Datadog’s Agent includes a built-in JMX integration that can be configured to collect Tomcat MBean data. The Datadog APM layer adds distributed tracing. The combined cost at scale, $42/host/month for APM plus data ingestion fees, makes it expensive for large Tomcat deployments. Real User Monitoring data can be layered on top for full end-to-end visibility from browser to Tomcat thread, though each additional capability adds to the bill.
Quick Comparison: Tomcat Monitoring Tool Options
| Tool | JMX collection method | Distributed tracing | Deployment | Pricing model |
|---|---|---|---|---|
| CubeAPM | OTel Collector JMX receiver | OTel Java agent, full traces | Self-hosted in your VPC | $0.15/GB ingested, no per-seat fees |
| Prometheus + Grafana | JMX Exporter Java agent | Separate setup required | Self-hosted, DIY ops | Open source (infra costs only) |
| OpenTelemetry Collector | Native JMX receiver | OTel Java agent | Vendor-agnostic pipeline | Free (agent), backend costs vary |
| Dynatrace | OneAgent auto-discovery | Automatic PurePath tracing | SaaS + managed on-prem | Host-based, verify at pricing page |
| Datadog | Built-in JMX integration | APM agent | SaaS only | $42/host/month APM, verify at pricing page |
| JConsole | Direct JMX connection | None | Local desktop tool | Free (JDK included) |
Feature availability and pricing may vary by plan tier. Verify current feature sets on each vendor’s official documentation.
Monitoring Tomcat with CubeAPM
For teams running Tomcat in regulated environments or those looking to consolidate monitoring costs, CubeAPM’s self-hosted deployment model deserves a dedicated look.
The typical setup for Tomcat monitoring in CubeAPM involves three components working together:
Step 1: JVM instrumentation: Attach the OpenTelemetry Java auto-instrumentation agent to Tomcat. This handles HTTP request tracing, JDBC span generation, and outbound HTTP call tracking automatically with no code changes.
JAVA_OPTS="$JAVA_OPTS -javaagent:/opt/opentelemetry-javaagent.jar"
JAVA_OPTS="$JAVA_OPTS -Dotel.service.name=tomcat-app"
JAVA_OPTS="$JAVA_OPTS -Dotel.exporter.otlp.endpoint=http://collector:4317"Step 2: JMX metrics collection: Deploy the OpenTelemetry Collector with the JMX receiver configured for Tomcat. The Collector forwards metrics to CubeAPM’s OTLP ingestion endpoint.
Step 3: Alerting: In CubeAPM, configure alerts on thread pool utilization (currentThreadsBusy / maxThreads > 0.80), error rate, and average response time. Route alerts to Slack or PagerDuty with trace context attached so on-call engineers can jump directly from the alert to the relevant trace.
What this gives you that JMX-only monitoring cannot: when a thread pool alert fires, the engineer on call can open CubeAPM, see which endpoints are currently consuming threads, click into a slow trace, see the full span waterfall showing which database query is blocking the servlet, and then open the correlated log lines; all in one platform without switching tools.

CubeAPM supports the top infrastructure monitoring tools patterns and connects Tomcat-level JMX visibility with broader host and container observability in the same unified interface, which is particularly useful when Tomcat runs inside Kubernetes pods where node pressure and pod resource limits interact with thread pool behavior.
Tomcat monitoring becomes genuinely useful when it goes beyond health checks and into the specific signals that predict failures before they happen: thread pool utilization trends, GC overhead accumulation, request queue depth, and JDBC pool wait counts. JMX exposes all of this out of the box. The work is in building the collection pipeline, defining meaningful alert thresholds, and connecting JMX metrics to the distributed trace data that shows which application behavior is driving those numbers. Whether you use a Prometheus-based stack, the OpenTelemetry Collector, or a full observability platform like CubeAPM, the monitoring architecture follows the same principle: collect at every layer, correlate across layers, and alert on trends, not just thresholds.
Disclaimer: The information in this article reflects the latest details available at the time of publication and may change as technologies and products evolve. Features, pricing, and plan limits can change over time. Always verify the latest information directly with the vendor before making purchasing or deployment decisions.
Frequently Asked Questions
What JMX metrics matter most for Tomcat thread pool monitoring?
The two most critical metrics are `currentThreadsBusy` and `maxThreads` on the `Catalina:type=ThreadPool` MBean. Their ratio gives you thread utilization — alert when this exceeds 70% sustained for 5 or more minutes. Also watch `connectionCount` and `acceptCount` to understand whether connections are queuing before they even reach the thread pool.
How do I enable JMX remote access on Tomcat?
Add JMX system properties to your Tomcat startup script. At minimum, set `com.sun.management.jmxremote`, `com.sun.management.jmxremote.port`, and `java.rmi.server.hostname`. In production, always enable authentication and SSL. Without `java.rmi.server.hostname` set to your host’s actual IP address, remote connections will fail even if the port is open, which is one of the most common configuration mistakes teams encounter.
What is the difference between Tomcat thread pool saturation and CPU saturation?
Thread pool saturation occurs when all worker threads are busy handling requests, regardless of CPU load. IO-bound servlets spend most of their time waiting on database responses or external API calls, not consuming CPU. A server at 10% CPU can simultaneously be at 100% thread utilization if all threads are blocked on slow downstream calls. Monitoring both metrics independently is essential — CPU alone will miss IO-driven thread exhaustion entirely.
How does the Prometheus JMX Exporter work with Tomcat?
The Prometheus JMX Exporter runs as a Java agent inside the Tomcat JVM process. It reads configured MBean attribute values and exposes them as a Prometheus-compatible HTTP metrics endpoint. A Prometheus server scrapes this endpoint at a defined interval and stores the values as time series. You attach the agent via the `-javaagent` JVM flag pointing to the exporter JAR, along with a configuration YAML that defines which MBeans and attributes to expose.
What alert thresholds should I set for Tomcat monitoring?
Practical starting thresholds: thread utilization above 70% for 5 minutes (warning), above 85% (critical). Error rate above 1% (investigate), above 5% (alert). Average response time above 500ms sustained (alert for most web apps). Heap utilization above 80% of max heap (alert). GC overhead above 5% of wall clock time (alert). JDBC pool `waitCount` above 0 (alert immediately — any waiting indicates pool exhaustion).
Can I monitor Tomcat running inside Kubernetes with JMX?
Yes, but there are networking considerations. JMX remote access requires both the RMI registry port and the RMI data port to be reachable. When Tomcat runs in a Kubernetes pod, expose both ports in the pod spec. Setting `java.rmi.server.hostname` to the pod’s IP (or a stable service IP) is critical, as the default hostname resolution inside containers often resolves to a non-routable address. The OpenTelemetry Collector JMX receiver running as a sidecar container in the same pod avoids most of these networking issues.
What does `maxTime` in the GlobalRequestProcessor MBean represent?
`maxTime` records the single longest request processing time in milliseconds since Tomcat last restarted. It is a cumulative high-water mark, not a rolling maximum. A value of 45,000ms means at least one request took 45 seconds to complete at some point since the last restart. Track the rate of change of `maxTime` — if it keeps increasing, long-running requests are accumulating. Reset context by tracking the delta between scrape intervals to identify when these extreme outliers occur.