









Kafka pipelines break quietly. A payment processing consumer that falls 2 million messages behind the producer does not throw an exception. It just processes stale data with growing latency until someone notices that transaction confirmations stopped arriving. By that point, the lag has been accumulating for hours. The Java clients expose every signal needed to catch this early, but only if you know which metrics to collect and what thresholds actually mean something in production.
This guide covers how Kafka Java client monitoring works, the exact JMX metric names for consumer lag and producer health, how to export those metrics to Prometheus, and what tooling makes sense for teams at different scales. According to the CNCF 2024 Annual Survey, Kafka remains one of the most widely deployed messaging and streaming platforms in cloud native environments, which makes observability into its Java clients a foundational concern for most platform teams.
What Is Kafka Java Client Monitoring?
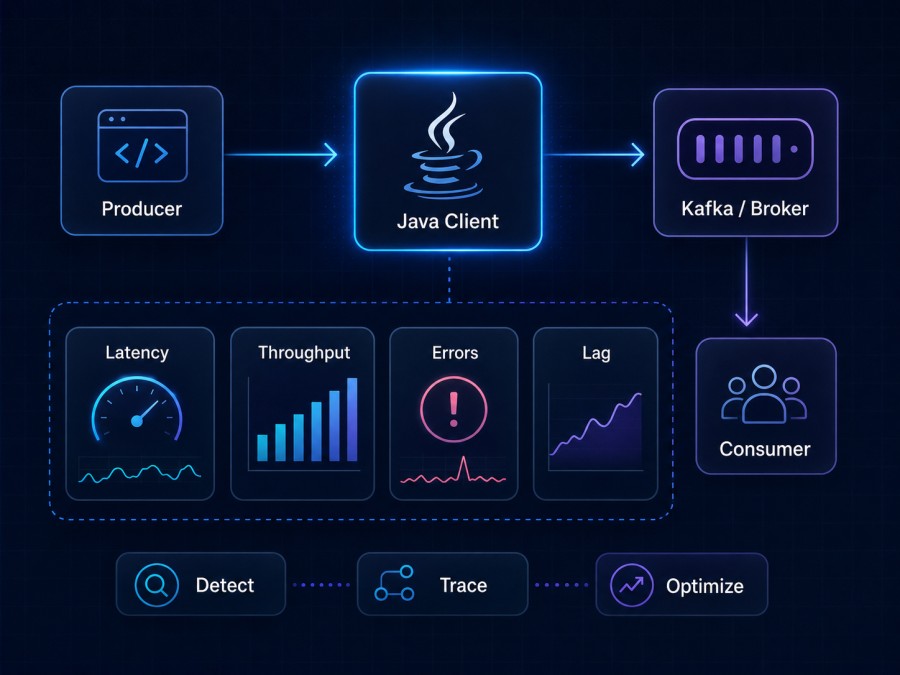
Kafka Java client monitoring is the practice of continuously collecting and analyzing telemetry from the Kafka producer and consumer instances running inside your Java applications. Unlike broker-side monitoring, which tracks cluster health, replication state, and throughput at the infrastructure level. Client-side monitoring surfaces what is happening from the application’s perspective: how fast a consumer is processing messages, whether a producer is getting acknowledgments in time, and whether a consumer group is keeping pace with the incoming message rate.
The distinction matters because a healthy broker does not mean healthy clients. A Kafka broker can be fully operational with zero under-replicated partitions while a single slow consumer accumulates millions of unprocessed messages. The broker has no visibility into whether your application logic is processing those messages at an acceptable rate; only the consumer client does.
Consumer lag is the most watched client metric: it is the difference between the latest offset on a partition and the last committed offset for a consumer group. A lag of zero means the consumer is caught up. A lag of 500,000 messages on a payments topic means your application is processing data that is potentially minutes or hours old, depending on the production rate.
Producer metrics tell a different story. They reveal whether the client can deliver messages to the broker reliably, at what latency, and with what error rate. A spike in producer request latency often precedes a consumer lag spike, because brokers under pressure take longer to acknowledge writes, which slows down producer throughput and can create backpressure upstream.
Monitoring both sides together gives you full pipeline observability: from message creation through delivery to consumption.
How Kafka Java Client Monitoring Works
The JMX metrics layer
Kafka Java clients expose metrics through two mechanisms. The broker uses Yammer Metrics internally, but the Java producer and consumer clients use Kafka Metrics, a purpose-built metrics registry that minimizes transitive dependencies pulled into client applications. Both are accessible via Java Management Extensions (JMX).
JMX organizes metrics into Management Beans (MBeans). Each MBean has a name that encodes the client type, client ID, topic, and partition. For example, the maximum consumer lag across all partitions is accessible at:
kafka.consumer:type=consumer-fetch-manager-metrics,client-id={client-id}
Attribute: records-lag-max
Every rate metric in the Kafka Java clients also has a corresponding cumulative total. records-consumed-rate has a matching records-consumed-total. This matters for alerting: rate metrics are more useful for real-time anomaly detection, while totals are useful for throughput accounting over a billing period.
To see all available metrics interactively, run jconsole and point it at a running Kafka client. This gives you a live MBean browser without writing any code – useful for discovering metric names before you commit to a collection pipeline.
Remote JMX access and security
Apache Kafka disables remote JMX by default. To enable it for a producer or consumer running inside a Java application, set the JMX_PORT environment variable or pass the standard Java system properties at startup:
-Dcom.sun.management.jmxremote
-Dcom.sun.management.jmxremote.port=9999
-Dcom.sun.management.jmxremote.authenticate=false
-Dcom.sun.management.jmxremote.ssl=falseNever expose JMX without authentication in production. A JMX endpoint without auth gives any network-accessible process the ability to read internal state and invoke management operations. Use KAFKA_JMX_OPTS to set authentication and SSL when enabling remote access on production clients.
The Prometheus JMX Exporter
Most teams collect Kafka client metrics by running the Prometheus JMX Exporter as a Java agent alongside the client application. The exporter scrapes the JMX MBean registry and exposes metrics on an HTTP endpoint that Prometheus can scrape.
Add the agent to your application startup:
-javaagent:/opt/jmx_exporter/jmx_prometheus_javaagent-0.20.0.jar=8080:/opt/jmx_exporter/kafka-client.ymlA minimal kafka-client.yml configuration to capture consumer lag and producer metrics:
lowercaseOutputName: true
rules:
  - pattern: 'kafka.consumer<type=consumer-fetch-manager-metrics, client-id=(.+)><>records-lag-max'
    name: kafka_consumer_records_lag_max
    labels:
      client_id: "$1"
  - pattern: 'kafka.consumer<type=consumer-fetch-manager-metrics, client-id=(.+), topic=(.+), partition=(.+)><>records-lag'
    name: kafka_consumer_records_lag
    labels:
      client_id: "$1"
      topic: "$2"
      partition: "$3"
  - pattern: 'kafka.producer<type=producer-metrics, client-id=(.+)><>record-send-rate'
    name: kafka_producer_record_send_rate
    labels:
      client_id: "$1"
  - pattern: 'kafka.producer<type=producer-metrics, client-id=(.+)><>request-latency-avg'
    name: kafka_producer_request_latency_avg_ms
    labels:
      client_id: "$1"
  - pattern: 'kafka.producer<type=producer-metrics, client-id=(.+)><>record-error-rate'
    name: kafka_producer_record_error_rate
    labels:
client_id: "$1"This gives you per-partition consumer lag and per-client producer health metrics, both queryable in Prometheus and visualizable in Grafana or any compatible dashboard tool.
Consumer Lag Metrics: What to Monitor and Why
Consumer lag is not a single number. It is a per-partition measurement that aggregates across a consumer group. Understanding the full picture requires collecting metrics at multiple levels.
records-lag-max: the headline metric
records-lag-max is published by the consumer client itself (not the broker) and represents the maximum lag across all partitions assigned to that consumer instance. The MBean path is:
kafka.consumer:type=consumer-fetch-manager-metrics,client-id={client-id}
Attribute: records-lag-max
This is the first metric to alert on. If records-lag-max exceeds a topic-specific threshold for more than a few minutes, the consumer group is falling behind.
The challenge with records-lag-max is that it is only published by live consumer instances. If a consumer crashes entirely, the metric disappears from JMX. Broker-side tools like kafka-consumer-groups.sh or dedicated lag exporters remain the authoritative source for offline consumer groups — this is one reason why client-side JMX monitoring alone is not sufficient for production pipelines.
Per-partition lag: records-lag
For detailed diagnostics, collect per-partition lag:
kafka.consumer:type=consumer-fetch-manager-metrics,client-id={client-id},topic={topic},partition={partition}
Attribute: records-lag
Per-partition data reveals skew. A consumer group might have an average lag of 5,000 messages, but one partition could be sitting at 200,000 while all others are near zero. This pattern typically indicates a partition assignment imbalance, a hot partition, or a message that is causing processing failures and retries on a specific partition.
records-consumed-rate: throughput signal
kafka.consumer:type=consumer-fetch-manager-metrics,client-id={client-id}
Attribute: records-consumed-rate
This is the rate at which the consumer is processing records per second. Compare this to the producer’s record-send-rate on the same topic. If the consumer’s consumed rate consistently trails the producer’s send rate, lag will grow. The ratio between these two rates is a leading indicator of lag accumulation. You can alert on it before lag reaches a critical threshold.
fetch-latency-avg: broker responsiveness seen by the client
kafka.consumer:type=consumer-fetch-manager-metrics,client-id={client-id}
Attribute: fetch-latency-avg
This measures the average time the consumer waits for the broker to respond to a fetch request. A sudden increase in fetch-latency-avg often precedes a lag spike and points to broker-side pressure rather than slow consumer processing logic. Distinguishing between “slow consumer” and “slow broker” is critical for deciding whether to scale consumers or investigate broker health.
Offset commit metrics
kafka.consumer:type=consumer-coordinator-metrics,client-id={client-id}
Attribute: commit-rate
A low or zero commit rate indicates the consumer is not making progress. This can signal a processing bottleneck, a crash loop, or a rebalance in progress. Alert on commit rate dropping to zero for more than one polling interval on any critical consumer group.
Why offset-based lag can mislead you
One insight that most monitoring guides miss: offset-based consumer lag measures the number of messages the consumer is behind, but it says nothing about time. A lag of 1 million messages on a topic producing 500 messages per second means 33 minutes of delay. The same lag of 1 million messages on a topic producing 10,000 messages per second means less than 2 minutes of delay.
For time-sensitive pipelines, convert lag to estimated time-to-catch-up by dividing current lag by the consumer’s records-consumed-rate. This gives a much more operationally relevant signal than raw offset lag.
Producer Metrics: What to Monitor and Why
record-send-rate: throughput baseline
kafka.producer:type=producer-metrics,client-id={client-id}
Attribute: record-send-rate
This is the number of records sent per second. A sudden drop in record-send-rate without a corresponding drop in application traffic means the producer is backing off, retrying, or experiencing errors. Combine it with record-error-rate to distinguish between a healthy throughput reduction (less incoming traffic) and a problematic one (errors causing producer stall).
request-latency-avg and request-latency-max
kafka.producer:type=producer-metrics,client-id={client-id}
Attribute: request-latency-avg
Attribute: request-latency-max
These measure how long the producer waits for a broker acknowledgment after sending a batch. Normal values depend on your acks configuration. With acks=1, latency is typically under 10ms on a healthy cluster. With acks=all (or acks=-1), latency depends on replication time across all in-sync replicas and can be 20-50ms under normal conditions.
A sustained request-latency-avg above 200ms with acks=all points to ISR lag on follower replicas. A spike to several seconds typically indicates a leader election in progress or broker overload.
record-error-rate: delivery failures
kafka.producer:type=producer-metrics,client-id={client-id}
Attribute: record-error-rate
This is the rate of records that failed delivery after exhausting all retries. Any non-zero value on a topic with acks=all means data loss. For most production use cases, record-error-rate should be alerted at any value above zero on critical topics.
record-retry-rate: retry pressure
kafka.producer:type=producer-metrics,client-id={client-id}
Attribute: record-retry-rate
Retries are normal during transient broker issues, but a persistently high record-retry-rate alongside low record-error-rate means messages are eventually getting through but with degraded latency. This is the pattern to watch during rolling restarts or leader elections: retries spike, but errors stay near zero when the cluster is healthy.
batch-size-avg and compression-rate-avg
kafka.producer:type=producer-metrics,client-id={client-id}
Attribute: batch-size-avg
Attribute: compression-rate-avg
batch-size-avg tells you how efficiently the producer is batching records. A batch size well below batch.size (default 16KB) means records are being sent before batches fill, which reduces throughput efficiency. Increasing linger.ms from 0 to 5-20ms typically increases average batch size significantly on high-throughput topics.
compression-rate-avg measures how much compression is reducing message size. A value of 1.0 means no compression benefit. For topics with repetitive JSON payloads, snappy or lz4 compression typically achieves 0.3-0.5 compression ratios, directly reducing broker storage and replication bandwidth.
buffer-available-bytes: backpressure signal
kafka.producer:type=producer-metrics,client-id={client-id}
Attribute: buffer-available-bytes
This measures how much space remains in the producer’s send buffer (controlled by buffer.memory, default 32MB). When buffer-available-bytes approaches zero, KafkaProducer.send() blocks and eventually throws a TimeoutException. This is the first sign of sustained producer backpressure — the producer is generating records faster than the broker can acknowledge them.
For related topics covering the infrastructure layer that Kafka runs on, understanding what infrastructure monitoring covers provides useful context on where Kafka-specific signals fit within a broader observability strategy.
Key Producer and Consumer Configuration Parameters That Affect Metrics
Understanding why a metric behaves the way it does requires knowing which configuration parameters control the behavior it measures.
Consumer configuration
fetch.max.bytes(default 50MB): Maximum data returned in a single fetch. Too low on high-throughput topics limits records-consumed-rate.max.poll.records(default 500): Maximum records returned perpoll()call. If your processing logic takes more thanmax.poll.interval.msper batch, the consumer is kicked out of the group, causing a rebalance and temporary lag spike.max.poll.interval.ms(default 300,000ms): Maximum time between polls before the consumer is considered failed. This is the most common cause of unexpected consumer group rebalances on topics with slow message processing.fetch.min.bytes(default 1): Minimum data the broker waits to accumulate before responding to a fetch. Increasing this to 1KB-64KB reduces fetch request rate and improves throughput on low-traffic topics.
Producer configuration
acks(default 1): Acknowledgment policy.acks=allprotects against data loss but increasesrequest-latency-avg.retries(default 2147483647): Number of retry attempts. Alongsidedelivery.timeout.ms, this controls how long a message can stay in the retry queue beforerecord-error-rateincrements.linger.ms(default 0): Time to wait before sending a partially filled batch. Setting to 5ms typically increasesbatch-size-avgandcompression-rate-avgon busy topics.compression.type(default none): snappy, lz4, gzip, or zstd. Affectscompression-rate-avgand directly impacts broker storage and network utilization.
Best Practices for Kafka Java Client Monitoring
Set per-topic lag thresholds, not cluster-wide ones
A lag of 100,000 messages on a user-activity analytics topic is probably fine. The same lag on a fraud detection pipeline is a P1 incident. Define thresholds per consumer group and per topic based on the production rate and the business tolerance for processing delay. A useful formula: alert_threshold = production_rate_per_second × max_acceptable_delay_seconds.
Alert on lag growth rate, not just absolute lag
Absolute lag is a lagging indicator. By the time lag reaches your threshold, the consumer has been struggling for minutes. Instead, alert on rate of lag change: if records-lag-max increases by more than 10,000 per minute for three consecutive minutes, something is wrong regardless of the current absolute value. This catches consumer stalls much earlier.
Combine client metrics with broker metrics
Client-side fetch-latency-avg spikes point to broker pressure. Broker-side UnderReplicatedPartitions spikes explain why fetch latency is rising. Cross-correlating client and broker metrics is the fastest path to root cause during a Kafka incident. Keep both in the same monitoring system so you can look at them on the same timeline.
Monitor consumer group membership changes
Rebalances cause lag spikes. Every time a consumer joins or leaves a group, partitions are reassigned and consumption pauses. Track kafka.consumer:type=consumer-coordinator-metrics,client-id={client-id} for join-rate and sync-rate. Frequent rebalances (more than once every few minutes) indicate consumer instability – usually caused by slow poll() loops, GC pauses, or deployment churn.
Use structured client IDs
Kafka client metrics are scoped by client.id. If your application creates producers or consumers with default or auto-generated client IDs, your metrics are unlabeled and unqueryable by service. Set explicit client.id values that encode the service name, environment, and consumer group. For example: payment-service-prod-consumer-group-a. This makes metric queries in Prometheus significantly more useful.
Export metrics at the right frequency
JMX metrics are computed as rolling averages internally by Kafka. The default window is 30 seconds. Scraping more frequently than every 15-30 seconds does not give you higher resolution. It just gives you the same rolling average sampled more often. Match your Prometheus scrape interval to your alerting needs: 30s for most metrics, 15s if you need faster lag detection on latency-critical pipelines.
For teams building proactive monitoring on top of Kafka pipelines, pairing client metrics with synthetic monitoring that validates end-to-end message flow is a complementary approach. Synthetic checks can verify that a message produced to a topic is consumed and processed within an expected time window.
Tools and Implementation for Kafka Java Client Monitoring
Prometheus + Grafana + Kafka Lag Exporter
The most widely deployed open source stack for Kafka client monitoring combines:
- Prometheus JMX Exporter as a Java agent inside each producer and consumer instance
- Kafka Lag Exporter (from Lightbend, now community-maintained) for broker-side consumer group lag, covering offline consumers that JMX cannot reach
- Grafana for dashboards with pre-built community dashboards available at grafana.com/grafana/dashboards for Kafka consumers
This stack requires meaningful operational investment: you manage the Prometheus server, retention, alerting rules (Alertmanager), and dashboard maintenance. For teams already running Prometheus for Kubernetes monitoring, the incremental cost is low. For teams starting fresh, expect a week or more to reach production-ready coverage.
Confluent Control Center
Confluent Platform includes Control Center, which provides consumer lag monitoring through its UI and through JMX MBeans. The consumer-lag-offset MBean tracks the difference between the last offset stored by the broker and the last committed offset per consumer group, client, topic, and partition.
Confluent Control Center also supports consumer latency monitoring and alert triggers for consumer lag thresholds. Note that the consumer lag emitter requires explicit configuration: set confluent.consumer.lag.emitter.enabled=true and configure confluent.consumer.lag.emitter.interval.ms (default 60,000ms) in the broker properties file.
One important limitation: you cannot monitor consumer lag for consumers that use the `assign()` method rather than subscribe(). The coordinator does not manage assignments for assign()-based consumers, so the lag emitter has no visibility into their offset state.
Datadog
Datadog’s Kafka integration collects consumer lag and producer metrics through JMX, with pre-built dashboards and alerting. It handles both broker and client metrics in one place. The practical cost concern: Datadog’s APM and infrastructure monitoring starts at $31/host/month for APM. On a 20-host Kafka cluster with 30 consumer service instances, that is $1,550/month for the monitoring hosts alone, before logs or custom metrics.
Pricing based on publicly available information. Verify current rates at the Datadog pricing page before budgeting.
CubeAPM

CubeAPM covers Kafka monitoring as part of its infrastructure monitoring module, which explicitly lists message queues and streaming platforms including Kafka among its supported systems. It collects Kafka metrics, including consumer lag, throughput, and broker health signals and correlates them with APM traces and logs from the same services producing and consuming messages.
For a payment service where the Java producer is instrumented with OpenTelemetry and the consumer is monitored via Prometheus-compatible Kafka metrics, CubeAPM lets you trace a slow transaction end to end: from the HTTP request that triggered a Kafka produce call, through the broker, to the consumer’s processing span. When consumer lag spikes coincide with a specific batch of slow spans, you can identify whether the bottleneck is in the producer, the broker, or the consumer processing logic; all from one platform.
CubeAPM runs inside your own VPC or on-premises infrastructure, which matters for Kafka pipelines that carry sensitive data (payments, healthcare events, user PII). Telemetry never leaves your environment. Pricing is $0.20/GB of data ingested with no per-host or per-seat fees, which makes costs predictable as your Kafka consumer fleet scales. For a team running 50 Kafka-adjacent services ingesting approximately 5TB/month of combined traces, logs, and metrics, that works out to roughly $750/month total.
Delhivery, which runs high-volume logistics pipelines on Kafka, documented 75% savings after replacing three separate monitoring tools with CubeAPM. The infrastructure monitoring feature page notes explicit support for Kafka alongside RabbitMQ, Redis, and AWS messaging services like MSK and AmazonMQ.
For teams evaluating purpose-built options, top Kafka monitoring tools covers the current landscape in more detail, including tools that focus specifically on broker-side metrics versus client-side observability.
Quick comparison: Kafka Java client monitoring tools
| Tool | Deployment | Consumer Lag | Producer Metrics | APM Correlation | Pricing |
|---|---|---|---|---|---|
| Prometheus + Grafana | Self hosted | Via JMX Exporter + Lag Exporter | Via JMX Exporter | No (separate tool) | Free, ops overhead |
| Confluent Control Center | SaaS or self hosted | Native, MBean-based | Partial | No | Included with Confluent Platform |
| Datadog | SaaS only | JMX integration | JMX integration | Yes | From $31/host/month |
| CubeAPM | Self hosted (BYOC) | Via Prometheus/OTel | Via Prometheus/OTel | Yes, full trace correlation | $0.15/GB, no seat fees |
Feature availability may vary by plan tier. Verify current feature sets on each vendor’s official documentation.
Conclusion
Kafka Java client monitoring gives you the signals that broker metrics alone cannot provide: whether your consumers are actually processing messages at an acceptable rate, whether your producers are delivering reliably, and whether configuration choices like linger.ms, max.poll.records, or acks are creating measurable performance tradeoffs. The JMX metric names covered in this guide, records-lag-max, records-lag per partition, record-send-rate, request-latency-avg, and record-error-rate, form the core of any production monitoring setup. Collecting them via the Prometheus JMX Exporter, setting per-topic thresholds based on production rate rather than raw offsets, and correlating client metrics with broker health signals will catch most Kafka pipeline problems before they surface as user-visible failures.
Disclaimer: The information in this article reflects the latest details available at the time of publication and may change as technologies and products evolve. Features, pricing, and plan limits can change over time. Always verify the latest information directly with the vendor before making purchasing or deployment decisions.
Frequently Asked Questions
What is consumer lag in Kafka?
Consumer lag is the difference between the latest offset on a Kafka partition and the last committed offset for a consumer group. It represents the number of messages waiting to be consumed. A lag of zero means the consumer is fully caught up. Lag grows when a consumer processes messages slower than the producer writes them, or when a consumer is offline entirely.
Which JMX metric shows Kafka consumer lag?
The primary JMX metric is `records-lag-max` at `kafka.consumer:type=consumer-fetch-manager-metrics,client-id={client-id}`. It returns the maximum lag across all partitions assigned to that consumer instance. For per-partition detail, use `records-lag` with the topic and partition labels included in the MBean path.
Why does consumer lag spike during a Kafka rebalance?
During a rebalance, partition assignments are redistributed across the consumer group. While the rebalance is in progress, no consumer reads from the affected partitions. Messages continue arriving from producers, so lag accumulates until the new assignments are finalized and consumers resume polling. Rebalances triggered by slow processing (exceeding `max.poll.interval.ms`) can create repeated lag spikes if the root cause is not resolved.
What causes high producer request latency in Kafka?
High `request-latency-avg` usually indicates one of three conditions: broker overload causing slow acknowledgment, ISR lag on follower replicas when using `acks=all`, or network saturation between the producer and the broker. Distinguish between these by checking broker-side metrics concurrently. If `UnderReplicatedPartitions` is non-zero at the same time as producer latency rises, ISR lag is the most likely cause.
Can offset-based consumer lag be misleading?
Yes. Offset lag counts messages, not time. A lag of 1 million messages means very different things on a topic producing 100 messages per second versus one producing 50,000 messages per second. For time-sensitive pipelines, calculate estimated catch-up time by dividing current lag by the consumer’s `records-consumed-rate`. This gives a more operationally useful signal than raw message count.
How do I monitor Kafka consumer lag when a consumer is offline?
JMX metrics from the consumer client disappear when the consumer process stops. To monitor offline consumer groups, use broker-side tooling: `kafka-consumer-groups.sh –describe` queries the broker’s offset storage directly, or deploy a dedicated exporter like Kafka Lag Exporter that polls the broker’s consumer group offsets on a schedule and exposes them to Prometheus regardless of whether consumer instances are running.
What is a safe threshold for Kafka consumer lag alerts?
There is no universal threshold. Define alert thresholds per consumer group based on your topic’s production rate and your application’s acceptable processing delay. A practical formula: `alert_threshold = production_rate_per_second × max_acceptable_delay_in_seconds`. For a fraud detection pipeline tolerating no more than 60 seconds of delay at 500 messages per second, set the alert at 30,000 messages. Review and adjust thresholds after every significant traffic pattern change.