









Spring Boot applications generate massive amounts of runtime data: request latencies, JVM heap usage, database connection pool states, HTTP error rates. Without proper monitoring, a memory leak can silently degrade performance for hours, or a slow database query can cascade across services before anyone notices the root cause. Spring Boot Actuator exposes production-ready endpoints for health checks and metrics. OpenTelemetry provides vendor-neutral instrumentation for traces, logs, and metrics that works with any observability backend. Together, they give you full visibility into application behavior without locking you into proprietary agents.
This guide walks through setting up both Actuator and OpenTelemetry in a Spring Boot application, configuring metrics and trace export, connecting to an observability backend, and troubleshooting the most common integration problems teams hit in production.
Prerequisites
Before starting this setup, ensure you have the following:
- Spring Boot 3.2 or later (Spring Boot 4.0 includes native OpenTelemetry starter support)
- Java 17 or later
- Maven or Gradle for dependency management
- Basic understanding of Spring Boot application structure
- Access to an observability backend (Prometheus, Grafana, Jaeger, or a unified platform like CubeAPM)
- Terminal access and ability to restart your application
Step 1: Add Dependencies for Actuator and OpenTelemetry
Spring Boot Actuator is the foundation for exposing metrics, health checks, and runtime information. OpenTelemetry provides the instrumentation layer for distributed tracing and telemetry export.
For Maven, add these dependencies to your pom.xml:
<dependencies>
    <!-- Spring Boot Actuator -->
    <dependency>
        <groupId>org.springframework.boot</groupId>
        <artifactId>spring-boot-starter-actuator</artifactId>
    </dependency>

    <!-- Micrometer for metrics registry -->
    <dependency>
        <groupId>io.micrometer</groupId>
        <artifactId>micrometer-registry-prometheus</artifactId>
    </dependency>

    <!-- OpenTelemetry Spring Boot Starter -->
    <dependency>
        <groupId>io.opentelemetry.instrumentation</groupId>
        <artifactId>opentelemetry-spring-boot-starter</artifactId>
        <version>2.14.0</version>
    </dependency>
</dependencies>For Gradle, add these to your build.gradle:
The spring-boot-starter-actuator enables built-in health and metrics endpoints. micrometer-registry-prometheus allows Actuator metrics to be scraped by Prometheus or exported to any OpenTelemetry compatible backend. The OpenTelemetry starter automatically instruments HTTP requests, database calls, and external service interactions without requiring code changes.
After adding dependencies, rebuild your project:
dependencies {
    implementation 'org.springframework.boot:spring-boot-starter-actuator'
    implementation 'io.micrometer:micrometer-registry-prometheus'
    implementation 'io.opentelemetry.instrumentation:opentelemetry-spring-boot-starter:2.14.0'
}mvn clean installor
gradle buildStep 2: Configure Actuator Endpoints and Metrics
By default, Spring Boot Actuator exposes only the /actuator/health endpoint publicly. You need to enable additional endpoints for metrics, Prometheus scraping, and environment information.
Add this configuration to your application.properties:
# Expose all actuator endpoints
management.endpoints.web.exposure.include=health,metrics,prometheus,info,env
# Enable Prometheus metrics export
management.metrics.export.prometheus.enabled=true
# Enable detailed health information
management.endpoint.health.show-details=always
# Application metadata for observability
management.info.env.enabled=true
spring.application.name=my-spring-boot-appOr in application.yml:
management:
  endpoints:
    web:
      exposure:
        include: health,metrics,prometheus,info,env
  metrics:
    export:
      prometheus:
        enabled: true
  endpoint:
    health:
      show-details: always
  info:
    env:
      enabled: true
spring:
  application:
name: my-spring-boot-appThis configuration does four things. First, it exposes the /actuator/prometheus endpoint so Prometheus can scrape metrics directly. Second, it enables detailed health checks that show database connection status, disk space, and custom health indicators. Third, it makes environment and application info available at /actuator/info. Fourth, it sets a service name that will appear in traces and metrics.
Start your application and verify the endpoints are accessible:
curl http://localhost:8080/actuator/health
curl http://localhost:8080/actuator/prometheusThe /actuator/health response should show "status":"UP" along with detailed component health. The /actuator/prometheus endpoint should return metrics in Prometheus text format, including JVM memory, HTTP request counts, and database connection pool stats.
Step 3: Configure OpenTelemetry for Distributed Tracing
OpenTelemetry requires an exporter configuration to send traces to your observability backend. The most common export protocol is OTLP (OpenTelemetry Protocol), which works with Jaeger, Tempo, and infrastructure monitoring platforms like CubeAPM.
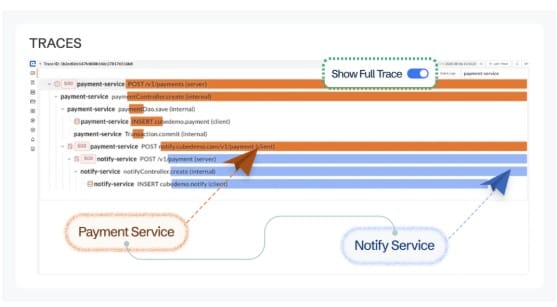
Add OpenTelemetry exporter configuration to application.properties:
# OpenTelemetry OTLP exporter endpoint
otel.exporter.otlp.endpoint=http://localhost:4317
otel.exporter.otlp.protocol=grpc
# Service identification
otel.resource.attributes.service.name=${spring.application.name}
otel.resource.attributes.service.namespace=production
otel.resource.attributes.deployment.environment=prod
# Enable automatic instrumentation
otel.instrumentation.spring-webmvc.enabled=true
otel.instrumentation.jdbc.enabled=true
otel.instrumentation.micrometer.enabled=trueOr in application.yml:
otel:
  exporter:
    otlp:
      endpoint: http://localhost:4317
      protocol: grpc
  resource:
    attributes:
      service.name: ${spring.application.name}
      service.namespace: production
      deployment.environment: prod
  instrumentation:
    spring-webmvc:
      enabled: true
    jdbc:
      enabled: true
    micrometer:
enabled: trueThis configuration sets the OTLP collector endpoint where traces will be sent. The service name, namespace, and environment tags are critical because they appear in every trace and allow filtering by service or environment in your observability UI. The instrumentation flags enable automatic tracing for Spring MVC controllers, JDBC database queries, and Micrometer metrics correlation.
If you are using Grafana Cloud, Honeycomb, or another SaaS backend, replace the endpoint with the vendor-provided OTLP ingestion URL and add authentication headers:
otel.exporter.otlp.endpoint=https://otlp.vendor.com:4317
otel.exporter.otlp.headers.Authorization=Bearer YOUR_API_KEYThe OpenTelemetry starter automatically instruments common libraries without code changes. It captures HTTP request spans, database query durations, external API calls, and exception stack traces. Every incoming request generates a trace ID that propagates across microservices, allowing you to follow a single user request through dozens of backend services.
Step 4: Enable Micrometer Metrics Export to OpenTelemetry
Spring Boot uses Micrometer as its metrics facade. By default, Micrometer metrics are available at /actuator/prometheus but are not automatically exported via OpenTelemetry. To send Actuator metrics through the same OTLP pipeline as traces, enable the Micrometer OpenTelemetry bridge.
Add this property to application.properties:
otel.instrumentation.micrometer.enabled=trueOr in application.yml:
otel:
  instrumentation:
    micrometer:
enabled: trueThis single flag tells the OpenTelemetry Java agent to read Micrometer metrics and export them via OTLP alongside traces. Without this, you would need separate scrape endpoints for Prometheus metrics and a separate trace collector — enabling this unifies both signals into one export pipeline.
Restart your application and generate some traffic:
curl http://localhost:8080/actuator/health
curl http://localhost:8080/your-api-endpointCheck your observability backend UI. You should see traces appearing with spans for HTTP requests, database queries, and any external service calls. Metrics like http.server.requests, jvm.memory.used, and jdbc.connections.active should now be visible in the same platform.
Step 5: Verify Metrics and Traces in Your Observability Backend
Connecting Spring Boot to an observability backend completes the monitoring loop. This step assumes you have Prometheus and Jaeger running locally, or access to a unified platform like CubeAPM that ingests both metrics and traces via OpenTelemetry.
For local Prometheus scraping, add this scrape configuration to prometheus.yml:
scrape_configs:
  - job_name: 'spring-boot-app'
    metrics_path: '/actuator/prometheus'
    static_configs:
- targets: ['localhost:8080']Restart Prometheus and verify the target is being scraped. Query http_server_requests_seconds_count in the Prometheus UI to confirm HTTP request metrics are flowing.
For Jaeger trace verification, ensure your OTLP endpoint points to Jaeger’s OTLP collector (default port 4317). Open the Jaeger UI at http://localhost:16686, select your service name, and search for traces. Each trace should show the full request path with timing breakdowns for controller methods, database queries, and external API calls.
If you are using CubeAPM or another unified observability platform, configure the OTLP endpoint to point to the platform’s ingestion URL. CubeAPM automatically correlates traces with logs and metrics, so you can click a slow trace span and immediately see the associated database query logs or JVM heap pressure at that moment. This correlation is only possible when traces, logs, and metrics flow through the same telemetry pipeline.
For teams running distributed systems, what is real user monitoring becomes relevant here as well; frontend RUM data can be correlated with backend traces to see the full user journey from browser click to database query.
Step 6: Add Custom Metrics and Custom Spans
Actuator and OpenTelemetry provide automatic instrumentation, but production applications often need custom metrics and custom trace spans for business-specific logic.
To add a custom metric, inject the MeterRegistry bean and create counters, gauges, or timers:
import io.micrometer.core.instrument.MeterRegistry;
import org.springframework.stereotype.Service;
@Service
public class OrderService {
    private final MeterRegistry meterRegistry;
    public OrderService(MeterRegistry meterRegistry) {
        this.meterRegistry = meterRegistry;
    }
    public void processOrder(String orderId) {
        meterRegistry.counter("orders.processed", "status", "success").increment();
        // business logic here
    }
}This custom counter appears in /actuator/prometheus and is automatically exported via OTLP if Micrometer instrumentation is enabled.
To add a custom trace span, inject the OpenTelemetry Tracer bean and create spans manually:
import io.opentelemetry.api.trace.Span;
import io.opentelemetry.api.trace.Tracer;
import org.springframework.stereotype.Service;
@Service
public class PaymentService {
    private final Tracer tracer;
    public PaymentService(Tracer tracer) {
        this.tracer = tracer;
    }
    public void processPayment(String paymentId) {
        Span span = tracer.spanBuilder("payment.process").startSpan();
        try {
            // payment processing logic
            span.setAttribute("payment.id", paymentId);
            span.setAttribute("payment.status", "completed");
        } finally {
            span.end();
        }
    }
}Custom spans allow you to isolate specific business operations in traces. When debugging a slow checkout flow, a custom span around payment processing makes it immediately clear whether the delay is in the payment gateway call or in fraud detection logic.
Troubleshooting Common Issues
Metrics not appearing in Prometheus: Verify that management.metrics.export.prometheus.enabled=true is set and that /actuator/prometheus is accessible. Check your Prometheus prometheus.yml scrape configuration to confirm the target endpoint matches your application port and path.
Traces not appearing in Jaeger or observability backend: Confirm the OTLP endpoint is reachable from your application. Test connectivity with telnet localhost 4317 or curl http://localhost:4317. Verify that otel.exporter.otlp.protocol=grpc matches the protocol your collector expects; some backends require http/protobuf instead of grpc.
Micrometer metrics not exported via OpenTelemetry: This is the most common issue reported on GitHub. Add otel.instrumentation.micrometer.enabled=true to your configuration. Without this flag, Actuator metrics remain available only at /actuator/prometheus and are not sent via OTLP. The property was introduced in OpenTelemetry Java 2.14.0 and is required for metric export to work.
High memory usage after enabling OpenTelemetry: OpenTelemetry auto-instrumentation adds overhead. If memory usage spikes, reduce the trace sampling rate by adding:
otel.traces.sampler=parentbased_traceidratio
otel.traces.sampler.arg=0.1This samples 10% of traces instead of 100%, reducing memory and network overhead while maintaining visibility into most production traffic patterns.
Database query spans missing in traces: Ensure otel.instrumentation.jdbc.enabled=true is set. If using a custom DataSource, verify it is wrapped by OpenTelemetry instrumentation. Some connection pooling libraries require explicit configuration to propagate trace context.
Custom spans not appearing in traces: Verify the Tracer bean is correctly injected. If using manual span creation, ensure span.end() is called; spans that are never closed do not get exported. Wrap custom span logic in a try-finally block to guarantee span completion even when exceptions occur.
Disclaimer: Feature availability and configuration properties may vary by Spring Boot version and OpenTelemetry Java agent release. Verify current configuration options in each library’s official documentation.
Frequently Asked Questions
How can I use OpenTelemetry with Spring Boot?
Add the `opentelemetry-spring-boot-starter` dependency, configure the OTLP exporter endpoint in `application.properties`, and enable automatic instrumentation for Spring MVC, JDBC, and Micrometer. The starter provides zero code instrumentation for most common frameworks.
How does a Spring Boot actuator help with monitoring and metrics?
Actuator exposes production ready endpoints for health checks, metrics, environment info, and application state. It integrates with Micrometer to publish JVM metrics, HTTP request counts, database connection pool stats, and custom business metrics in a vendor neutral format.
How to set up an actuator in a Spring Boot?
Add `spring-boot-starter-actuator` to your dependencies and configure `management.endpoints.web.exposure.include` to enable specific endpoints. Enable Prometheus export with `management.metrics.export.prometheus.enabled=true` to make metrics scrapable.
What dependencies are needed to enable monitoring in Spring Boot?
You need `spring-boot-starter-actuator` for metrics and health endpoints, `micrometer-registry-prometheus` for Prometheus format export, and `opentelemetry-spring-boot-starter` for distributed tracing. These three dependencies provide full monitoring coverage without additional code changes.
Can I use OpenTelemetry with Spring Boot Actuator together?
Yes, enabling `otel.instrumentation.micrometer.enabled=true` bridges Actuator metrics into OpenTelemetry export. This sends both Micrometer metrics and OpenTelemetry traces through the same OTLP pipeline to your observability backend.
What is the difference between OpenTelemetry metrics and Actuator metrics?
Actuator metrics use Micrometer as the abstraction layer and are designed for Spring Boot applications. OpenTelemetry metrics follow the OpenTelemetry specification and work across any language or framework. The Micrometer bridge allows Actuator metrics to be exported via OpenTelemetry without changing existing metric definitions.
How do I reduce OpenTelemetry trace overhead in production?
Configure trace sampling to reduce the percentage of traces exported. Use `otel.traces.sampler=parentbased_traceidratio` with a sampling rate like `0.1` to capture 10% of traces. This maintains visibility while reducing memory, CPU, and network overhead at scale.