










Java applications power critical enterprise systems, financial platforms, and microservices architectures worldwide. When a Java app slows down or crashes in production, the cost compounds fast- lost transactions, degraded user experience, and engineers scrambling through JVM heap dumps without context. The 2025 CNCF Annual Survey found that 73% of organizations now run containerized Java workloads in production, making visibility into JVM behavior more complex and more critical than ever.
Java performance monitoring tools track JVM heap memory, garbage collection pauses, thread deadlocks, CPU hotspots, and application layer errors to help teams catch issues before customers do. This guide compares 10 Java APM tools across pricing models, JVM signal depth, OpenTelemetry compatibility, and deployment options. Each tool is assessed on total cost of ownership, ease of integration with existing Java stacks, and what it misses.
Quick Comparison: 10 Java APM Tools at a Glance
Pricing based on standardized mid-market profile: 50 Java hosts, 15 TB/month telemetry, 30 day retention. Figures are directional estimates from public rate cards, April 2026. Actual costs vary by JVM count, trace volume, retention, and contract discounts.
| Tool | Best For | Pricing Model | OpenTelemetry? | Self Hosted? |
|---|---|---|---|---|
| CubeAPM | On prem teams, cost control, unified APM + logs + traces | $0.20/GB all in | Native | Yes |
| Datadog | Enterprise breadth, multi cloud, 700+ integrations | $31/host/month APM + $0.10/GB logs | Strong | SaaS only |
| New Relic | Managed observability, existing New Relic shops | $0.35/GB + seat fees or CCU model | Strong | SaaS only |
| Dynatrace | AI assisted root cause, large enterprises | Host based + log ingest fees | Partial | On prem option |
| AppDynamics | Business transaction focus, Cisco ecosystems | $50/vCPU core/month+ | Partial | On prem option |
| Elastic APM | Teams already on ELK stack, open source preference | Free OSS, Cloud from $99/month | Partial | Self hosted |
| SigNoz | OpenTelemetry native, self-hosted or cloud | Free OSS, Cloud from $49/month | Native | Yes |
| Grafana | Prometheus/Loki users, custom dashboards | Free OSS, Cloud usage based | Strong | Yes |
| JavaMelody | Lightweight monitoring, small apps, no budget | Free open source | Manual export | Self hosted |
| VisualVM | Local profiling, development, debugging | Free bundled with JDK | Manual export | Local only |
1. CubeAPM
Best for: Engineering teams that need full stack Java monitoring inside their own cloud without SaaS data egress, pricing sprawl, or DIY self-hosting burden.
CubeAPM is a self-hosted, OpenTelemetry native observability platform covering APM, logs, infrastructure, Kubernetes, and error tracking. It runs inside your cloud or on-premises, so there is no data egress and no external dependency during incidents. Recognized as a High Performer in G2’s Spring 2026 APM Grid Report and ranked #4 among the easiest-to-use APM tools on G2.
Key Features
- Full stack Java monitoring: JVM heap, GC pauses, thread states, CPU hotspots, method-level traces
- OpenTelemetry native: works with OpenTelemetry Java agent out of the box, no proprietary instrumentation
- Self-hosted BYOC deployment: data sovereignty by design, compliant with SOC 2 and ISO 27001
- Unlimited retention: no extra charges for keeping traces or logs longer
- AI-based Smart Sampling: retains high-value traces (errors, slow requests) while reducing storage overhead by up to 95%
- Direct engineering support: WhatsApp and Slack channels with response in minutes, not ticket queues
Pricing
$0.20/GB ingested. Single billing dimension means no surprises from host counts, user seats, or metric cardinality. A 50-host Java deployment ingesting 15 TB/month costs approximately $3,000/month before infrastructure.
Pros
- Consistently 70-75% lower cost than enterprise SaaS APM at scale
- Multi-agent compatible: works alongside Datadog, New Relic, Elastic, and Prometheus agents for incremental migration
- Complete data ownership: telemetry never leaves your infrastructure
- Fast onboarding: zero downtime migration documented by multiple customers
Cons
- Requires BYOC or on-prem deployment: your team manages the infrastructure
- No autonomous anomaly detection: AI-based smart sampling is not full AIOps alerting
- SSO and RBAC less mature than enterprise SaaS incumbents
Best for: Teams that prioritize data sovereignty, predictable pricing, and full stack visibility without vendor lock-in.
2. Datadog
Best for: Large enterprises needing deep integration breadth across multi-cloud environments and 1,000+ out-of-the-box integrations.
Datadog is a SaaS only observability platform with strong Java APM capabilities, distributed tracing, and infrastructure monitoring. It offers native Java agent instrumentation and JMX metric collection.
Key Features
- Java APM with distributed tracing and flame graphs
- JVM runtime metrics: heap, non-heap, GC, thread pools
- Integration with Datadog’s broader platform: logs, RUM, synthetics, security
- Pre-built dashboards for Spring Boot, Kafka, Tomcat, and other Java frameworks
- Application Performance Monitoring with service maps and dependency analysis
Pricing
$31/host/month for APM, $0.10/GB log ingest, $1.70/million events indexed. A 50-host Java deployment with 15 TB/month costs approximately $8,500–$12,000/month depending on log indexing and add-ons like RUM or synthetics.
Pros
- Mature product with extensive Java framework support
- Strong ecosystem: 700+ integrations including Kubernetes, AWS, Azure, GCP
- Rich alerting and anomaly detection
Cons
- Per-host pricing compounds fast as infrastructure scales
- Log indexing billed separately from ingest: double billing problem documented on Reddit
- Vendor lock-in: moving off Datadog means rewriting dashboards and alerts
Best for: Enterprises with budget for mature tooling and need for deep cloud integration.
3. New Relic

Best for: Teams already invested in New Relic ecosystem or those prioritizing managed observability over cost.
New Relic offers full-stack observability with Java APM, distributed tracing, and error tracking. It has shifted from per seat pricing to a Compute Capacity Unit model that bills based on telemetry processing volume.
Key Features
- Java agent with automatic instrumentation for major frameworks
- Distributed tracing with code-level visibility
- JVM metrics: heap, GC, thread activity
- Integration with New Relic One platform: logs, infrastructure, synthetics
- NRQL query language for custom analysis
Pricing
$0.40/GB beyond 100 GB free tier. CCU model converts to approximately $0.40/GB but varies by query frequency and data retention. A 50-host Java deployment with 15 TB/month costs approximately $6,000/month before seat fees or enterprise support.
Pros
- Managed platform with no infrastructure overhead
- Strong distributed tracing and error tracking
- Good support for Kubernetes and containerized Java apps
Cons
- CCU billing model is opaque and hard to forecast
- NRQL creates vendor lock-in: every dashboard and alert is non-portable
- Cloud-only architecture: rules out teams with data residency or HIPAA requirements
Best for: Teams willing to trade cost predictability for managed SaaS convenience.
4. Dynatrace
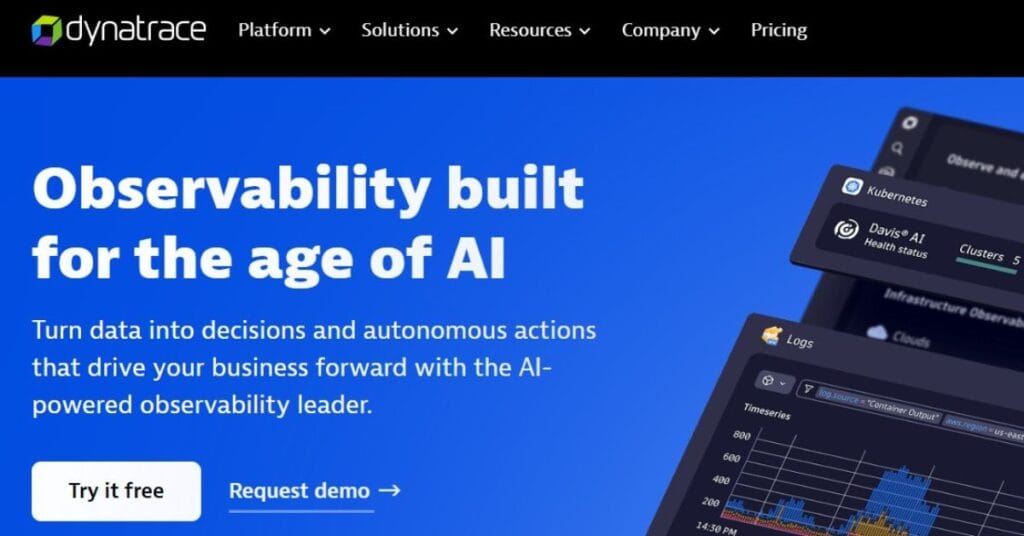
Best for: Large enterprises needing AI-driven root cause analysis and automated dependency mapping.
Dynatrace is an AI powered full stack monitoring platform with OneAgent automatic instrumentation for Java applications. It offers strong root cause analysis and business transaction focus.
Key Features
- OneAgent: automatic Java instrumentation with zero code changes
- AI-driven anomaly detection and root cause analysis
- Real user monitoring and business transaction tracking
- Deep JVM insights: memory leaks, CPU hotspots, thread contention
- Support for hybrid cloud and on-prem deployments
Pricing
Host-based pricing starting around $69/host/month for full stack monitoring. A 50-host Java deployment costs approximately $3,450/month before log ingest fees, which are billed separately at $0.20/GiB.
Pros
- OneAgent simplifies instrumentation across complex Java stacks
- Strong AI capabilities for automated triage
- Excellent support for legacy Java apps and mainframes
Cons
- Expensive at scale: Reddit thread documents bill shock after scaling to 100+ hosts
- Davis AI requires time to train: not useful in early deployment
- Limited OpenTelemetry support compared to newer platforms
Best for: Enterprises with budget for AI-assisted monitoring and complex hybrid environments.
5. AppDynamics
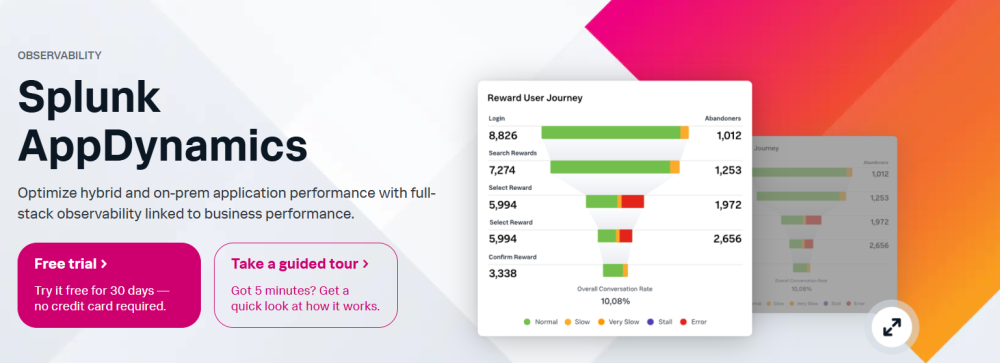
Best for: Cisco-heavy enterprises focusing on business transaction monitoring and application dependency mapping.
AppDynamics, now part of Cisco, offers application performance monitoring with a strong focus on business transactions and code-level diagnostics for Java applications.
Key Features
- Business transaction monitoring with revenue impact tracking
- Java agent with automatic instrumentation
- Application flow maps showing dependencies and bottlenecks
- JVM diagnostics: heap, GC, thread dumps
- On-prem and SaaS deployment options
Pricing
$50/vCPU core/month minimum, typically higher with add-ons. A 50-host Java deployment costs approximately $6,000–$10,000/month depending on core count and feature set.
Pros
- Strong business context: tie performance to revenue and user experience
- Mature Java support for Spring, JBoss, WebLogic, and legacy frameworks
- Good integration with Cisco network infrastructure
Cons
- Expensive: pricing per vCPU core scales poorly with modern containerized workloads
- Complex UI: steep learning curve for new users
- OpenTelemetry support is limited and requires workarounds
Best for: Large enterprises already invested in Cisco infrastructure with budget for premium tooling.
6. Elastic APM
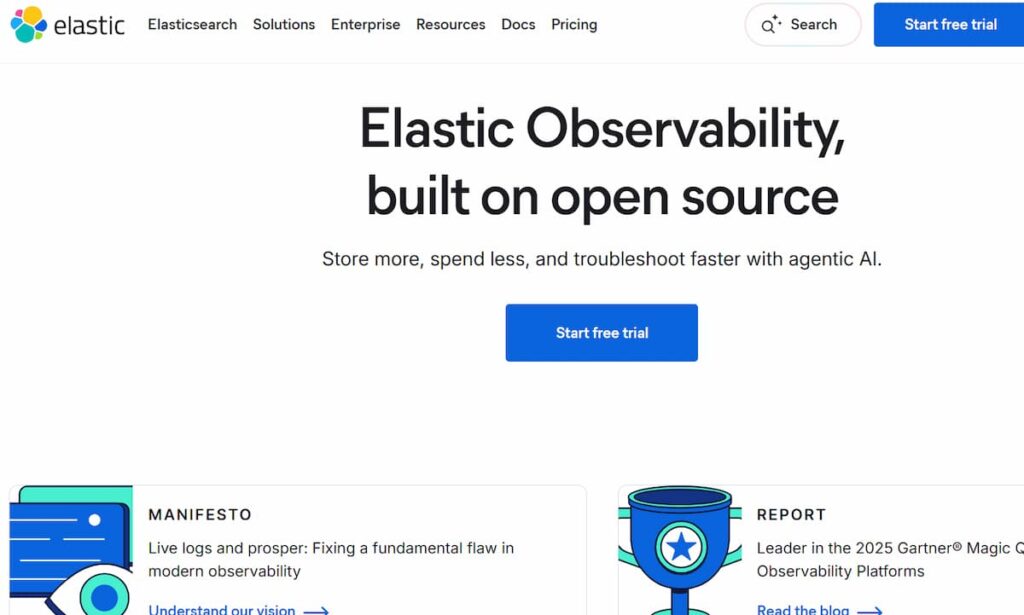
Best for: Teams already running the ELK stack (Elasticsearch, Logstash, Kibana) who want to add APM without introducing a new platform.
Elastic APM is part of the Elastic Stack and provides distributed tracing, error tracking, and JVM monitoring using the Elastic Java agent.
Key Features
- Native integration with Elasticsearch for logs and traces
- Java agent with automatic instrumentation
- Distributed tracing with span visualization in Kibana
- JVM metrics: heap, GC, CPU, thread activity
- Open source and self-hosted options
Pricing
Free for self-hosted open source. Elastic Cloud starts at $99/month for the standard tier. A 50-host Java deployment with 15 TB/month costs approximately $3,000–$5,000/month on Elastic Cloud depending on retention and indexing.
Pros
- Free open source version with full APM features
- Deep Elasticsearch integration: query traces and logs together
- Good support for containerized Java apps
Cons
- Self-hosted ELK requires significant ops overhead: upgrades, scaling, backups
- OpenTelemetry support is partial and requires manual configuration
- Kibana dashboards are powerful but slow with large trace volumes
Best for: Teams already skilled in ELK who prefer open source over SaaS.
7. SigNoz
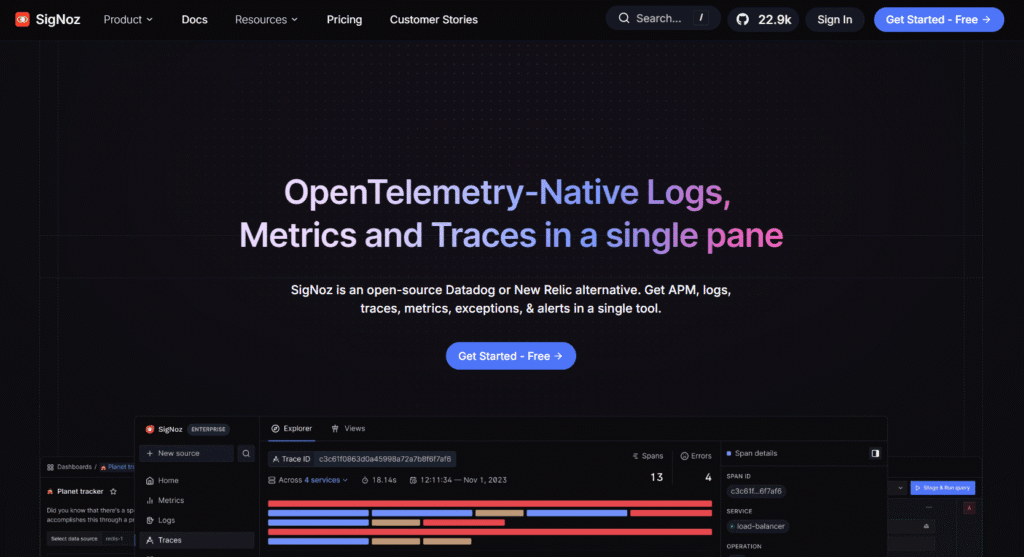
Best for: OpenTelemetry-first teams that want open source APM or self-hosting without heavy DIY burden.
SigNoz is an open source observability platform built natively on OpenTelemetry. It offers distributed tracing, metrics, and logs in a unified UI.
Key Features
- OpenTelemetry native: works with the OpenTelemetry Java agent without modification
- Distributed tracing with trace aggregation and filtering
- JVM metrics via OpenTelemetry JMX receiver
- Self-hosted or SigNoz Cloud options
- Modern UI with fast trace search
Pricing
Free open source. SigNoz Cloud starts at $49/month with usage-based pricing at $0.30/GB.
Pros
- True OpenTelemetry native: no proprietary agents
- Open source gives full control over data and deployment
- Active community and fast development pace
Cons
- Fewer integrations than mature SaaS platforms
- Self-hosted version requires ops effort for scaling and upgrades
- Some users report UI performance issues with high cardinality data
Best for: Teams committed to OpenTelemetry and open source tooling.
8. Grafana
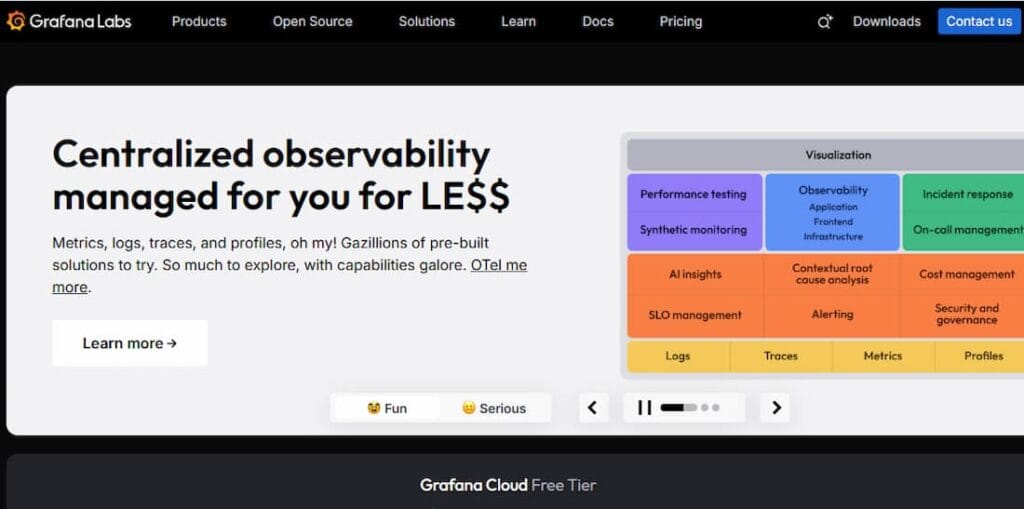
Best for: Teams already using Prometheus, Loki, or Tempo who want unified dashboards for Java monitoring.
Grafana is an open source visualization platform that integrates with Prometheus for metrics, Loki for logs, and Tempo for traces. It requires separate backend components but provides powerful dashboarding.
Key Features
- Unified dashboards for metrics, logs, and traces
- Works with OpenTelemetry Java agent and Prometheus JMX exporter
- Pre built Java dashboards from Grafana community
- Self hosted or Grafana Cloud options
- Strong plugin ecosystem
Pricing
Free open source. Grafana Cloud usage based pricing with free tier and Pro plans starting at $299/month.
Pros
- Highly customizable dashboards
- Strong Prometheus integration for JVM metrics
- Large community with shared dashboard templates
Cons
- Requires assembling and maintaining separate backends: Prometheus, Loki, Tempo
- No native Java agent: relies on OpenTelemetry or Prometheus exporters
- DIY approach means higher ops burden
Best for: Teams skilled in Grafana who prefer flexibility over integrated solutions.
9. JavaMelody
Best for: Small Java applications with no budget for commercial APM and need for basic monitoring.
JavaMelody is a free open source monitoring tool that integrates into Java web applications to track HTTP requests, SQL queries, and JVM metrics.
Key Features
- Embedded monitoring: runs inside your Java app
- HTTP request statistics and response times
- SQL query monitoring and execution counts
- JVM metrics: heap, GC, threads, CPU
- No external dependencies
Pricing
Free open source.
Pros
- Zero cost
- Easy to integrate: add dependency to pom.xml and configure web.xml
- Lightweight: minimal performance overhead
Cons
- Limited distributed tracing: not suitable for microservices
- Basic UI: no advanced analytics or correlation
- No alerting: monitoring only, no proactive notifications
Best for: Small teams monitoring monolithic Java apps with no budget.
10. VisualVM
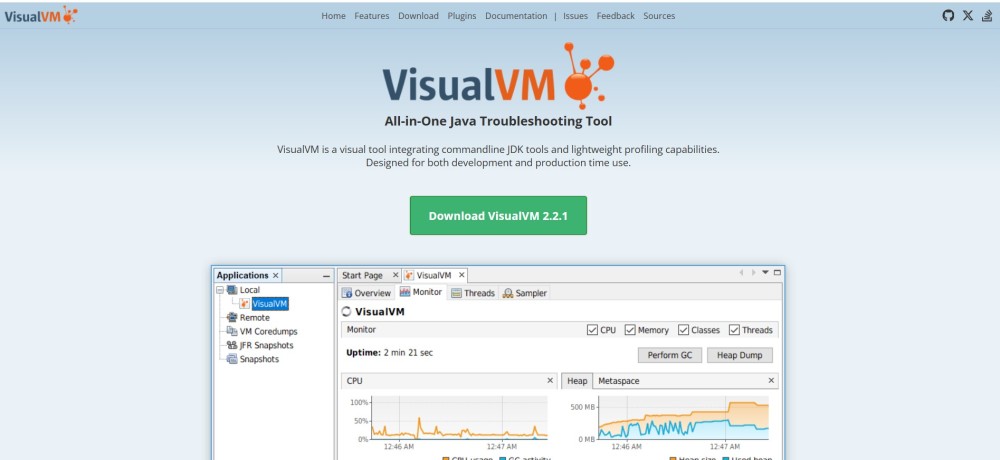
Best for: Local Java application profiling during development and debugging.
VisualVM is a free visual tool bundled with the JDK that provides detailed JVM profiling, heap dumps, and thread analysis.
Key Features
- CPU and memory profiling
- Heap dump analysis
- Thread state visualization
- GC activity monitoring
- Local and remote JVM connection
Pricing
Free bundled with JDK.
Pros
- Free and included with Java development kit
- Deep profiling capabilities
- No installation required for basic use
Cons
- Not designed for production monitoring
- No distributed tracing or multi service visibility
- Manual connection to each JVM: not scalable
Best for: Developers profiling Java apps locally during development.
How to Choose the Right Java APM Tool
Choosing a Java monitoring tool depends on five factors: deployment model, cost structure, OpenTelemetry compatibility, JVM signal depth, and team size.
Deployment model: SaaS vs. self hosted vs. hybrid
SaaS only tools like Datadog and New Relic are fully managed but send all telemetry outside your infrastructure. This creates data egress costs (typically $0.10/GB), raises compliance concerns for regulated industries, and creates a single point of failure during incidents.
Self hosted tools like Elastic APM and SigNoz keep data local but require ops effort for scaling, upgrades, and backups. This trades cost for operational burden.
Hybrid solutions like CubeAPM and Dynatrace offer self hosted deployment with vendor managed upgrades and support. This gives data sovereignty without DIY overhead.
Cost structure: per host vs. per GB vs. per seat
Per host pricing (Datadog, Dynatrace) scales poorly with containerized workloads where pod counts fluctuate. A 50 host Kubernetes cluster auto scaling to 150 hosts during peak traffic triples your monitoring bill in the same window as your traffic spike.
Per GB pricing (CubeAPM, SigNoz Cloud) aligns cost with actual data volume. This is more predictable but requires understanding your telemetry footprint.
Per seat pricing (New Relic) creates a rationing dynamic where junior engineers get locked out of monitoring to control costs.
OpenTelemetry compatibility: native vs. partial vs. none
OpenTelemetry native tools (CubeAPM, SigNoz) work with the OpenTelemetry Java agent without modification. This avoids vendor lock in and makes migration between tools easier.
Partial support (Datadog, New Relic) means the tool can ingest OpenTelemetry data but may require proprietary agents for full feature parity.
No OpenTelemetry support means you are locked into that vendor’s instrumentation library.
JVM signal depth: what metrics matter
All serious Java APM tools track heap memory, garbage collection, and thread states. The differentiators are:
- Method level tracing: can you drill down to the exact method causing latency?
- GC pause correlation: does the tool link GC pauses to application errors or slow requests?
- Thread contention visibility: can you see which threads are blocked and why?
- Memory leak detection: does the tool flag growing heap usage before OutOfMemoryError?
Team size and skill level
Small teams (under 20 engineers) need tools that are fast to deploy and require minimal ops overhead. Better Stack, JavaMelody, and SigNoz Cloud fit this profile.
Mid market teams (20–200 engineers) need predictable pricing and strong support. CubeAPM and Elastic APM balance cost with feature depth.
Large enterprises (200+ engineers) can afford mature SaaS platforms like Datadog and Dynatrace that offer broad integration ecosystems and dedicated account management.
Monitoring Java Applications with CubeAPM
CubeAPM is built specifically for teams that want full stack Java monitoring without sending telemetry outside their cloud. It runs inside your VPC or on premises and correlates JVM metrics with distributed traces, logs, and infrastructure data.
How CubeAPM monitors Java applications
CubeAPM works with the OpenTelemetry Java agent, which auto instruments popular frameworks like Spring Boot, Hibernate, JDBC, and Apache Kafka without code changes. The agent captures distributed traces, JVM runtime metrics, and error context, then forwards everything to CubeAPM’s self hosted backend.
JVM metrics collected include heap memory (used, committed, max), non heap memory, garbage collection frequency and duration, thread count by state (runnable, blocked, waiting), CPU usage, and class loading statistics.
Setting up Java monitoring in CubeAPM
Download the OpenTelemetry Java agent JAR. Add it to your application startup command with CubeAPM’s endpoint configured:
java -javaagent:opentelemetry-javaagent.jar \
  -Dotel.service.name=my-java-service \
  -Dotel.exporter.otlp.endpoint=http://cubeapm-collector:4317 \
-jar my-application.jarCubeAPM auto discovers services, builds service maps, and starts collecting JVM telemetry within minutes. No code changes required.
What makes CubeAPM different for Java monitoring
Unlike SaaS tools that export telemetry to external clouds, CubeAPM keeps all Java traces and logs inside your infrastructure. This eliminates data egress costs (typically $0.10/GB with AWS, GCP, or Azure) and ensures monitoring stays up during network outages.
Smart Sampling retains traces with errors, high latency, or unusual patterns while discarding routine successful requests. This reduces storage by up to 95% without losing signal.
Unlimited retention means you can keep JVM metrics and traces for compliance, capacity planning, or long term trend analysis without extra charges.
Conclusion
Java application monitoring in 2026 comes down to three choices: pay for managed SaaS convenience with tools like Datadog and New Relic, invest ops effort into open source platforms like Elastic APM and Grafana, or get self hosted observability with vendor support through platforms like CubeAPM.
For teams with data sovereignty requirements, unpredictable SaaS pricing, or high telemetry volumes, self hosted solutions deliver better cost control and data ownership. For enterprises with budget and need for broad integrations, mature SaaS platforms offer faster time to value.
The best Java APM tool is the one that fits your deployment model, aligns cost with usage, and gives your team the JVM visibility they need without creating new operational burden.
Disclaimer: The information in this article reflects the latest details available at the time of publication and may change as technologies and products evolve. Features, pricing, and plan limits can change over time. Always verify the latest information directly with the vendor before making purchasing or deployment decisions.
Frequently Asked Questions
What is the difference between Java APM and JVM monitoring?
JVM monitoring tracks runtime metrics like heap memory, garbage collection, and thread states. Java APM includes JVM monitoring plus distributed tracing, error tracking, and correlation with application layer behavior across services.
Do I need to modify my Java code to use APM tools?
Most modern APM tools use automatic instrumentation via Java agents. You add the agent JAR to your startup command and it instruments popular frameworks like Spring Boot, Hibernate, and JDBC without code changes.
How much does Java application monitoring cost?
Cost depends on the pricing model. Per host tools like Datadog charge $31/host/month for APM. Per GB tools like CubeAPM charge $0.15/GB ingested. A 50 host Java deployment typically ingests 10–20 TB/month, resulting in monthly costs between $1,500 and $12,000 depending on the tool.
What is OpenTelemetry and why does it matter for Java monitoring?
OpenTelemetry is an open standard for telemetry collection supported by CNCF. Using OpenTelemetry Java agent means you can switch between APM tools without rewriting instrumentation, avoiding vendor lock in.
Can I monitor Java applications running on Kubernetes?
Yes, all modern APM tools support containerized Java apps. The OpenTelemetry Java agent works in Docker and Kubernetes environments. Tools like CubeAPM and Datadog provide Kubernetes specific dashboards showing pod health, resource limits, and service dependencies.
What Java frameworks are supported by APM tools?
Most APM tools auto instrument Spring Boot, Spring MVC, Hibernate, JDBC, Apache Kafka, Tomcat, Jetty, and other popular frameworks. Check each vendor’s documentation for specific version support.
How do I troubleshoot Java memory leaks with APM?
APM tools track heap memory usage over time and flag growing trends. When heap usage climbs toward max capacity, take a heap dump using tools like VisualVM or Eclipse MAT, then correlate the dump with APM traces to identify which code paths are retaining objects.