










Service mesh adoption continues to accelerate. According to the CNCF Annual Survey 2023, 47% of organizations now use a service mesh in production, up from 27% in 2021. That growth creates a monitoring problem: how do you observe the layer that sits between every service call when it generates massive telemetry volume and operates at wire speed?
Most teams discover this after adopting Istio or Linkerd. The mesh itself becomes a black box. Without proper observability, you cannot see why a request failed, which sidecar introduced latency, or what policy blocked traffic. This guide compares 8 tools built to monitor service meshes across Kubernetes environments.
Each tool is evaluated on cost model, native support for Istio and Linkerd telemetry, deployment options, and signal depth for traces, metrics, and control plane visibility. Pricing figures are sourced from public rate cards as of April 2026.
Quick Comparison: 8 Service Mesh Monitoring Tools at a Glance
| Tool | Best For | Pricing Model | Istio Native? | On Prem? | Signal Depth |
|---|---|---|---|---|---|
| CubeAPM | Full stack observability with service mesh insights | $0.2/GB, unlimited users | ✓ OTel-native | ✓ Yes | Traces, metrics, logs, control plane |
| Kiali | Istio-specific topology and traffic visualization | Free OSS | ✓ Istio-native | ✓ Yes | Topology, metrics, config validation |
| Datadog | Managed service mesh observability with broad integration | Host-based $15–$31/host/mo + add ons | ✓ Strong | ✗ SaaS only | Traces, metrics, RUM, synthetics |
| Dynatrace | AI assisted service mesh monitoring for enterprises | Host-based, starts ~$74/host/mo | ✓ Strong | ✓ Yes | Full stack AI topology, traces |
| New Relic | Managed observability with service mesh layer visibility | $0.40/GB beyond 100 GB free | Partial | ✗ SaaS only | Traces, metrics, limited mesh topology |
| Grafana Stack | Self hosted Prometheus, Tempo, and Loki for mesh telemetry | Free OSS, Cloud from $49/mo | ✓ Native | ✓ Yes | Metrics, traces, logs (DIY assembly) |
| Honeycomb | High cardinality service mesh debugging | Free tier, Pro from $130/mo | ✓ OTel-native | ✗ SaaS only | High cardinality events, traces |
| Elastic APM | Service mesh observability for teams on ELK stack | Free OSS, Cloud from $99/mo | Partial | ✓ Self hosted | Traces, metrics, logs (ELK-centric) |
What Is Service Mesh Monitoring and Why Does It Matter?
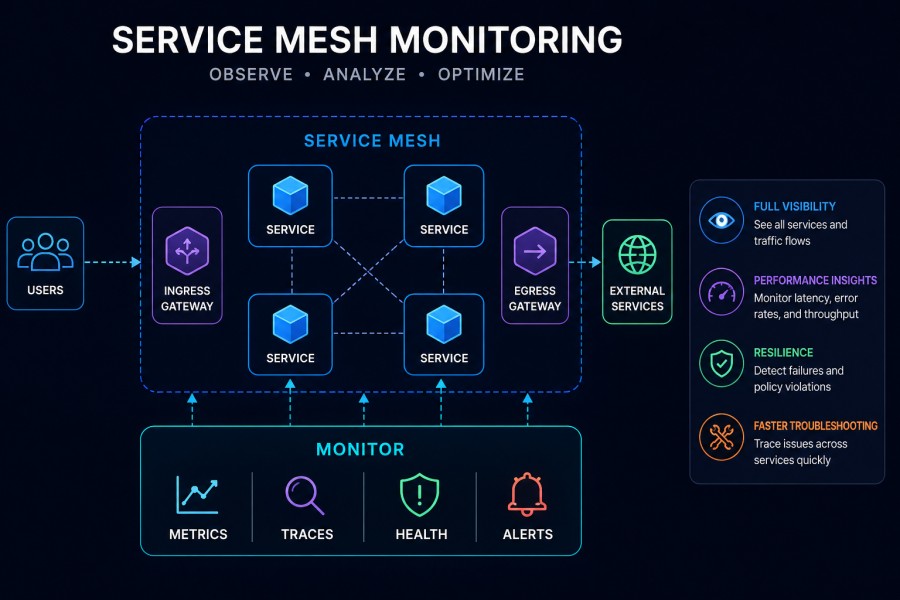
A service mesh is a dedicated infrastructure layer that handles service to service communication in microservices architectures. Tools like Istio, Linkerd, and Consul inject sidecar proxies alongside each service to manage traffic routing, security, and observability.
The mesh generates three categories of telemetry:
Data plane metrics: request rates, latency distributions, error counts per service pair, and connection pool stats from Envoy or Linkerd proxies. These cover what happened at the application layer.
Control plane metrics: configuration sync status, certificate rotation events, policy enforcement logs, and xDS API response times from Istiod or the Linkerd control plane. These cover whether the mesh itself is healthy.
Distributed traces: end to end request flows across services with per-hop latency, showing exactly where time was spent and which mesh policy or retry logic added overhead.
Without proper monitoring, service mesh issues surface as vague user complaints. A policy misconfiguration might silently drop 5% of traffic. A certificate rotation failure might break mTLS without triggering an alert. Sidecar memory leaks might degrade performance for hours before anyone notices.
Service mesh monitoring tools solve this by surfacing mesh-specific signals that general APM platforms miss: per-route traffic splits for canary deployments, mutual TLS verification failures, circuit breaker state changes, and sidecar resource consumption patterns.
1. CubeAPM
Best for: Teams that want full stack observability including service mesh insights without SaaS data egress or per-host pricing sprawl.
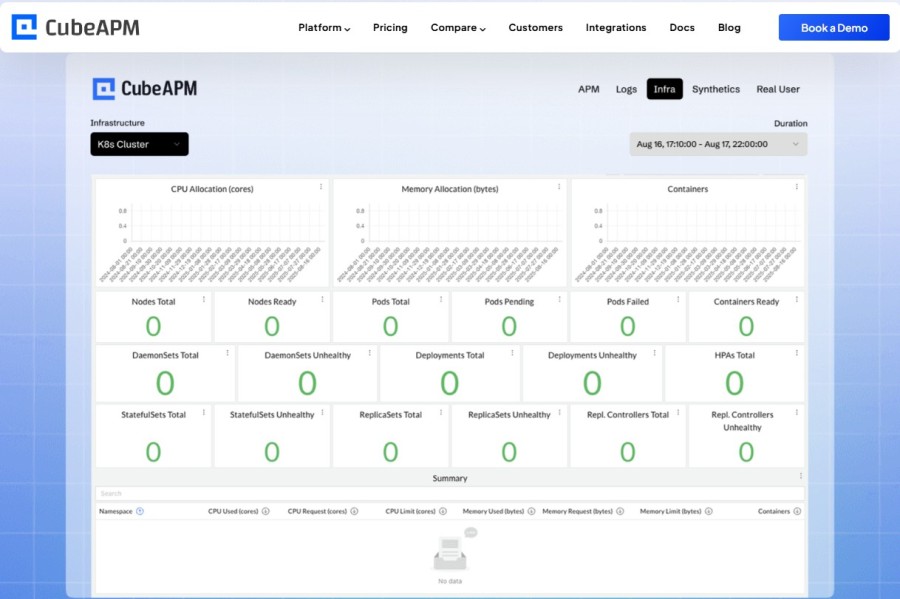
CubeAPM is an OpenTelemetry-native observability platform that runs inside your own cloud or on premises. It covers APM, logs, infrastructure, Kubernetes, and service mesh monitoring in one unified platform. Service mesh telemetry from Istio, Linkerd, or Consul flows directly into CubeAPM via OpenTelemetry collectors with no proprietary agents required.
For service mesh monitoring specifically, CubeAPM surfaces Envoy proxy metrics, Istio control plane health, and distributed traces that show per-hop latency through the mesh layer. Teams can correlate mesh errors with application logs and infrastructure metrics in one query without switching tools.
Key Features:
- Native ingestion of Istio and Linkerd telemetry via OpenTelemetry
- Service graph visualization showing mesh traffic flows with latency overlays
- Envoy proxy metrics for request rates, error counts, and connection pool stats
- Control plane health monitoring for Istiod and Linkerd controller components
- Distributed tracing that correlates mesh layer hops with application code paths
- Alert on mesh-specific conditions like mTLS failures or circuit breaker state changes
Pricing:
$0.2/GB for all ingested data. No per-host fees, no per-user seats, no separate charges for traces or metrics. Unlimited retention included. Self hosted deployment means zero cloud egress costs when monitoring a service mesh inside your own Kubernetes cluster.
Pros:
- Single platform for service mesh, APM, logs, and infrastructure eliminates tool sprawl
- OpenTelemetry-native design makes it compatible with any mesh that exports OTel telemetry
- Self-hosted deployment keeps all mesh telemetry inside your VPC for compliance and cost control
- Unlimited retention with no cold storage penalties supports long-term mesh performance analysis
- Direct engineering support via Slack and WhatsApp during incidents
Cons:
- Requires BYOC or on premises deployment, your team manages the underlying infrastructure
- No autonomous anomaly detection for mesh metrics; alerts require manual threshold configuration
- Less mature service mesh-specific dashboards compared to dedicated tools like Kiali
Best for: Engineering teams running Istio or Linkerd in production who need full observability without SaaS pricing unpredictability or data residency concerns.
2. Kiali
Best for: Istio-specific topology visualization and traffic flow analysis for teams that want a lightweight, purpose-built tool.
Kiali is an open source observability console designed specifically for Istio service meshes. It provides real-time topology graphs, traffic metrics, and configuration validation for Istio deployments. Unlike general purpose APM platforms, Kiali focuses exclusively on mesh layer visibility and integrates directly with Istio’s control plane APIs.
Kiali surfaces the mesh topology as an interactive graph showing services, workloads, and traffic flows. Each edge displays request rates, error percentages, and latency distributions collected from Envoy sidecar metrics. Configuration validation features flag common Istio misconfigurations like missing DestinationRules or conflicting VirtualServices before they cause production issues.
Key Features:
- Real time service topology graph with traffic flow visualization
- Request rate, error rate, and latency metrics per service pair from Envoy telemetry
- Istio configuration validation that flags policy conflicts and missing resources
- Traffic distribution views showing canary rollout percentages and A/B test splits
- Integration with Jaeger or Zipkin for distributed trace correlation
- Namespace-level isolation for multi-tenant Kubernetes clusters
Pricing:
Free and open source. Self-hosted only. No cloud offering or enterprise support tier.
Pros:
- Purpose-built for Istio with deep integration into Istio control plane APIs
- Lightweight deployment with minimal resource overhead compared to full APM platforms
- Real-time topology graph makes mesh traffic patterns immediately visible
- Configuration validation catches common Istio mistakes before they break production
- No vendor lock-in, fully open source with active CNCF community support
Cons:
- Istio-only, does not support Linkerd, Consul, or other service mesh implementations
- No built-in alerting, requires integration with Prometheus Alertmanager for notifications
- Limited log correlation, focused on metrics and topology rather than full observability
- Self-hosted only with no managed option, requires team expertise to run and maintain
Best for: Teams running Istio who want a free, open source tool for mesh topology and configuration validation without adopting a full commercial APM platform.
3. Datadog
Best for: Managed service mesh observability with deep integration across Kubernetes, cloud providers, and 700+ other technologies.
Datadog provides service mesh monitoring as part of its broader observability platform. It ingests Envoy proxy metrics, Istio control plane telemetry, and distributed traces from meshed services. Teams can correlate mesh layer performance with application traces, infrastructure metrics, and logs in one unified view.
Datadog’s service map automatically visualizes mesh traffic flows with latency and error rate overlays. The platform supports both Istio and Linkerd, pulling telemetry via the Datadog agent deployed as a DaemonSet in Kubernetes. Alerts can trigger on mesh-specific conditions like mTLS certificate expiration or sudden drops in inter-service request rates.
Key Features:
- Automatic service mesh discovery and topology mapping for Istio and Linkerd
- Envoy proxy metrics ingestion via Datadog agent with built-in dashboards
- Distributed tracing that correlates mesh layer hops with application code spans
- mTLS certificate expiration monitoring and alerting
- Network performance monitoring that tracks pod-to-pod latency through the mesh
- Integration with over 700 other technologies for full stack correlation
Pricing:
Host-based pricing starts at $15 per host per month for infrastructure monitoring. APM adds $31 per host per month. A 50-node Kubernetes cluster with Istio costs approximately $2,300 per month before adding logs, synthetics, or custom metrics. See Datadog’s pricing page for current rates.
Pros:
- Managed SaaS platform eliminates operational burden of running observability infrastructure
- Deep Kubernetes integration automatically discovers services and mesh components
- Broad ecosystem support covers service mesh, cloud providers, databases, and more
- Built-in dashboards for Istio and Linkerd reduce time to first value
- Strong distributed tracing correlates mesh layer performance with application code
Cons:
- Per-host pricing scales expensively in large Kubernetes clusters with auto-scaling nodes
- SaaS-only architecture makes it unsuitable for air-gapped or highly regulated environments
- Envoy metrics volume can drive up costs quickly without careful sampling configuration
- No unlimited retention, older data moves to indexed archives with retrieval fees
Best for: Large enterprises that prioritize managed services and broad integration coverage over cost optimization and are willing to accept SaaS-only deployment.
4. Dynatrace

Best for: Enterprises that want AI-assisted service mesh monitoring with automatic root cause analysis and minimal manual configuration.
Dynatrace provides full stack observability including service mesh monitoring through its OneAgent technology. The agent automatically discovers Istio and Linkerd deployments, instruments Envoy sidecars, and collects control plane metrics without requiring manual configuration. Dynatrace’s AI engine (Davis) analyzes mesh telemetry to detect anomalies and surface probable root causes.
For service mesh specifically, Dynatrace tracks request flow through the mesh layer, monitors mTLS handshake latency, and alerts on policy enforcement failures. The platform correlates mesh layer issues with application code, infrastructure, and end user experience in a single causation chain.
Key Features:
- Automatic discovery and instrumentation of Istio and Linkerd service meshes
- AI-powered anomaly detection for mesh metrics with probable root cause identification
- Full topology mapping showing service dependencies through the mesh layer
- mTLS performance monitoring including handshake latency and certificate rotation events
- Integration with Kubernetes events to correlate mesh issues with pod restarts or scaling
- Single agent deployment model reduces operational complexity
Pricing:
Host-based pricing starts around $74 per host per month for full stack monitoring. Exact pricing depends on host size, feature usage, and contract terms. Enterprise deployments typically negotiate custom pricing. See Dynatrace’s pricing page for current rates.
Pros:
- AI-driven root cause analysis reduces mean time to resolution for mesh-related incidents
- Automatic instrumentation eliminates manual configuration overhead for new services
- Strong enterprise support with dedicated account teams and SLA guarantees
- Hybrid deployment option supports both SaaS and managed on-premises installations
- Deep integration with ServiceNow, Jira, and other ITSM platforms
Cons:
- Expensive at scale, especially for large Kubernetes clusters with high pod churn
- AI insights require significant data volume to train effectively, less useful for smaller deployments
- Proprietary agent and data model create vendor lock in
- Complex pricing structure makes cost forecasting difficult without vendor engagement
Best for: Large enterprises with budget for premium tooling that want AI-assisted troubleshooting and can commit to Dynatrace’s ecosystem long term.
5. New Relic
Best for: Teams already using New Relic who want to add service mesh visibility without adopting a separate tool.
New Relic provides service mesh monitoring as part of its broader observability platform. It ingests Envoy proxy metrics and distributed traces from Istio and Linkerd deployments. Service mesh telemetry appears in the same UI as application traces, infrastructure metrics, and logs.
New Relic’s service maps show mesh traffic flows with request rates and error percentages. Distributed tracing captures per-hop latency through the mesh layer. The platform supports alerting on mesh-specific conditions like sudden drops in inter-service request success rates.
Key Features:
- Service mesh telemetry ingestion via OpenTelemetry or New Relic agents
- Service dependency maps showing traffic flows through Istio or Linkerd
- Distributed tracing with mesh layer hop visibility
- Envoy proxy metrics dashboards for request rates and connection pool stats
- Alert on mesh health conditions like control plane API response time spikes
- Integration with New Relic’s broader observability platform for full stack correlation
Pricing:
Data ingest pricing at $0.40 per GB beyond the first 100 GB free per month. A typical Istio deployment generating 10 TB of telemetry monthly costs approximately $4,000 in data ingest fees alone. User-based pricing adds $99 to $549 per user per month depending on tier. See New Relic’s pricing page for current rates.
Pros:
- Unified platform eliminates need for separate service mesh monitoring tools
- OpenTelemetry compatibility provides vendor-neutral telemetry ingestion
- Managed SaaS reduces operational overhead for teams without dedicated SRE capacity
- Strong distributed tracing correlates mesh layer performance with application code
Cons:
- Data ingest pricing scales unpredictably with Envoy metric volume from large meshes
- User-based licensing compounds costs for larger engineering teams
- SaaS-only deployment makes it unsuitable for data residency or air gapped requirements
- Limited mesh-specific features compared to purpose-built tools like Kiali
Best for: Existing New Relic customers who want to extend their current observability stack to cover service mesh without adding another vendor.
6. Grafana Stack
Best for: Teams that want full control over their observability stack and are comfortable assembling Prometheus, Tempo, and Loki for service mesh monitoring.
The Grafana stack combines Prometheus for metrics, Tempo for traces, and Loki for logs into a self hosted observability platform. For service mesh monitoring, Prometheus scrapes Envoy proxy metrics and Istio control plane endpoints. Tempo ingests distributed traces via OpenTelemetry. Grafana provides visualization and alerting across all three signal types.
This approach gives teams complete control over data retention, query performance, and cost. The trade off is operational complexity. You manage Prometheus storage, Tempo backend scaling, and Loki log aggregation yourself.
Key Features:
- Native Prometheus support for Istio and Linkerd metrics scraping
- Tempo for distributed tracing with OpenTelemetry ingestion
- Loki for log aggregation from Envoy sidecars and control plane components
- Grafana dashboards for service mesh topology, request rates, and error tracking
- Full self-hosted control over data retention and query performance
- Open source with no vendor lock-in
Pricing:
Free for self hosted deployments. Grafana Cloud offers managed hosting starting at $49 per month for small teams, scaling to usage-based pricing for larger deployments. Self-hosting requires infrastructure costs for Prometheus storage, Tempo backend, and Loki aggregation.
Pros:
- Complete data control with self-hosted deployment inside your own infrastructure
- Native Prometheus scraping for Istio and Linkerd eliminates proprietary agents
- Open source stack with no vendor lock-in or license fees
- Highly customizable dashboards and alerting tailored to your mesh deployment
- Strong community support and extensive ecosystem of exporters and integrations
Cons:
- Significant operational overhead to run, scale, and maintain Prometheus, Tempo, and Loki
- No unified query language, requires learning PromQL, TraceQL, and LogQL separately
- Limited out-of-the-box service mesh dashboards compared to commercial platforms
- High cardinality metrics from Envoy can overwhelm Prometheus without careful configuration
- No built-in anomaly detection or AI-assisted root cause analysis
Best for: Teams with strong SRE expertise who want full control over their observability stack and are willing to invest time in infrastructure monitoring and maintenance.
7. Honeycomb

Best for: High cardinality debugging of service mesh behavior with fast, flexible queries across distributed traces.
Honeycomb is an observability platform designed for high-cardinality event data. For service mesh monitoring, it ingests distributed traces from Istio or Linkerd via OpenTelemetry. Each trace span includes mesh-specific attributes like Envoy cluster name, route match result, and upstream service.
Honeycomb’s strength is querying trace data with arbitrary dimensions. You can ask questions like “show me all requests where Envoy applied a 10-second timeout, AND the upstream service returned 503, AND the request originated from namespace staging” without pre-defining indexes.
Key Features:
- High cardinality trace ingestion via OpenTelemetry from Istio and Linkerd
- Flexible querying across any trace attribute without pre-defined indexes
- BubbleUp feature automatically surfaces attributes correlated with slow requests
- Service map showing dependencies and latency distributions
- Built-in support for Envoy access logs and Istio telemetry attributes
- Trace waterfall view showing per-hop latency through the mesh layer
Pricing:
Free tier includes 20 million events per month. Pro tier starts at $130 per month and scales with event volume. A typical Istio deployment generating 50 million trace spans monthly costs approximately $500 per month. See Honeycomb’s pricing page for current rates.
Pros:
- High cardinality queries enable deep debugging of mesh behavior without sampling
- BubbleUp automatically identifies attributes correlated with performance issues
- Fast query performance even with billions of events
- OpenTelemetry-native ingestion works with any mesh that exports OTel traces
- Developer-friendly UI designed for rapid troubleshooting
Cons:
- SaaS-only deployment makes it unsuitable for data residency requirements
- Event-based pricing can scale unpredictably with trace volume from high-traffic meshes
- Limited metrics and logs support, primarily focused on trace analysis
- No built-in service mesh topology visualization like Kiali or Datadog
Best for: Engineering teams that prioritize deep trace analysis and high cardinality debugging over comprehensive metrics or topology visualization.
8. Elastic APM

Best for: Teams already running the ELK stack who want to extend it with service mesh observability.
Elastic APM is part of the Elastic Stack (Elasticsearch, Logstash, Kibana). It ingests distributed traces and metrics from applications and infrastructure. For service mesh monitoring, Elastic APM collects Envoy proxy metrics via Metricbeat and distributed traces via OpenTelemetry. Mesh telemetry appears in Kibana alongside application logs and infrastructure metrics.
Elastic APM supports Istio and Linkerd through OpenTelemetry integration. Teams can correlate mesh layer latency with application errors and infrastructure events in a single Kibana dashboard.
Key Features:
- Distributed tracing via OpenTelemetry from Istio and Linkerd
- Envoy proxy metrics collection via Metricbeat
- Kibana dashboards for service mesh topology and request flows
- Log correlation between Envoy access logs and application logs in Elasticsearch
- Self-hosted deployment with full control over data retention
- Integration with existing ELK stack deployments
Pricing:
Free for self-hosted deployments. Elastic Cloud offers managed hosting starting at $99 per month for the standard tier, scaling with data volume and feature usage. Self hosting requires Elasticsearch cluster infrastructure costs.
Pros:
- Native integration with existing ELK stack eliminates need for separate tools
- Self-hosted option provides full data control and compliance flexibility
- OpenTelemetry support works with any service mesh
- Powerful log correlation between Envoy sidecars and application logs
- Free open source version available for budget-conscious teams
Cons:
- Significant operational overhead to run and scale Elasticsearch for high-volume mesh telemetry
- Limited out-of-the-box service mesh dashboards compared to commercial platforms
- Query performance degrades with high-cardinality Envoy metrics without careful index tuning
- Steep learning curve for teams unfamiliar with Elasticsearch and Kibana
Best for: Teams already running the ELK stack who want to extend it with service mesh monitoring without adding another vendor.
How to Choose the Right Service Mesh Monitoring Tool
Choosing a service mesh monitoring tool depends on five factors: your mesh implementation, deployment model preference, team expertise, budget, and observability maturity.
Which service mesh are you running?
If you use Istio and want purpose-built topology visualization, Kiali is the simplest starting point. If you run Linkerd or plan to switch meshes later, choose a tool with broad OpenTelemetry support like CubeAPM, Grafana, or Honeycomb.
Do you need self-hosted or SaaS?
Teams with data residency requirements or air gapped environments must choose self hosted tools: CubeAPM, Grafana, Kiali, or Elastic APM. Teams that prioritize managed services can use Datadog, Dynatrace, New Relic, or Honeycomb.
What is your team’s operational capacity?
If you have dedicated SRE expertise and want full control, the Grafana stack or Elastic APM provide maximum flexibility at the cost of operational overhead. If you want managed observability, Datadog or Dynatrace eliminate infrastructure burden.
What is your budget?
Open source tools like Kiali and the Grafana stack cost only infrastructure to run. CubeAPM offers predictable ingestion-based pricing. Datadog, Dynatrace, and New Relic scale more expensively with host counts or data volume.
Do you need full stack observability or just mesh visibility?
If you only need mesh layer monitoring, Kiali suffices. If you need to correlate mesh performance with application traces, logs, and infrastructure, choose a unified platform like CubeAPM, Datadog, or the Grafana stack.
Service mesh monitoring becomes critical the moment you move beyond a single mesh deployment. Without proper observability, mesh misconfigurations, sidecar resource leaks, and control plane failures surface as vague user complaints hours after they start. The right tool makes mesh layer behavior visible, debuggable, and alertable before it impacts production traffic.
Disclaimer: The information in this article reflects the latest details available at the time of publication and may change as technologies and products evolve. Features, pricing, and plan limits can change over time. Always verify the latest information directly with the vendor before making purchasing or deployment decisions.
Frequently Asked Questions
What is service mesh monitoring?
Service mesh monitoring tracks the health, performance, and traffic flow of service mesh infrastructure like Istio or Linkerd. It collects metrics from sidecar proxies, control plane components, and distributed traces to surface issues like policy misconfigurations, mTLS failures, or sidecar resource leaks.
Why do I need a separate tool to monitor my service mesh?
Service meshes generate mesh-specific telemetry that general APM tools often miss. Metrics like Envoy connection pool stats, Istio VirtualService routing decisions, and mTLS handshake latency require purpose-built dashboards and queries to make sense of mesh layer behavior.
What is the difference between Istio and Linkerd monitoring?
Istio uses Envoy sidecars and exposes metrics via Prometheus endpoints. Linkerd uses a custom Rust-based proxy with its own telemetry format. Most modern tools support both through OpenTelemetry, but Istio-specific tools like Kiali only work with Istio deployments.
How much does service mesh monitoring cost?
Costs vary widely. Open source tools like Kiali are free but require infrastructure to run. CubeAPM charges $0.20 per GB ingested. Datadog costs approximately $3,000 per month for a 50-node cluster. Dynatrace starts around $74 per host per month.
Can I monitor a service mesh with Prometheus and Grafana?
Yes. Prometheus scrapes Envoy metrics from Istio or Linkerd. Grafana visualizes those metrics. This approach works but requires manual dashboard creation, careful high cardinality metric handling, and integration with Tempo for distributed tracing.
What metrics should I track for service mesh health?
Key metrics include request rates per service pair, error rates, latency distributions, Envoy connection pool stats, control plane API response times, mTLS certificate expiration dates, and circuit breaker state changes. Track both data plane and control plane health.
How do I correlate service mesh issues with application errors?
Use a tool that ingests both mesh telemetry and application traces. Distributed tracing shows per-hop latency through the mesh layer. Correlate Envoy error codes with application exception logs to identify whether issues originate in the mesh or application code.