









Database monitoring is the practice of continuously tracking the health, performance, and availability of your database systems and acting on that data before users feel the impact. Most teams instrument their application layer carefully, then treat the database as an afterthought. According to ITIC’s 2024 Hourly Cost of Downtime report, over 90% of large and mid-size enterprises report that a single hour of downtime costs upward of $300,000, and 4 in 10 put that number at $1 million or more.
The problem is specificity. Tracking CPU and disk tells you something is wrong. It does not tell you which query caused it, whether it is a replication lag widening over hours, a Redis eviction policy silently dropping session data, or an Elasticsearch heap creeping toward its limit. Without the right database-native signals, you are always reacting after users have already noticed.
This guide covers database monitoring for five engines: PostgreSQL, MySQL, MongoDB, Redis, and Elasticsearch, with the specific metrics, alert thresholds, and observability practices that matter in production.
What Database Monitoring Actually Means in 2026
Database monitoring has evolved well past tracking uptime and disk space. Most organizations start with infrastructure metrics: CPU, memory, and connection counts. That gives enough signal to notice something is wrong, but rarely enough to understand why, or to catch the problem before users feel it.
The Four Signal Types That Matter
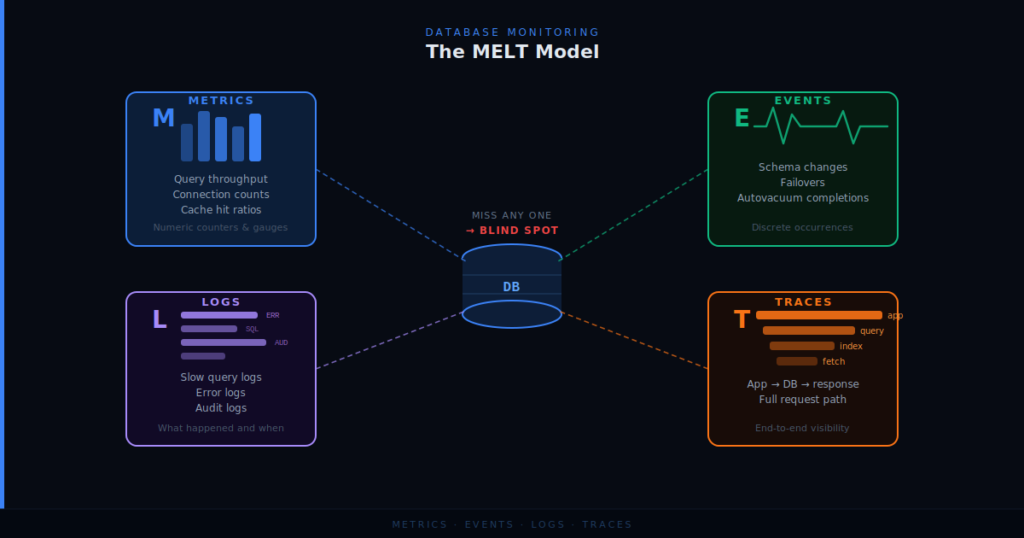
Effective database monitoring in 2026 means collecting all four of the following simultaneously. Missing any one of them creates blind spots that show up worse during incidents.
- Metrics: numeric counters and gauges such as query throughput, connection counts, and cache hit ratios
- Events: discrete occurrences like schema changes, failovers, or autovacuum completions
- Logs: slow query logs, error logs, and audit logs that explain what happened and when
- Traces: the full path a request takes from application code through the database and back
This is the MELT model. It has become the baseline for serious database observability work.
Why Metrics Alone Are Not Enough
A CPU spike on a PostgreSQL host tells you the server is stressed. It does not tell you which query caused it, whether a missing index is doing a full table scan, or whether the spike coincides with a batch job that ran at the same time yesterday without issue. Query-level visibility is the gap most teams do not close until an incident forces them to.
The Role of OpenTelemetry
OpenTelemetry has become the instrumentation standard for databases in 2026. The Grafana Labs 2025 Observability Survey found that more than two-thirds of organizations use Prometheus in production, and OpenTelemetry is tracking close behind with 41% already in production use and another 38% actively investigating or building proofs of concept.
It unifies your telemetry pipeline so that the database spans land in the same backend as your application traces. During an incident, you can follow a slow HTTP request directly to the offending query without switching tools or joining data across systems.
What Good Database Monitoring Should Answer in Under Five Minutes
- Which query is responsible for this latency spike?
- Is the slowdown coming from the database itself or from connection pool exhaustion?
- Did a recent deployment or schema change correlate with the degradation?
- Is this a single-instance problem or a cluster-wide pattern?
If your current setup cannot answer those questions quickly, the sections below will show you exactly what to add for each engine.
PostgreSQL Monitoring: The Metrics That Actually Matter
PostgreSQL is the most widely deployed open-source relational database in production environments. It exposes an exceptionally rich statistics system through its internal views, and understanding which views to query is the first step to meaningful monitoring.
Connection Management
PostgreSQL uses one process per connection. Above roughly 200 active connections, performance degrades measurably due to context-switching and memory pressure. The right metric to watch is pg_stat_activity, filtered by state.
Track these specific counts:
- Active connections (state = ‘active’): queries currently executing
- Idle connections (state = ‘idle’): connections open but doing nothing, consuming memory
- Idle in transaction (state = ‘idle in transaction’): the dangerous one; open transactions holding locks
Idle-in-transaction connections are a leading indicator of deadlock storms and lock waits. An alert at more than 10% of your max_connections sitting idle in transaction is a reasonable starting threshold. If you use PgBouncer or a similar connection pooler, track both the pooler’s client connections and the underlying PostgreSQL connections separately. The two can diverge dramatically under load.
Query Performance: pg_stat_statements Is Non-Negotiable
Enable the pg_stat_statements extension. It is the single most valuable diagnostic tool PostgreSQL ships. It normalizes all queries to their parameter-free form and tracks cumulative execution time, call count, rows returned, and shared buffer hits and misses per query digest.
The metrics that matter most from this view:
- total_exec_time / calls: average execution time per query, sorted descending to find your worst offenders
- shared_blks_hit / (shared_blks_hit + shared_blks_read): your effective buffer cache hit rate per query; below 0.95 for a frequently-called query is a strong signal of missing indexes or undersized shared_buffers
- rows / calls: average rows returned; unusually high values often indicate missing WHERE clause indexes or poorly written joins
Alert on any query digest whose mean execution time exceeds your p99 application SLO. If your API responses need to be completed in 200ms, any query regularly exceeding 50ms warrants investigation.
Autovacuum and Bloat
PostgreSQL’s MVCC model creates dead row versions on every UPDATE and DELETE. Autovacuum reclaims them. When autovacuum cannot keep up during write-heavy periods or when tables lack tuned thresholds, table bloat accumulates, query plans degrade, and eventually transaction ID wraparound becomes a real threat.
Monitor these from pg_stat_user_tables:
- n_dead_tup: dead tuple count per table
- last_autovacuum / last_autoanalyze: when vacuum last ran; gaps longer than a few hours on busy tables are a warning
- n_dead_tup / n_live_tup: bloat ratio; consistently above 10-20% deserves attention
The hard limit to understand: PostgreSQL will shut down in read-only mode if transaction IDs are within roughly 10 million of wraparound. Monitor age(datfrozenxid) from pg_database. Alert at 1 billion, take urgent action at 1.5 billion.
Replication Lag
For any high-availability PostgreSQL setup, replica lag is a critical metric. Query pg_stat_replication on the primary for write_lag, flush_lag, and replay_lag. Alert thresholds depend heavily on your RPO, but for most production systems, replay_lag exceeding 30 seconds warrants a page.
Alert Thresholds for PostgreSQL
| Metric | Warning | Critical |
| Connection utilization (% of max_connections) | 70% | 90% |
| Idle in transaction connections | >5 | >20 |
| Replication replay_lag | >10s | >60s |
| Cache hit ratio (pg_stat_bgwriter) | <95% | <90% |
| Transaction ID age | >1B | >1.5B |
| Long-running queries | >30s | >5min |
MySQL Monitoring: What InnoDB Tells You That Slow Logs Don’t
MySQL is the backbone of countless web applications. Its monitoring story runs through two separate information sources: Performance Schema, the preferred source for runtime query statistics and wait-event analysis, and the InnoDB engine metrics. Both matter and they answer different questions.
InnoDB Buffer Pool
The InnoDB buffer pool is MySQL’s primary memory cache. Every row read from disk passes through it. The buffer pool hit ratio tells you how often queries find their data in memory versus reading from disk.
Calculate it as: Innodb_buffer_pool_reads / (Innodb_buffer_pool_reads + Innodb_buffer_pool_read_requests)
A healthy production system holds this ratio below 1% (meaning 99%+ of reads come from cache). If this ratio climbs, the most common causes are: buffer pool too small for your working dataset, a new query pattern doing large sequential scans, or schema growth that pushed hot data out of cache.
Track Innodb_buffer_pool_pages_dirty alongside the hit ratio. High dirty page counts with low checkpoint activity can indicate I/O bottlenecks that will eventually surface as write stalls.
Thread and Connection Metrics
From SHOW GLOBAL STATUS, the metrics that matter:
- Threads_running: actively running queries at this moment; this is your real concurrency indicator, not Threads_connected
- Threads_connected: total connections; alert when this approaches max_connections
- Connection_errors_max_connections: increment counter; any non-zero value means clients are being rejected
The distinction between Threads_running and Threads_connected is critical. A system with 500 connections and only 10 running threads is under minimal load. A system with 50 connections and 48 running threads is on the edge of a crisis.
Slow Query Log vs. Performance Schema
The slow query log captures queries exceeding long_query_time but loses its value at high write volumes due to logging overhead. Performance Schema is the better choice for production: it captures query digests, wait events, and execution stage breakdowns with minimal overhead.
Enable events_statements_summary_by_digest and sort by SUM_TIMER_WAIT DESC to find your slowest query digests by total wall time. This differs from finding your slowest individual queries. A query that takes 2ms but runs 50,000 times per minute contributes far more to total latency than one that takes 500ms and runs twice a day.
Replication Monitoring
MySQL replication monitoring requires watching both the primary and replica. On the replica, Seconds_Behind_Source (in MySQL 8.0+, replacing the older Seconds_Behind_Master) gives lag in seconds but can be misleading. It measures the timestamp difference between the last applied event and now, not network or I/O lag.
For precise replication monitoring, enable GTID-based replication and track transaction lag by comparing gtid_executed between primary and replica. Alert on any replica where lag exceeds your recovery point objective.
InnoDB Deadlocks
Track Innodb_deadlocks from SHOW STATUS. Deadlocks are normal in small quantities. InnoDB resolves them automatically by rolling back the victim transaction. A rising deadlock rate indicates application-level concurrency issues, usually from transactions acquiring locks in inconsistent order.
Parse SHOW ENGINE INNODB STATUS or query information_schema.innodb_trx during incidents to understand what transactions are blocking what.
Alert Thresholds for MySQL
| Metric | Warning | Critical |
| InnoDB buffer pool hit ratio | <98% | <95% |
| Threads_running (% of max connections) | 60% | 80% |
| Seconds_Behind_Source | >10s | >60s |
| Deadlocks per minute | >5 | >20 |
| Connection errors (max_connections) | >0 | Any sustained rate |
MongoDB Monitoring: The Atlas and Self-Hosted Divide
MongoDB monitoring splits into two distinct contexts: Atlas-managed clusters, where many metrics are collected automatically, and self-hosted deployments, where instrumentation is entirely your responsibility. The metrics that matter are the same in both cases.
Operation Counters and Latency
MongoDB exposes its runtime statistics through db.serverStatus(). The most actionable metrics live in the opcounters document and the opLatencies document.
Track operations per second by type: insert, query, update, delete, getmore, command. Sudden shifts in the ratio, such as a spike in update operations with no corresponding insert growth, can indicate runaway update loops or application bugs before they surface as user-facing slowness.
opLatencies gives you cumulative operation latency in microseconds. Divide the latency accumulator by the operation count delta to get mean latency per operation type over your collection interval.
For any serious MongoDB deployment, enable the Profiler selectively on slow operations. Set db.setProfilingLevel(1, { slowms: 100 }) to capture queries exceeding 100ms without enabling the full query log overhead. Captured operations land in system.profile and contain full query shape, execution plan, and index usage.
WiredTiger Cache
MongoDB’s WiredTiger storage engine has its own cache, separate from OS page cache. Monitor wiredTiger.cache.bytes currently in the cache against the configured cache size (default: 50% of RAM minus 1GB, minimum 256MB).
The critical metric is cache eviction. When dirty data eviction rate climbs, WiredTiger starts blocking application writes while it flushes dirty pages to disk. This surfaces as sudden write latency spikes with no corresponding CPU or network explanation.
Watch for:
- wiredTiger.cache.pages evicted by application threads: any non-zero sustained rate indicates cache pressure
- wiredTiger.cache.tracked dirty bytes in the cache / configured cache size: alert above 20%
Replication and Oplog
For replica sets, monitor rs.printReplicationInfo() output programmatically. The critical figure is oplog window: how many hours of operations the oplog retains. If a secondary falls behind and the oplog window closes before it catches up, that secondary needs full resync.
Alert when oplog.timeDiff (oplog window in seconds) is less than 24 hours. For high write environments, configure oplog size explicitly using the replication.oplogSizeMB setting in your MongoDB config file.
Track secondary replication lag through rs.status(), specifically the optimeDate difference between primary and each secondary. Alert when any secondary lags more than 30 seconds.
Index Effectiveness
MongoDB query performance depends almost entirely on index coverage. Run db.collection.aggregate([{$indexStats:{}}]) periodically to audit which indexes are being used. Indexes with zero accesses after weeks of production traffic are candidates for removal, as they consume write overhead without benefit.
On a collection receiving 10,000 inserts per second, a single unused compound index adds measurable write latency. This is a straightforward optimization that many teams skip until a query regression forces them to investigate.
Alert Thresholds for MongoDB
| Metric | Warning | Critical |
| Query latency (p95) | >100ms | >500ms |
| Replication lag (secondary) | >15s | >60s |
| WiredTiger dirty cache | >15% | >25% |
| Oplog window | <48 hours | <12 hours |
| Connections (% of max) | 70% | 90% |
Redis Monitoring: Memory Is Everything
Redis works differently from every other database in this guide. It operates entirely in memory. The consequence is simple: when Redis runs out of memory, your entire caching layer is compromised. Every Redis monitoring strategy starts with memory and builds outward from there.
Memory Usage and Eviction Policy
The fundamental Redis memory metrics come from INFO memory:
- used_memory: current memory allocated by Redis for data
- used_memory_rss: memory as reported by the OS (always larger; the difference is fragmentation)
- mem_fragmentation_ratio: used_memory_rss / used_memory; healthy range is 1.0 to 1.5; above 1.5 indicates significant fragmentation; below 1.0 means Redis is using swap
Know your eviction policy. If maxmemory-policy is set to allkeys-lru or similar, Redis silently evicts keys when memory is full. This is acceptable for pure caching but catastrophic if Redis also holds application session state or distributed locks that must not expire unexpectedly.
Monitor evicted_keys from INFO stats. Any evictions in a system where Redis holds non-cache data should trigger an immediate investigation. For pure cache use cases, a moderate eviction rate is expected but should be stable.
Keyspace Hit Rate
From INFO stats, track keyspace_hits and keyspace_misses. Your cache hit rate is:
keyspace_hits / (keyspace_hits + keyspace_misses)
A well-tuned Redis cache should hold above 90% hit rate for most workloads. A degrading hit rate suggests TTL values set too aggressively, cache invalidation happening too frequently, or a memory pressure situation causing excessive evictions.
Slow Queries and Blocking Commands
Redis is single-threaded for command execution (excluding I/O threads in Redis 6+). A single slow command blocks all subsequent commands. Enable the slowlog with a reasonable threshold:
CONFIG SET slowlog-log-slower-than 10000 # 10ms in microseconds
CONFIG SET slowlog-max-len 128
Query SLOWLOG GET 10 regularly. Commands that consistently appear in the slowlog are candidates for optimization or replacement with more targeted data structures.
Watch for blocking commands: KEYS * in production is never acceptable. One KEYS * call on a large keyspace can block Redis for seconds. Always use SCAN with cursor iteration instead.
Replication and Persistence
For Redis replicas, monitor master_last_io_seconds_ago from INFO replication. This shows how recently the replica heard from the primary. Alert above 10 seconds.
If using RDB persistence, monitor rdb_last_bgsave_status. Any value other than “ok” means your last backup failed. If using AOF, track aof_rewrite_in_progress during rewrites, as they add memory pressure.
Alert Thresholds for Redis
| Metric | Warning | Critical |
| Memory usage (% of maxmemory) | 70% | 85% |
| Mem fragmentation ratio | >1.5 | >2.0 |
| Evicted keys (non-cache use) | >0 | Any sustained rate |
| Cache hit rate | <85% | <70% |
| Connected clients (% of maxclients) | 70% | 85% |
| Replication offset (bytes behind) | >100KB | >1MB |
Elasticsearch Monitoring: Cluster State Is Your First Signal
Elasticsearch operates as a distributed cluster of nodes, and its monitoring has a cluster-first orientation. A single unhealthy node can degrade the entire cluster. Your monitoring must start with cluster state, then drill into node-level and index-level metrics.
Cluster Health
The Elasticsearch Cluster Health API (GET /_cluster/health) returns one of three states:
- Green: all primary and replica shards are assigned and operational
- Yellow: all primary shards are assigned, but one or more replica shards are unassigned
- Red: one or more primary shards are unassigned; some data may be unavailable
Red cluster status means data loss risk is active. Yellow means resilience is compromised; the cluster can serve requests but cannot tolerate a node failure for the affected indexes. Your monitoring should treat any non-green cluster state as an alert-worthy event.
Poll GET /_cluster/health at your shortest feasible interval, 15 to 30 seconds in production. The status field is your headline metric. Track it alongside relocating_shards, initializing_shards, and unassigned_shards.
JVM Heap Pressure
Elasticsearch is built on the JVM. Heap pressure is the most common root cause of Elasticsearch performance degradation and crashes. Pull JVM stats from GET /_nodes/stats/jvm:
- jvm.mem.heap_used_percent: alert at 75%, take urgent action at 85%
- jvm.gc.collectors.old.collection_count and collection_time_in_millis: track the rate of increase; full GC events exceeding 10 seconds will cause cluster timeouts
Elasticsearch recommends setting heap to 50% of available RAM, with a hard ceiling of 31GB. Above 31GB, the JVM cannot use compressed object pointers and memory efficiency drops sharply. If your Elasticsearch nodes have 128GB of RAM and heap is set to 64GB, you are risking more frequent full GCs and leaving performance on the table.
Indexing and Search Throughput
From GET /_nodes/stats/indices:
- indices.indexing.index_total and index_time_in_millis: derive indexing throughput (docs/sec) and mean indexing latency
- indices.search.query_total and query_time_in_millis: derive query throughput and mean query latency
- indices.search.fetch_total and fetch_time_in_millis: the fetch phase happens after query; slow fetches often indicate returning too many fields or large source documents
For search latency, p99 matters more than mean. Elasticsearch search results are assembled from multiple shards in parallel, so tail latencies drive user experience. Alert when p99 search latency exceeds your SLO, typically 500ms to 1s for most interactive search applications.
Thread Pool Queues and Rejections
Each Elasticsearch node has thread pools for different operations: search, write, analyze, and others. When a thread pool is saturated, incoming requests are queued. When the queue fills, requests are rejected.
Track GET /_nodes/stats/thread_pool for:
- thread_pool.search.rejected: any rejections mean queries are being dropped; alert immediately
- thread_pool.write.rejected: same for indexing; alert immediately
- thread_pool.search.queue: a growing queue predicts rejections; alert when queue depth exceeds 50
Thread pool rejections are one of the clearest signals of a cluster under load it cannot handle. They appear in application logs as 429 errors and are often the first thing users report as “search not working.”
Disk and Shard Allocation
Elasticsearch has built-in disk watermarks that automatically restrict shard allocation to protect disk space. Know the defaults:
- cluster.routing.allocation.disk.watermark.low (default 85%): Elasticsearch stops allocating new shards to this node
- cluster.routing.allocation.disk.watermark.high (default 90%): Elasticsearch begins relocating shards away from this node
- cluster.routing.allocation.disk.watermark.flood_stage (default 95%): Elasticsearch puts all indexes on this node into read-only mode
Alert well before these thresholds. If your monitoring alerts at 85%, you have no reaction time before Elasticsearch starts managing its own shard allocation. Alert at 70% disk usage on Elasticsearch nodes.
Alert Thresholds for Elasticsearch
| Metric | Warning | Critical |
| Cluster status | Yellow | Red |
| JVM heap used | >75% | >85% |
| Disk usage | >70% | >82% |
| Thread pool rejections (search/write) | >0 | Any sustained rate |
| Unassigned shards | >0 | >5 |
| Search p99 latency | >500ms | >2s |
Cross-Database Monitoring Practices
The five databases above each have unique internals, but the operational practices around monitoring them share common ground.
Correlate Database Metrics with Application Traces
The most valuable insight in database monitoring comes from correlation: understanding whether a latency spike in your database explains a latency spike in your application. This requires distributed tracing that spans both layers.
When an OpenTelemetry-instrumented application makes a database call, the resulting trace span carries the query text, duration, and database attributes alongside the parent HTTP span. During an incident, you can start from an elevated error rate in your application, drill into traces, find the slow database span, and pivot directly to the corresponding database metrics without context-switching tools.
This is the architecture that separates reactive from proactive database operations. Teams that have built this correlation catch issues during gradual degradation, not during sudden outages.
Establish Baseline Behavior Before Setting Alert Thresholds
Alert thresholds are meaningless without baselines. A MySQL buffer pool hit rate of 97% might be normal for one application and a serious regression for another. Before setting thresholds, run your monitoring for two to four weeks and understand:
- Peak vs. off-peak resource utilization patterns
- Expected query latency ranges by query type
- Normal connection counts during batch jobs vs. interactive traffic
- Replication lag behavior during heavy write periods
Thresholds set below peak normal levels generate alert fatigue. Thresholds set above what the database can sustain generate missed incidents. The tables in this guide are starting points; calibrate them against your own baselines.
Log Retention for Post-Incident Analysis
During a live incident, your monitoring dashboard shows current state. Post-incident, you need historical telemetry to understand root cause. High-cardinality telemetry (query-level traces, slow query logs) generates significant data volume, and retention decisions involve cost tradeoffs.
For most production environments, a practical retention strategy is:
- Metrics (aggregated): 13 months (covers year-over-year comparison)
- Slow query logs and traces: 30 to 90 days
- Infrastructure metrics (CPU, memory, disk): 13 months
The worst time to discover you have two-week telemetry retention is during a post-mortem for an incident that started three weeks ago.
Putting It Together: Monitoring a Mixed Database Stack
Most production environments do not run a single database. A common stack looks something like this: PostgreSQL handles transactional data, Redis sits in front as a cache, MongoDB stores user-generated content, and Elasticsearch powers product or log search. Running separate monitoring tools for each engine is technically possible, and operationally exhausting.
What Fragmented Monitoring Looks Like in Practice
Consider an engineering team supporting an e-commerce platform. During a Black Friday traffic spike, checkout latency climbs from 180ms to 900ms. The on-call engineer opens four dashboards: the PostgreSQL monitoring tool, the Redis metrics UI, the Elasticsearch Kibana console, and the APM tool for application traces. None of them talk to each other.
The PostgreSQL tool shows connection pool saturation. The Redis tool shows normal memory usage. The APM tool shows slow HTTP spans, but cannot drill to the database query level. It takes 40 minutes to establish that a missing index on the PostgreSQL orders table, introduced by a schema migration two days earlier, is responsible, a correlation that should have taken five minutes with unified telemetry.
This is the cost of fragmentation: not just operational overhead, but mean time to resolution that multiplies under incident pressure.
What Unified Database Monitoring Enables
Unified monitoring changes the incident workflow in three specific ways:
- Cross-layer correlation: A slow HTTP trace links directly to the offending database span, the query digest, and the infrastructure metric (CPU, disk I/O) on the same node, in one view
- Single alert routing: One platform sends pages with full context, not five separate alerts that engineers must manually correlate
- Unified retention: Historical telemetry from all engines is queryable together, which matters during post-mortems that span multiple systems
Choosing a Platform for Multi-Database Visibility
The architecture that works is simple: one OpenTelemetry-native platform ingesting telemetry from all engines into a shared store, with database spans and application traces living in the same backend. CubeAPM is built on this model, covering MySQL, PostgreSQL, MongoDB, Redis, and Elasticsearch alongside application traces and infrastructure metrics, with on-prem or VPC deployment for teams with data residency requirements.
Delhivery, a large-scale logistics company, reported a 75% reduction in monitoring costs after consolidating onto CubeAPM, with faster root-cause detection across their database and application layers. The architectural decisions here determine whether an incident takes five minutes or fifty to resolve.
A relevant data point on the cost of getting this wrong: Splunk and Oxford Economics found that unplanned downtime costs Global 2000 companies $400 billion annually, with each company averaging $200 million per year in losses.
How CubeAPM Helps With Database Monitoring
Most database monitoring problems are not a shortage of data. They are a shortage of context. Metrics in one tool, query traces in another, logs somewhere else. When an incident hits, the investigation becomes a manual exercise of correlating timestamps across three dashboards instead of following a single thread from symptom to root cause.
One Platform Across All Five Engines
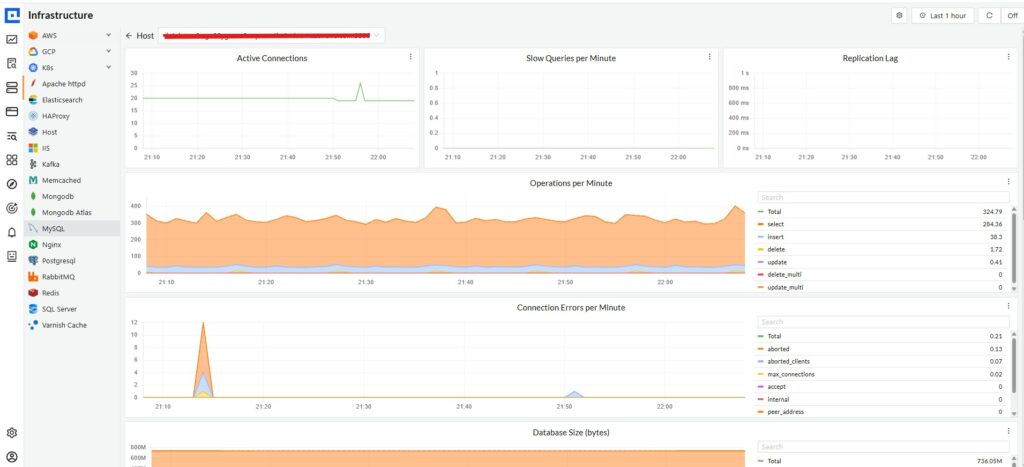
CubeAPM is an OpenTelemetry-native observability platform that covers PostgreSQL, MySQL, MongoDB, Redis, and Elasticsearch in a single interface, alongside application traces, infrastructure metrics, and logs. For each engine, it surfaces the signals that matter most:
- PostgreSQL: slow query detection, connection state breakdown, autovacuum tracking, and replication lag
- MySQL: InnoDB buffer pool metrics, thread concurrency, and query digest analysis via Performance Schema
- MongoDB: WiredTiger cache pressure, oplog window, replication lag, and index usage auditing
- Redis: memory utilization, eviction rate, keyspace hit ratio, and slowlog visibility
- Elasticsearch: cluster health state, JVM heap pressure, thread pool rejections, and shard allocation status
Correlation Between Database and Application Layers
Because CubeAPM ingests database telemetry and application traces through the same OpenTelemetry pipeline, a slow query shows up in the same trace as the HTTP request that triggered it. Engineers start from the user-facing error, follow the trace to the database span, see the query digest and execution time, and pivot to the infrastructure metrics on the same host, without leaving the platform.
Predictable Cost at Scale
Datadog and New Relic price database monitoring per host or monitored instance, which scales unpredictably as fleets grow. CubeAPM uses per-GB ingestion pricing at $0.15/GB with unlimited retention, so teams running five database engines across dozens of nodes can forecast their observability spend without surprises. Data stays inside your own VPC, which matters for teams with compliance or data residency requirements.
Conclusion
Each database in this guide fails differently and exposes different signals. PostgreSQL surfaces problems through its statistics views. MySQL reveals pressure through InnoDB internals. MongoDB warns you through replication lag and cache eviction. Redis tells the story through memory and hit rate. Elasticsearch speaks through cluster state and JVM heap. The job of database monitoring is to know which signal to watch for each engine, set thresholds against your own baselines, and correlate what the database is doing with what the application is experiencing.
The teams that catch issues before users notice are not running more sophisticated infrastructure. They are watching the right metrics, in one place, with enough historical context to tell signal from noise. If your current setup leaves gaps across any of the five engines covered here, start with the alert threshold tables in each section and build from there.
Disclaimer: The information in this article reflects the latest details available at the time of publication and may change as technologies and products evolve. The alert thresholds and metric recommendations in this guide are starting points based on common production patterns. Every database workload is different. Validate all thresholds against your own baseline before applying them in production.
FAQs
What is database monitoring?
Database monitoring is the continuous collection, analysis, and alerting on performance and health metrics from a database system. It covers query execution time, connection utilization, memory usage, replication lag, error rates, and storage capacity, tracked over time so teams detect anomalies before they cause outages or user impact.
What are the most important metrics to monitor in PostgreSQL?
The highest-signal PostgreSQL metrics are query execution time from pg_stat_statements, connection state distribution from pg_stat_activity, replication lag from pg_stat_replication, autovacuum activity from pg_stat_user_tables, and transaction ID age from pg_database. Enabling the pg_stat_statements extension is non-negotiable for any production PostgreSQL instance.
How do you monitor MySQL replication lag accurately?
In MySQL 8.0+, Seconds_Behind_Source from SHOW REPLICA STATUS is the primary indicator but can be misleading since it measures event timestamp differences rather than actual network or I/O lag. For precision, enable GTID-based replication and compare gtid_executed between primary and replica, which gives transaction-count lag independent of timestamp skew.
Why does Elasticsearch cluster health turn yellow and what should you do?
Yellow status means one or more replica shards are unassigned, usually because there are not enough nodes to place all replicas. Run GET /_cluster/allocation/explain to understand why shards are unassigned, verify node availability, and check disk watermark thresholds if disk pressure is triggering allocation restrictions.
How much memory should Redis use before you increase capacity?
Alert when Redis used_memory reaches 70% of maxmemory. At 85%, evictions may begin affecting data outside your intended cache scope. Use used_memory_rss, the actual OS-reported footprint, as your true capacity constraint when planning headroom.
What is the difference between MongoDB’s WiredTiger cache and OS page cache?
WiredTiger maintains its own cache for decompressed, deserialized documents and index entries. The OS page cache provides a secondary layer for raw disk pages not in the WiredTiger cache. Monitor wiredTiger.cache.bytes currently in the cache for engine-level pressure and overall free memory for system-level pressure. High WiredTiger eviction rates with available OS memory usually indicate the WiredTiger cache is configured too small.
Should you use a single monitoring tool for all five databases or separate tools per database?
A single unified platform significantly reduces operational complexity and, more importantly, enables cross-layer correlation between database telemetry and application traces. Separate tools make that correlation difficult or impossible. Teams running mixed stacks get the most value from OpenTelemetry-native platforms that ingest telemetry from all engines into a shared store with unified dashboards and alert routing.
How often should database monitoring alerts be reviewed and tuned?
Review and tune alert thresholds at least quarterly, and always after major version upgrades, schema changes, or significant traffic changes. After any incident, check whether your monitoring caught the issue early or missed it, and adjust accordingly. Monitoring is a living system, not a set-and-forget configuration.