SAP powers mission-critical business processes, yet monitoring these landscapes is complex. Teams must track ABAP dumps (ST22), background jobs (SM37), HANA health, and hybrid infrastructure in real time. ITIC reports that over 90% of enterprises face downtime costs above $300,000 per hour, making proactive monitoring essential.
CubeAPM solves this by bringing SAP-specific observability into a modern, cost-efficient platform. It ingests SAP logs, traces, and infrastructure metrics—covering ABAP runtime errors, job queues, and HANA performance.
In this guide, we’ll break down the top SAP monitoring tools, including their SAP features, pros and cons, and pricing at scale.
Top SAP Monitoring Tools
- CubeAPM
- Datadog
- New Relic
- Dynatrace
- ManageEngine Applications Manager
- IBM Instana
- Azure Monitor
- SAP Solution Manager / SAP Cloud ALM
- Paessler PRTG
- SolarWinds
What is SAP Monitoring?
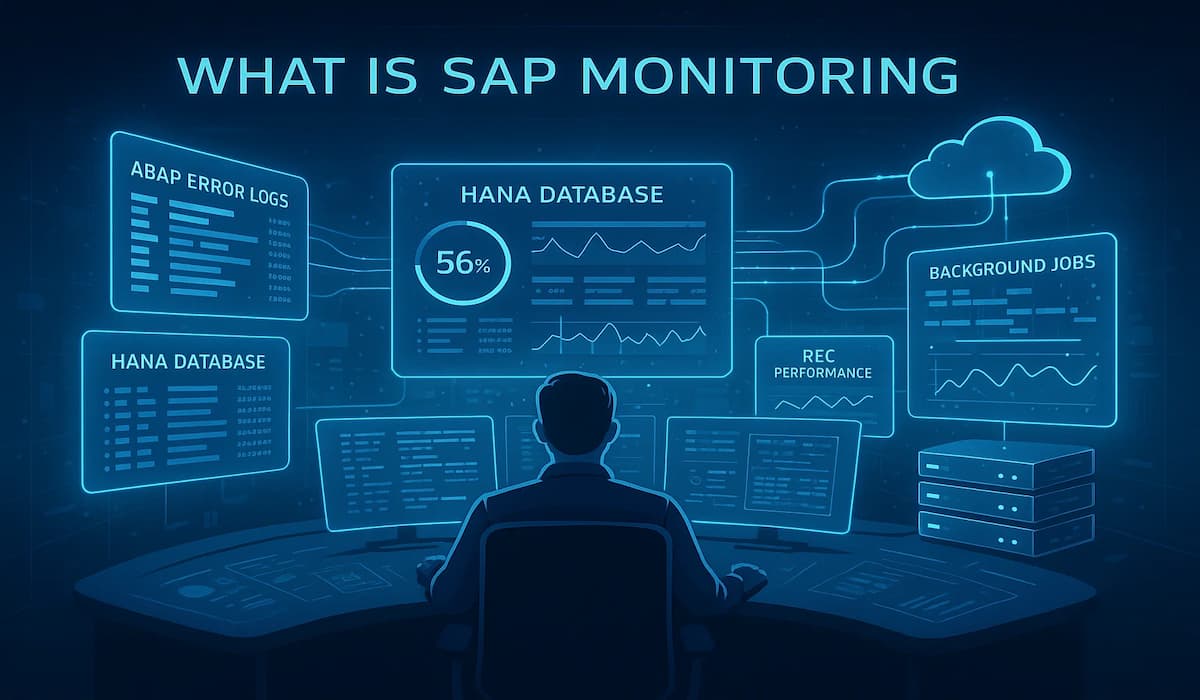
SAP Monitoring is the practice of continuously tracking the health, performance, and availability of SAP systems such as S/4HANA, ECC, ABAP stacks, and HANA databases, along with their integrations across hybrid IT landscapes. Because SAP underpins critical business functions—finance, logistics, HR, supply chain—monitoring ensures these applications remain reliable, performant, and compliant.
Unlike general application monitoring, SAP monitoring requires deep visibility into SAP-specific layers:
- ABAP Dumps (ST22): Detects runtime errors that can disrupt user transactions.
- Background Jobs (SM37): Tracks scheduled processes, long-running jobs, or failed tasks.
- Enqueue/Lock Tables (SM12): Identifies resource contention that can block business processes.
- RFC Performance: Monitors remote function calls between SAP modules and external systems.
- SAP HANA Metrics: Captures memory, disk, CPU usage, query performance, and replication health.
- Spool Monitoring: Ensures print and output requests are processed correctly.
Effective SAP monitoring helps:
- Detect failures (like ABAP dumps or stalled jobs) before users notice.
- Speed up root cause analysis by correlating SAP data with app metrics.
- Prevent costly downtime—estimated at $300,000 per hour for large enterprises.
- Ensure compliance with regulations such as GDPR, HIPAA, and DPDP.
Example: How CubeAPM Handles SAP Monitoring
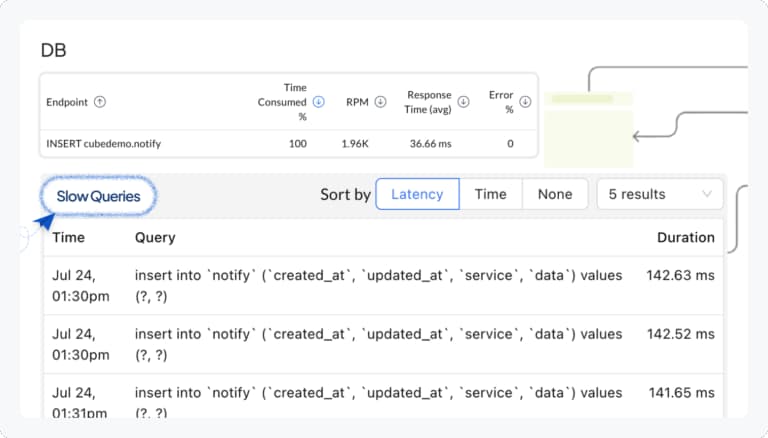
CubeAPM surfaces slow database queries in real time, enabling SAP Basis teams to diagnose performance bottlenecks in HANA and related services quickly.
CubeAPM is built to ingest and correlate telemetry from SAP application servers, HANA databases, and hybrid integrations in one place. Here’s how it works in a real-world SAP Basis scenario:
- ABAP Dump Tracking (ST22): CubeAPM agents collect SAP error logs and forward them via OpenTelemetry. When a runtime error occurs, it’s captured as both a log event and linked to traces from the impacted transaction, helping Basis teams trace the failure back to the exact function module or RFC call.
- Background Job Monitoring (SM37): CubeAPM ingests job completion and failure logs, automatically correlating delays with infrastructure metrics. For example, if a payroll job stalls because of high CPU usage on the HANA node, CubeAPM shows the event on a unified timeline.
- Lock/Enqueue Issues (SM12): Enqueue table contention can freeze business processes. CubeAPM surfaces these lock conflicts as anomalies and links them with user transaction slowdowns, allowing Basis admins to quickly identify and release problematic locks.
- HANA Performance: CubeAPM pulls in HANA KPIs like memory usage, query times, and replication lag. If a report query takes too long, CubeAPM can correlate it with slow disk I/O on the database host.
- Hybrid Correlation: Most enterprises run SAP alongside APIs, microservices, or third-party apps. CubeAPM connects SAP telemetry with non-SAP traces, so a failed RFC call to an external CRM system doesn’t get misdiagnosed as an SAP issue.
With flat $0.15/GB pricing and smart sampling, CubeAPM lets enterprises ingest 10TB+ of SAP logs and traces per month at predictable cost—something that would cost tens of thousands in tools like Datadog or Dynatrace. This cost efficiency makes full-stack SAP monitoring feasible, even at enterprise scale.
Why Teams Choose Different SAP Monitoring Tools
Monitoring SAP isn’t just about uptime dashboards—it’s about capturing the unique complexity of SAP workloads. Many enterprises discover that relying only on SAP Solution Manager or Cloud ALM leaves critical gaps, especially in hybrid or multi-cloud environments. This drives teams to explore alternative SAP monitoring tools for several reasons:
1. Cost Predictability at Scale
SAP systems generate massive telemetry: ABAP dumps, job logs, HANA queries, RFC traces, and OS metrics. In tools like Datadog or Dynatrace, every extra gigabyte or span adds cost. For a company ingesting 10TB+ per month, this can mean bills in the tens of thousands. Teams want pricing models that scale predictably without hidden overages.
2. Deeper SAP-Aware Insights
Generic observability platforms often treat SAP like any other workload, missing key layers such as enqueue locks, background job queues, or ABAP runtime errors. Basis teams need tools that can ingest SAP logs and metrics natively and correlate them with infrastructure and user experience, so issues like job delays or RFC failures are diagnosed faster.
3. Hybrid & Multi-Cloud Readiness
Modern SAP deployments stretch across on-premises servers, cloud VMs, and APIs. Native tools like SolMan were never designed for this sprawl. Enterprises choose third-party monitoring platforms that can cover SAP alongside Kubernetes, cloud services, and non-SAP apps in a single pane of glass.
4. Faster Root Cause Analysis
When payroll jobs fail or RFC calls hang, every minute counts. Native SAP tools can show the error, but not the chain of events that caused it. Modern monitoring platforms stitch logs, traces, and infrastructure metrics together, so teams can resolve incidents in minutes instead of hours.
5. User Experience Monitoring
SAP downtime isn’t the only problem—slow transactions frustrate end users just as much. Enterprises need tools that can monitor SAP GUI, Fiori, and web interfaces from the end-user perspective, often using synthetic transactions or RUM (real user monitoring). This is an area where SolMan falls short.
6. Automation & AI Assistance
With SAP landscapes spanning hundreds of servers, manual log inspection doesn’t scale. Teams look for monitoring tools with AI-driven anomaly detection, alert correlation, and automated incident response to reduce noise and speed up remediation.
Top 10 SAP Monitoring Tools
1. CubeAPM

Known for
CubeAPM is an OpenTelemetry-native observability platform built for cost transparency and scalability. Instead of charging per host or by feature bundles, it offers a flat $0.15/GB ingestion cost across logs, traces, and metrics. With options for self-hosting or Bring-Your-Own-Cloud (BYOC), CubeAPM ensures enterprises can meet strict compliance requirements while keeping monitoring costs predictable.
SAP Monitoring Features
CubeAPM extends its observability model to SAP landscapes by ingesting and correlating telemetry from both SAP internals and surrounding infrastructure. This includes:
- ABAP dumps (ST22) captured as structured logs tied to failing transactions.
- Background jobs (SM37) with real-time visibility into failed or delayed processes.
- Lock/enqueue table (SM12) conflicts detected as anomalies linked to transaction slowdowns.
- SAP HANA metrics such as query latency, replication lag, and memory utilization.
- RFC performance for monitoring SAP-to-non-SAP integrations.
Key Features
- Unified monitoring of SAP logs, metrics, and traces alongside non-SAP workloads.
- Smart Sampling to reduce telemetry volume while retaining critical signals.
- 800+ integrations with databases, cloud services, and infrastructure.
- Real-time dashboards with anomaly detection and SLA-driven alerting.
- Compliance-ready deployments: SaaS, self-hosted, or BYOC.
Pros
- Extensive integration ecosystem, 800+ integrations
- Flat $0.15/GB pricing with no host or feature-based fees.
- SAP-specific monitoring tied directly to ABAP dumps, job queues, and HANA performance.
- Deployment flexibility across on-prem and cloud environments.
Cons
- Not suited for teams looking for off-prem solutions
- Strictly an observability platform and does not support cloud security management
Pricing
- CubeAPM charges a flat $0.15/GB for all telemetry data—logs, traces, and metrics.
CubeAPM SAP Monitoring Pricing at Scale
*All pricing comparisons are calculated using standardized Small/Medium/Large team profiles defined in our internal benchmarking sheet, based on fixed log, metrics, trace, and retention assumptions. Actual pricing may vary by usage, region, and plan structure. Please confirm current pricing with each vendor.
For a mid-sized SaaS company ingesting 45TB(~45,000) total monthly data ingestion and 45,000GB of observability data outcharged by the cloud provider, the total cost will be about ~$7200/month.
TechFit
Best suited for enterprises with hybrid SAP deployments that need deep SAP-aware observability, cost control, and compliance flexibility. Ideal for teams that want to monitor both SAP internals and non-SAP systems in a single platform without runaway bills.
2. Datadog
Known for
Datadog is one of the most widely adopted observability platforms, recognized for its broad feature set that spans infrastructure monitoring, APM, log management, security, synthetic tests, and real user monitoring. With a large marketplace of integrations, it is often the first choice for enterprises modernizing their monitoring stack.
SAP Monitoring Features
- ABAP dumps (ST22): Collected as logs and visualized in dashboards.
- Background jobs (SM37): Forwarded job execution logs to monitor failures or long runtimes.
- HANA database metrics: CPU, memory, disk I/O, query latency, and replication health tracked via system integrations.
- RFC latency and errors: Monitored through log pipelines and network traces.
- OS and host metrics for SAP servers: Captured natively by Datadog agents.
Key Features
- Full-stack observability: infrastructure, APM, logs, RUM, and synthetics.
- 900+ pre-built integrations with cloud services and databases.
- AI-powered anomaly detection and alert correlation.
- Service dependency mapping and distributed tracing.
- Scalable dashboards with flexible retention policies.
Pros
- Mature product with strong adoption in enterprise IT.
- Broad ecosystem of integrations.
- Excellent visualization and collaboration features.
Cons
- Pricing complexity with multiple billing levers (hosts, GB, retention).
- Costs rise sharply with high log and trace volumes.
Pricing
- APM (Pro Plan): $35/host/month
- Infra (Pro Plan): $15/host/month
- Ingested Logs: $0.10 per ingested or scanned GB per month
Datadog SAP Monitoring Pricing at Scale
For a mid-sized SaaS company operating 125 APM hosts, 40 profiled hosts, 100 profiled container hosts, 200 infrastructure hosts, 1.5 million container hours, 300,000 custom metrics, 500 million indexed spans, and 3,500 indexed logs, while ingesting approximately 10 TB (≈10,000 GB) of logs per month, the estimated monthly cost would be around $27,475.
TechFit
Datadog is a strong fit for large enterprises already invested in its ecosystem and running cloud-first or containerized SAP landscapes that demand broad visibility across both SAP and non-SAP services. It works well for organisations prioritising a single pane of glass across hybrid environments, and that can budget for higher monitoring costs.
3. New Relic
Known for
New Relic is a full-stack observability platform that shifted to a usage-based pricing model, charging primarily for data ingest and user seats. It is recognized for its clean UI, flexible dashboards, and strong developer experience. Many enterprises adopt New Relic for its balance of breadth, ease of use, and flexibility across cloud and application monitoring.
SAP Monitoring Features
- ABAP dumps (ST22): Collected as logs and correlated with trace data.
- Background jobs (SM37): Monitored through job execution logs and performance metrics.
- HANA metrics: Memory, disk, query performance, and replication captured via host and DB monitoring.
- RFC calls: Monitored through distributed tracing and custom instrumentation.
- SAP server infrastructure: CPU, memory, and OS metrics captured by New Relic’s infrastructure agents.
Key Features
- Unified telemetry ingestion (logs, metrics, traces, events) in one platform.
- Powerful dashboards with flexible querying (NRQL).
- Synthetic monitoring and real user monitoring for SAP Fiori and web interfaces.
- AI-driven incident correlation with New Relic Alerts.
- Free tier for low-volume monitoring.
Pros
- Flexible platform with clean, developer-friendly dashboards.
- Transparent pricing model with free tier to get started.
- Strong in digital experience monitoring (synthetic + RUM).
Cons
- Costs scale with ingestion; high-volume SAP telemetry can get expensive.
- Complex initial setup
- The UI can feel overwhelming for new users
Pricing
- Free Tier: 100GB/month ingested
- Pro plan: $0.40/GB ingested beyond the free 100GB limit
- Pro Plan: $349/user for full platform user
New Relic SAP Monitoring Pricing at Scale
A mid-sized SaaS company ingesting 45TB (~45,000 GB) of telemetry data per month and with 10 full users, the cost would come around ~$25,990/month.
TechFit
New Relic is best suited for midmarket and enterprise teams that want a developer-friendly observability tool with modern dashboards and flexible pricing at lower volumes. It works well for organizations already using New Relic for cloud-native applications and looking to extend coverage into SAP by forwarding logs and metrics. However, it’s less ideal for SAP-heavy enterprises generating massive telemetry volumes, where ingestion-based pricing quickly becomes a budget challenge.
4. Dynatrace
Known for
Dynatrace is an enterprise-grade observability platform renowned for its automation and AI-powered diagnostics through the Davis AI engine. It automatically maps dependencies across applications, infrastructure, and services, making it a popular choice for large organizations running complex hybrid SAP landscapes.
SAP Monitoring Features
Dynatrace has deeper SAP coverage than many competitors thanks to its enterprise focus. It can monitor:
- ABAP dumps (ST22): Captured as logs and correlated with service health.
- Background jobs (SM37): Visibility into execution times, failures, and delays.
- Enqueue/lock conflicts (SM12): Highlighted when transaction throughput is blocked.
- HANA database metrics: Memory, query times, replication lag, and CPU performance.
- RFC and IDoc performance: Tracked across SAP and non-SAP integrations.
- User experience monitoring: SAP Fiori and web interfaces tested through synthetic and real user monitoring.
Key Features
- Automatic topology discovery and service dependency mapping.
- AI-powered anomaly detection and incident correlation.
- Full-stack observability: logs, metrics, traces, infra, and security.
- Real user monitoring and synthetic transaction testing.
- Enterprise-focused governance, access control, and compliance.
Pros
- Strongest enterprise adoption among SAP-heavy organizations.
- Davis AI provides automated root cause analysis.
- Rich SAP-related integrations compared to most competitors.
Cons
- Pricing can be steep, especially for full-stack monitoring.
- Learning curve can be high for new users.
Pricing
- Infrastructure Monitoring: $29/mo/host
- Full-Stack Monitoring: $58/mo/8 GiB host
Dynatrace SAP Monitoring Pricing at Scale
A mid-sized SaaS company operating 125 APM hosts, 200 infrastructure hosts, ingesting approximately 10 TB (≈10,000 GB) of logs, generating 300,000 custom metrics, consuming 1.5 million container hours, and producing around 45,000 GB of observability data egress (charged by the cloud provider) would incur an estimated monthly cost of approximately $21,850.
TechFit
Dynatrace is best suited for large global enterprises running mission-critical SAP systems where downtime directly impacts revenue. It excels in hybrid and multi-cloud SAP deployments that demand automated root cause detection, dependency mapping, and real user experience monitoring. Basis teams with limited bandwidth benefit from its AI-driven insights, though its high costs and enterprise-focused contracts make it less attractive for smaller or cost-sensitive organizations.
5. ManageEngine Applications Manager
Known for
ManageEngine Applications Manager is known for being a cost-effective IT monitoring tool that caters to small and mid-sized businesses. Unlike premium vendors, it provides pre-built modules for application, database, and server monitoring, including dedicated SAP monitoring support, at a relatively affordable license-based cost.
SAP Monitoring Features
Applications Manager includes built-in SAP monitors that cover key Basis requirements:
- ABAP dumps (ST22): Captures runtime errors to prevent transaction failures.
- Background jobs (SM37): Monitors scheduled tasks for slowdowns or failures.
- Enqueue/lock table (SM12): Tracks lock contention that could freeze processes.
- SAP CCMS metrics: Integrates with SAP’s Computing Center Management System for core system KPIs.
- SAP HANA database health: Tracks memory, disk, CPU usage, and query times.
- RFC and IDoc monitoring: Detects integration errors and latency.
Key Features
- Pre-built SAP monitoring dashboards.
- Cross-stack monitoring: servers, databases, apps, VMs.
- Root cause analysis with basic correlation features.
- On-prem deployment for security and control.
- Alerting and SLA reporting.
Pros
- Affordable licensing compared to enterprise-grade tools.
- Out-of-the-box SAP-specific monitoring modules.
- Simple to deploy and manage for small teams.
Cons
- Complex initial setup, which requires expertise
- Steep learning curve for new users
Pricing
- Free Edition – Up to 5 monitors, basic monitoring features.
- Professional Edition – Starts around $395/year, suitable for small setups with limited SAP instances.
- Enterprise Edition – Starts around $1,995/year, includes advanced application, DB, and SAP monitoring.
- SAP Add-on Pack – Around $2,395/year per SAP instance, for ABAP, HANA, and Basis-level monitoring.
ManageEngine SAP Monitoring Pricing at Scale
For a midsized enterprise with 40 SAP application servers and 5 HANA databases, the SAP Add-on Pack alone would cost around $8,000/month ((15 × 200)). Adding an Enterprise Edition license at $166/month brings the total to about $3,166/month. While more affordable than usage-based vendors like Datadog or Dynatrace at 10TB scale, ManageEngine’s model requires buying new add-ons for every SAP instance, which makes scaling costs less predictable in large landscapes.
TechFit
ManageEngine Applications Manager is a good fit for small to mid-sized enterprises that want affordable, out-of-the-box SAP monitoring without complex licensing. It suits organizations that need basic SAP metrics and health checks rather than full observability or AI-driven automation. For Basis teams with limited budgets, it offers a practical entry point, but it may struggle in global-scale SAP deployments where telemetry volumes are high and deep correlation is required.
6. IBM Instana

Known for
IBM Instana is recognized as a modern APM and observability platform that focuses on real-time monitoring with automatic discovery and dependency mapping. Since IBM’s acquisition, Instana has gained traction with enterprises running complex hybrid applications, including SAP workloads, by emphasizing speed, automation, and ease of deployment.
SAP Monitoring Features
Instana offers SAP-focused integrations and can monitor key layers through agents and log forwarding:
- ABAP dumps (ST22): Collected as events and linked to transactions.
- Background jobs (SM37): Visibility into failures, runtimes, and job queues.
- SAP HANA database metrics: Tracks memory, query execution time, replication, and CPU load.
- RFC and IDoc performance: Identifies latency and errors in SAP integrations.
- Infrastructure monitoring: OS, VM, and container performance for SAP servers.
- Transaction tracing: Distributed traces that connect SAP calls to non-SAP microservices and APIs.
Key Features
- Automatic application discovery and service dependency mapping.
- Real-time, one-second granularity metrics for fast troubleshooting.
- AI-powered incident correlation and anomaly detection.
- Built-in support for cloud-native and containerized environments.
- Dashboards tailored for SAP Basis monitoring and enterprise applications.
Pros
- Strong automation with minimal manual configuration.
- Real-time metrics (1-second granularity) enhance SAP performance insights.
- Seamless tracing between SAP and non-SAP applications.
Cons
- Higher pricing compared to mid-market tools.
- Expensive as usage grows
Pricing
- Standard Tier (SaaS): USD 75 / MVS / month
IBM Instana SAP Monitoring Pricing at Scale
For a mid-sized enterprise running around 125 hosts for SAP monitoring $75 per host, per month, would cost roughly $8,500 per month. This per-host model can add up quickly for teams managing microservices or containerized environments, where the number of active hosts often scales beyond initial estimates.
TechFit
Instana is a strong choice for enterprises modernizing their SAP landscapes alongside cloud-native applications. It fits well for teams that need real-time observability with minimal manual configuration, particularly in hybrid deployments where SAP integrates with microservices and APIs. However, organizations that prioritize transparent pricing or SAP-native depth may find Instana less appealing compared to CubeAPM or ManageEngine.
7. Azure Monitor
Known for
Azure Monitor is Microsoft’s cloud-native observability platform, built into the Azure ecosystem. It offers deep integrations for monitoring infrastructure, apps, and databases, with a dedicated Azure Monitor for SAP Solutions (AMS) that provides certified monitoring for SAP NetWeaver, S/4HANA, and HANA databases hosted on Azure.
SAP Monitoring Features
Azure Monitor for SAP Solutions enables teams to:
- Track SAP HANA database metrics: memory, CPU, query latency, replication health.
- Monitor ABAP stack availability and application server performance.
- Collect OS-level metrics from SAP application servers and database hosts.
- Integrate with Azure Log Analytics for querying SAP events.
- Leverage Azure-native dashboards, alerts, and security compliance features.
Key Features
- Unified telemetry collection across Azure workloads and SAP systems.
- Preconfigured dashboards for SAP HANA, NetWeaver, and S/4HANA.
- Integrates with Azure Security Center and Sentinel for compliance.
- Scales natively with Azure services (VMs, storage, etc.).
- Pay-as-you-go pricing with no additional license for AMS itself.
Pros
- Certified by SAP for Azure-hosted deployments.
- Seamless integration if SAP runs on Azure.
- No license fees for AMS — only pay for ingestion and retention.
Cons
- Pricing complexity due to multiple Azure components (Log Analytics, storage, queries).
- High ingestion volumes can escalate costs.
Pricing
- First 5 GB/month free.
- Basic Logs: $0.50/GB
- Analytics Logs:2.30/GB
Azure Monitor SAP Monitoring Pricing at Scale
For a midsized enterprise ingesting 10TB of SAP telemetry per month, split into 2TB analytics logs and 8TB basic logs, the costs break down as follows. Analytics logs at $2.30/GB come to $4,600 (2,000 × 2.30), while basic logs at $0.50/GB add $4,000 (8,000 × 0.50). Adding 30-day retention at $0.12/GB across the full 10TB contributes another $1,200 (10,000 × 0.12). Together, this equals a total of about $9,800/month, showing how costs scale sharply with higher-tier analytics logs.
TechFit
Azure Monitor is a strong fit for enterprises running SAP on Azure or RISE with SAP that want native integration and certified support for SAP HANA and NetWeaver. It delivers compliance-ready monitoring and unified dashboards across Azure workloads.
8. SAP Solution Manager / SAP Cloud ALM
Known for
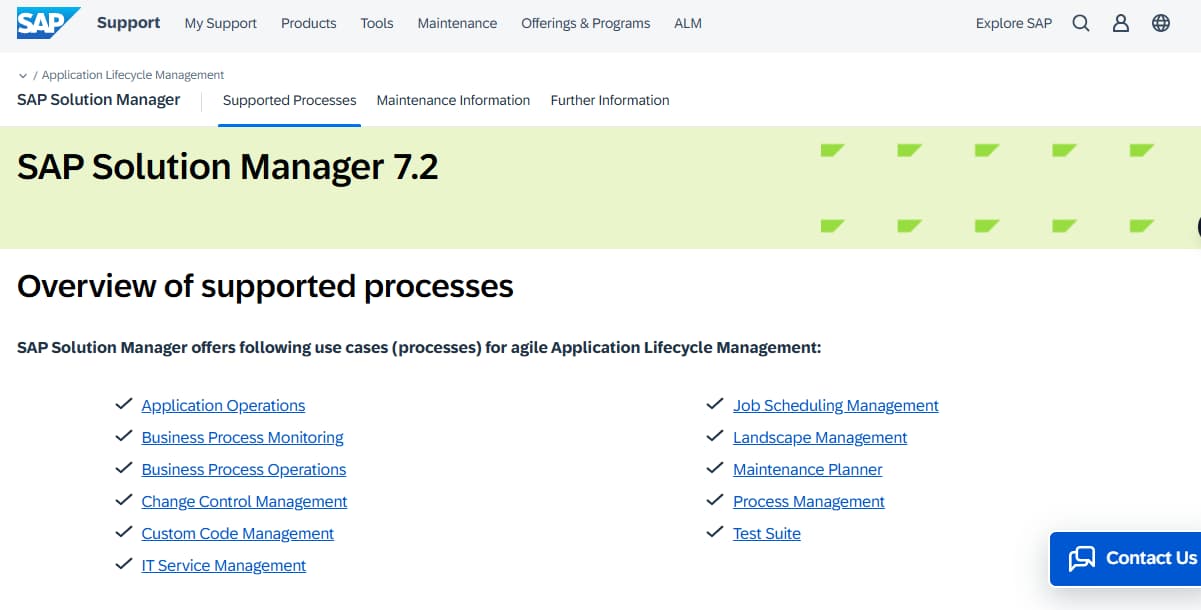
SAP Solution Manager (SolMan) and its successor SAP Cloud ALM are the official SAP monitoring and lifecycle management tools. They are deeply integrated into SAP landscapes and cover configuration, operations, and system health. While SolMan is on-prem and widely used in ECC and early S/4HANA deployments, Cloud ALM is SAP’s cloud-native monitoring platform designed for SaaS and RISE with SAP customers.
SAP Monitoring Features
As SAP-native tools, they offer out-of-the-box coverage for:
- ABAP dumps (ST22): Full visibility into runtime errors.
- Background jobs (SM37): Monitoring of scheduled and failed jobs.
- Enqueue/lock table (SM12): Conflict detection and lock analysis.
- Spool monitoring: Ensures output requests are processed correctly.
- SAP HANA metrics: Memory, CPU, replication, and query health.
- Business process monitoring: Track performance of end-to-end SAP transactions.
- Integration monitoring: Covers RFC, IDoc, and interface errors.
Key Features
- Deepest integration into SAP NetWeaver, ECC, and S/4HANA stacks.
- End-to-end transaction monitoring for SAP modules (finance, logistics, HR).
- Compliance and audit support as part of SAP contracts.
- Business process and job scheduling insights.
- Cloud ALM adds SaaS dashboards for RISE with SAP and cloud integrations.
Pros
- Native and official SAP tools — no extra vendor required.
- Full SAP-specific feature set (dumps, jobs, enqueue, spool).
- Covered under SAP support agreements.
Cons
- UI and reporting are less modern compared to third-party observability platforms.
- Scaling and correlation across large telemetry volumes is cumbersome.
Pricing
- No public disclosure
- Solution Manager is included in SAP maintenance contracts (no extra license).
- Cloud ALM is free for SAP Enterprise Support customers but comes with usage limits.
SAP Solution Manager SAP Monitoring Pricing at Scale
For a midsized enterprise generating 10TB/month of SAP telemetry, SolMan and Cloud ALM do not charge per GB, but scaling becomes a hidden cost in terms of Basis team hours, infrastructure overhead, and integration with non-SAP monitoring. While cheaper on paper, enterprises often supplement SolMan/Cloud ALM with third-party tools for complete visibility, raising overall TCO.
TechFit
SolMan and Cloud ALM are a fit for SAP-first organizations that want deep transaction and Basis-level monitoring included in their SAP contracts. They are ideal for teams focusing on core SAP application health, ABAP errors, and job monitoring. However, they fall short for enterprises with hybrid or multi-cloud SAP environments, where visibility across non-SAP workloads, cost predictability, and modern observability features are critical.
9. Paessler PRTG
Known for
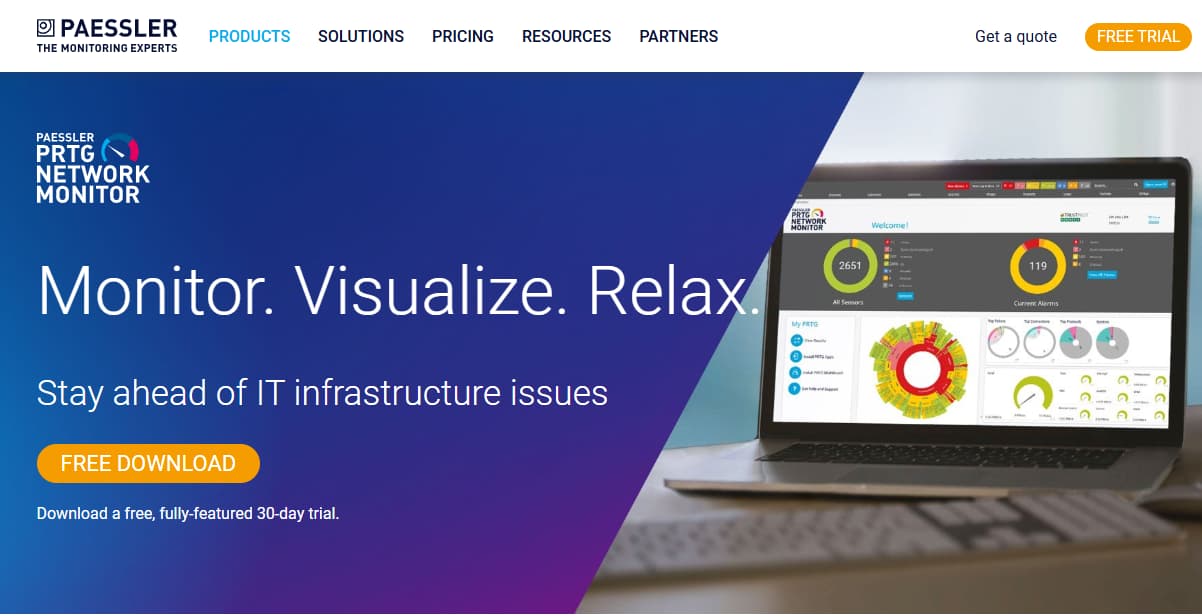
Paessler PRTG is an agentless, sensor-based monitoring tool designed for IT infrastructure, networks, and applications. Its flexible sensors allow organizations to extend monitoring into SAP landscapes, particularly for HANA databases, ABAP servers, and SAP Basis metrics.
SAP Monitoring Features
- SAP HANA metrics: CPU, memory, replication, query times.
- ABAP server performance: Availability and response times.
- Background jobs: Runtime monitoring with log forwarding.
- RFC/IDoc checks: Detect delays and errors.
- OS-level monitoring: CPU, RAM, and storage for SAP hosts.
Key Features
- 250+ sensor types for applications, databases, and infrastructure.
- Custom dashboards and reporting.
- Flexible deployment (on-premises or hosted).
- Alerting via email, SMS, and push notifications.
- Licensing tied to sensor count, not per-GB data.
Pros
- Predictable, subscription-based pricing.
- Easy to deploy and scale for mid-sized enterprises.
- Covers the full IT stack beyond SAP.
Cons
- Complex setup
- Management adds operational overhead
Pricing
- PRTG 500: $179/month (up to 500 aspects, ~50 devices).
- PRTG 1000: $325/month (up to 1,000 aspects, ~100 devices).
- PRTG 2500: $675/month (up to 2,500 aspects, ~250 devices).
- PRTG 5000: $1,183/month (up to 5,000 aspects, ~500 devices).
- PRTG 10000: $1,492/month (up to 10,000 aspects, ~1,000 devices).
- PRTG Enterprise: $1,671+/month (beyond 10,000 aspects, multi-location).
PRTG SAP Monitoring Pricing at Scale
For a midsized SAP landscape with 200 servers, 10 HANA databases, and supporting infrastructure, around 5,000 sensors would be required. On PRTG’s verified pricing, this equals about $1,671/month on the PRTG 10000 plan.
TechFit
PRTG is ideal for mid-sized SAP deployments seeking affordable, predictable monitoring without per-GB data charges. It’s especially useful for Basis teams that want a flexible tool to cover both SAP and non-SAP infrastructure.
10. SolarWinds
Known for
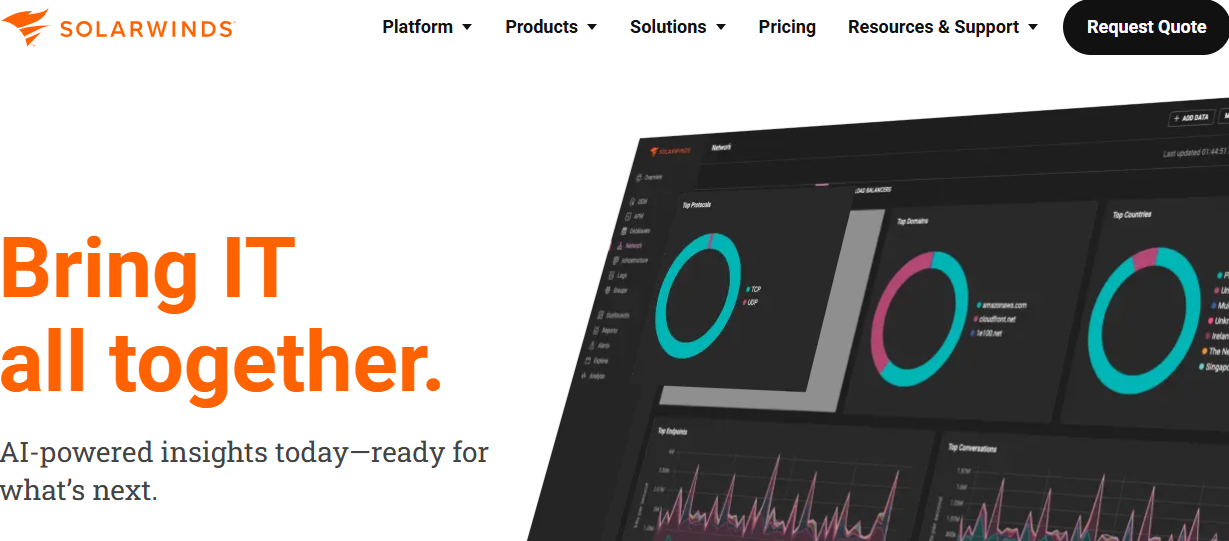
SolarWinds is known for its infrastructure and database monitoring strength, often used by IT teams that manage large-scale on-premises deployments. It provides SAP-certified database monitoring (Oracle, SQL Server, HANA) and system health metrics, making it useful for SAP Basis teams that want to monitor the foundation of their SAP landscapes.
SAP Monitoring Features
While not SAP-native, SolarWinds can monitor the critical layers underpinning SAP environments:
- SAP HANA databases: Performance, memory usage, query execution times, and replication health.
- ABAP server infrastructure: CPU, memory, disk, and OS metrics of SAP application servers.
- Background job performance: Job runtimes and delays detected through database and system logs.
- RFC and IDoc activity: Limited visibility via database or log-level monitoring.
- SAP-certified integrations: Database monitoring modules for SAP-supported platforms.
Key Features
- Database monitoring (HANA, Oracle, SQL Server, DB2).
- Infrastructure health dashboards with customizable alerts.
- Application dependency mapping (via SolarWinds SAM).
- Real-time performance charts and anomaly alerts.
- On-premises deployment for compliance and control.
Pros
- Strong for SAP database performance monitoring.
- Affordable compared to premium enterprise APM vendors.
- Mature infrastructure and network monitoring capabilities.
Cons
- Expensive as usage grows
- Overwhelming UI for new users
Pricing
- Monitoring & Observability – Starts at $7 per node/month
- Database Monitoring – Starts at $142 per database/month
- Service Management – Starts at $39 per technician/month
- Incident Response – Starts at $9 per user/month
SolarWinds SAP Monitoring Pricing at Scale
For a midsized enterprise with 200 SAP application servers, 10 HANA databases, and a small Basis team of 5 technicians plus 50 end users needing incident visibility, SolarWinds costs scale as follows: monitoring and observability at $1,400 (200 × 7), database monitoring at $1,420 (10 × 142), service management at $195 (5 × 39), and incident response at $450 (50 × 9). Together this totals around $3,465/month
TechFit
SolarWinds is a fit for IT teams managing SAP on traditional infrastructure that want strong visibility into databases, servers, and OS health at an affordable price. It is ideal for organizations that prioritize infrastructure and HANA performance but do not require deep SAP transaction-level monitoring. For enterprises shifting to RISE with SAP, cloud-native, or hybrid workloads, SolarWinds often needs to be paired with another observability platform to close gaps.
Conclusion
Monitoring SAP environments goes beyond simple uptime checks — it requires visibility into ABAP dumps, background jobs, locks, RFCs, and HANA performance alongside the infrastructure and cloud layers that support them. With SAP downtime costing up to $300,000 per hour, the right monitoring tool can make the difference between smooth operations and costly disruption.
While SAP Solution Manager and Cloud ALM cover the basics, many enterprises need broader capabilities. Vendors like Datadog, New Relic, Dynatrace, Instana, ManageEngine, and SolarWinds extend coverage into cloud, infrastructure, and non-SAP workloads, but each comes with trade-offs in pricing, scalability, or SAP-native depth.
CubeAPM brings a fresh approach with flat $0.15/GB pricing, smart sampling, and SAP-aware observability that scales to 10TB+ of monthly telemetry. It enables Basis teams to monitor SAP and non-SAP systems in one platform, delivering the cost predictability, compliance flexibility, and deep visibility modern enterprises demand.
Disclaimer: The information in this article reflects the latest details available at the time of publication and may change as technologies and products evolve.
FAQs
1. What is SAP monitoring and why is it important?
SAP monitoring is the process of tracking the health, performance, and availability of SAP systems such as S/4HANA, ECC, ABAP stacks, and HANA databases. It helps detect issues like ABAP dumps, stalled background jobs, and database slowdowns before they impact users. Since SAP downtime can cost enterprises hundreds of thousands per hour, proactive monitoring is critical.
2. Which SAP monitoring tool is best for hybrid or multi-cloud environments?
For hybrid environments that combine on-premises SAP systems with cloud workloads, tools like CubeAPM and Dynatrace are strong options. CubeAPM excels at cost predictability and correlating SAP telemetry with non-SAP services, while Dynatrace offers AI-driven automation for large-scale enterprises.
3. Does SAP provide its own monitoring tools?
Yes. SAP offers Solution Manager (SolMan) and Cloud ALM for monitoring and lifecycle management. These tools provide strong SAP-native features such as background job tracking, enqueue monitoring, and business process analytics. However, they offer limited visibility into non-SAP workloads, which is why many enterprises adopt third-party solutions alongside them.
4. How much does SAP monitoring cost with modern tools?
Costs vary significantly. Consumption-based vendors like Datadog or New Relic often run into $10,000–$15,000/month for midsized enterprises ingesting 10TB of SAP telemetry, while Dynatrace and Instana may push costs even higher under enterprise contracts. CubeAPM, on the other hand, offers a flat $0.15/GB, making 10TB of ingestion cost about $1,500/month, which is far more predictable.
5. Can SAP monitoring tools help with compliance requirements?
Yes. Many enterprises run SAP systems that handle sensitive financial, HR, or healthcare data. Tools like CubeAPM support GDPR, HIPAA, and DPDP compliance with self-hosting or Bring-Your-Own-Cloud (BYOC) deployment options, ensuring telemetry never leaves the company’s control. This makes compliance much easier compared to SaaS-only solutions.


