Servers remain the backbone of modern infrastructure, powering applications, APIs, and Kubernetes workloads across on-premises and hybrid clouds. Monitoring them is critical, as issues with CPU, memory, disk I/O, or network usage can escalate into downtime and revenue loss. In fact, even one hour of downtime can cost organizations over $300,000, underscoring the need for smarter, server-centric, and cost-efficient monitoring platforms.
CubeAPM is purpose-built for servers, capturing CPU, memory, disk, and network metrics alongside process, Kubernetes, and cloud data streams. All server telemetry flows into one view, instantly linked with logs and traces for root-cause analysis.
In this article, we explore the top server monitoring tools, comparing their ability to track CPU, memory, disk, network performance, uptime, and error rates to help teams choose the right solution.
Top Server Monitoring Tools
- CubeAPM
- Dynatrace
- ManageEngine OpManager
- Datadog
- SolarWinds Server & Application Monitor
- New Relic
- PRTG Network Monitor
- Zabbix
- LogicMonitor
What is a Server Monitoring Tool?
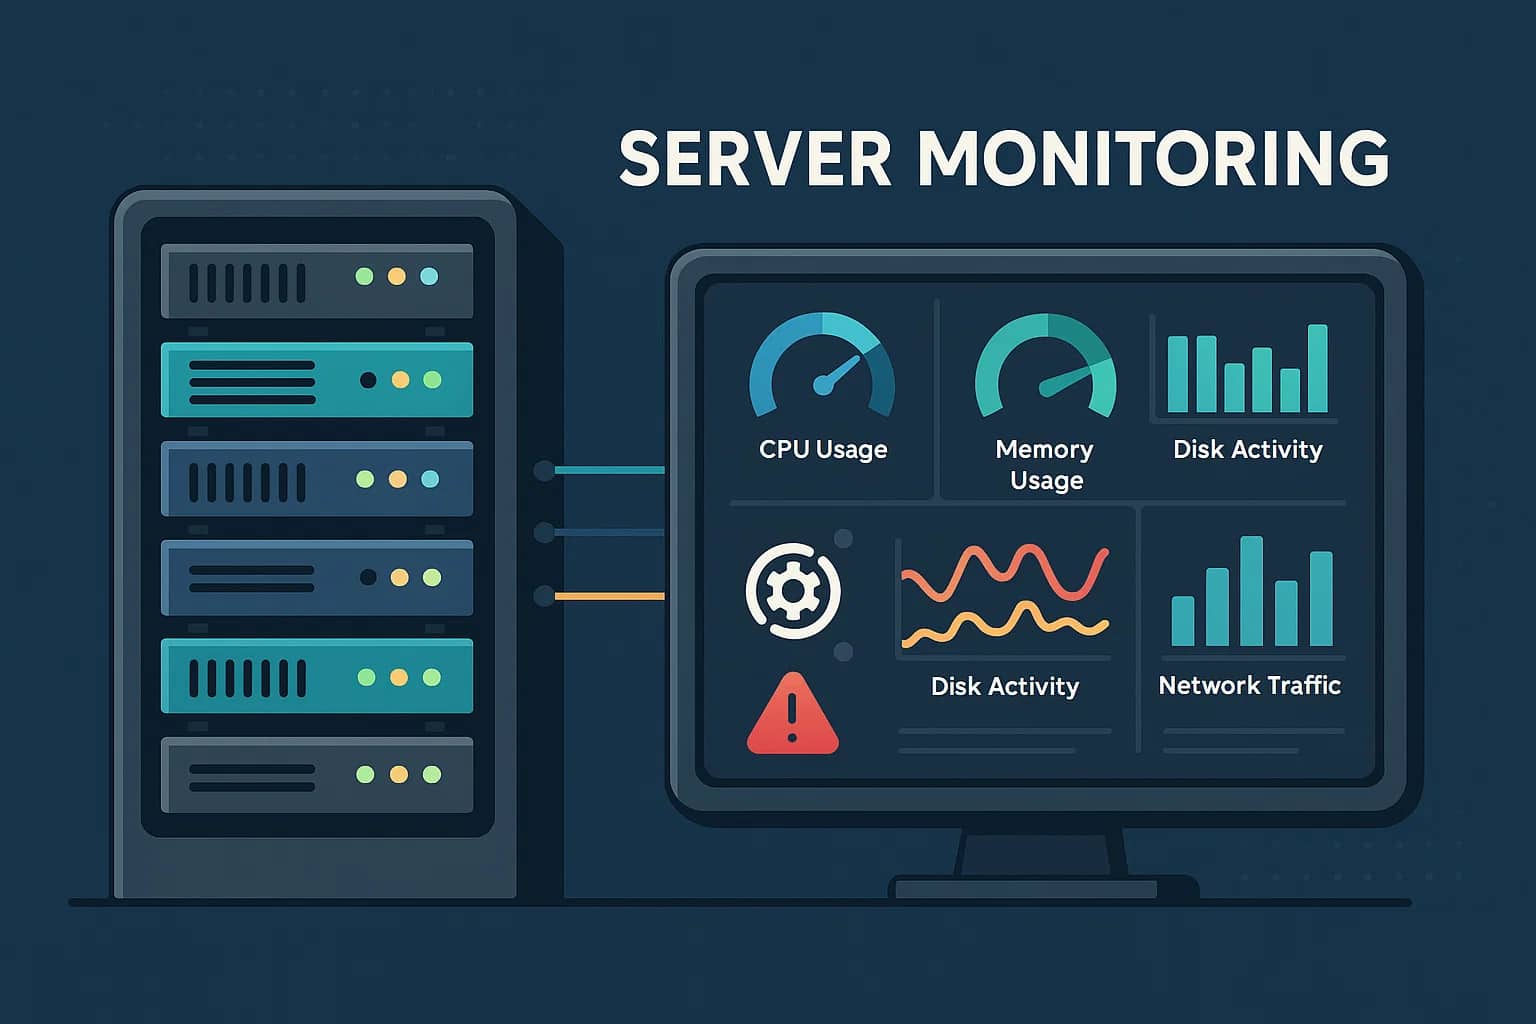
A server monitoring tool is specialized software that keeps a constant watch on the health, performance, and availability of servers—whether they’re physical machines in a data center, virtual machines running on VMware or Hyper-V, or cloud instances in AWS, Azure, or GCP. Since servers host the critical workloads that power applications, APIs, and databases, any slowdown or failure can directly impact users and business outcomes. The role of server monitoring is to ensure these machines are stable, efficient, and available at all times, while giving IT teams the visibility to anticipate and resolve issues before they become outages.
To achieve this, modern server monitoring platforms collect and analyze a wide range of key metrics:
- CPU usage: High or sustained CPU usage can slow down applications and cause overheating, which leads to degraded performance or even system crashes. Monitoring CPU trends helps administrators spot runaway processes, optimize workloads, and plan for scaling.
- Memory utilization: Servers running out of available RAM may freeze or trigger swap activity, drastically reducing performance. Monitoring memory helps identify leaks in applications, poor resource allocation, and ensures that servers can handle peak demand without breaking down.
- Disk activity & I/O: Slow or failing disks are a common bottleneck in server performance. Monitoring read/write speeds, storage utilization, and input/output operations per second (IOPS) provides insight into when a disk is nearing capacity, suffering from high latency, or on the verge of failure.
- Network throughput: Servers rely on stable network connectivity for communication between applications, users, and services. Monitoring bandwidth, packet loss, and latency helps identify bottlenecks, misconfigurations, or DDoS-style traffic spikes that could interrupt service delivery.
- Uptime & availability: A core part of server monitoring is ensuring that machines are online and accessible. Tools track availability in real time and generate instant alerts the moment a server goes down, minimizing the mean time to detect (MTTD) and mean time to repair (MTTR).
- Error logs & events: Beyond metrics, server monitoring tools capture system logs, crashes, and critical errors that reveal underlying issues. Correlating these events with metrics allows teams to pinpoint the exact cause of a failure, whether it’s a faulty process, misconfigured service, or hardware fault.
Example: How CubeAPM Handles Server Monitoring
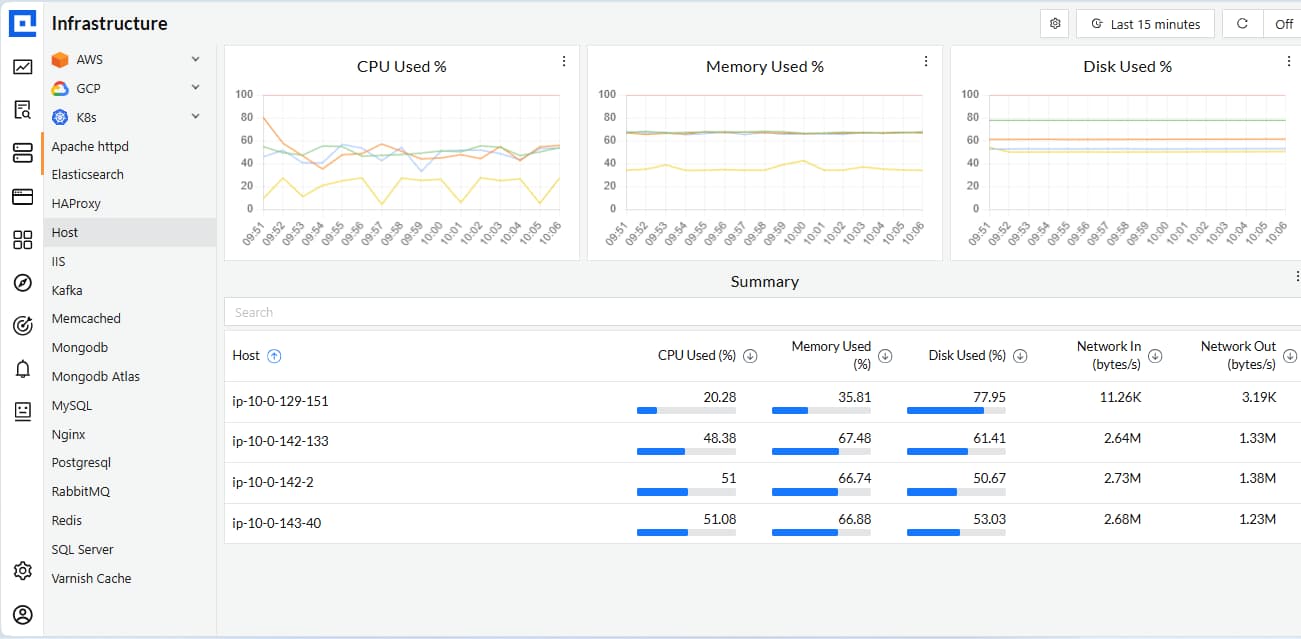
CubeAPM approaches server monitoring with a host-first design, ensuring every server—bare-metal, VM, or cloud node—feeds its health signals into a unified platform. The OpenTelemetry Collector Contrib can be deployed directly on Linux, Windows, or macOS servers, or as a Helm DaemonSet on Kubernetes clusters, so CubeAPM starts ingesting CPU, memory, disk, filesystem, and network metrics in real time. From there, the platform layers on deeper visibility and integrations that make server monitoring both comprehensive and actionable:
- Process-Level Insights: Extends visibility down to individual processes, mapping CPU and memory usage back to their parent containers via cgroup data—making it clear which processes are straining server resources.
- Kubernetes Awareness: Tracks nodes, pods, containers, and volumes while capturing critical cluster events (e.g., OOMKilled, pod evictions). This gives engineers full context into how server performance issues ripple across workloads.
- Hybrid Cloud Support: Natively ingests AWS CloudWatch Metric Streams through Amazon Data Firehose and scrapes Prometheus exporters with the Collector, consolidating metrics from EC2 instances, on-prem servers, and multi-cloud clusters into one view.
- Logs & Traces Correlation: Enriches logs with contextual fields like host.name and host.ip. When combined with trace_id, this allows teams to jump seamlessly from a hot server to the exact request or transaction causing the problem—dramatically reducing troubleshooting time.
Why Teams Choose Different Server Monitoring Tools
Selecting a server monitoring tool is rarely one-size-fits-all. Teams evaluate options based on infrastructure scale, compliance needs, cost models, and integration with existing workflows. These differences explain why organizations often move between tools as their environments and priorities evolve.
1. Infrastructure complexity
Modern IT stacks combine bare-metal servers, VMs, and containers across hybrid and multi-cloud environments. Teams need monitoring platforms that unify these layers, ensuring consistent visibility regardless of deployment type.
2. Cost and licensing pressures
Per-host or per-feature pricing can drive bills into the thousands for midsized companies. Teams increasingly look for transparent, usage-based pricing models that scale fairly with telemetry volume instead of host count.
3. Integration with DevOps workflows
Monitoring tools are most valuable when they connect with CI/CD pipelines, ticketing systems, and on-call platforms. Easy integrations with Slack, Jira, or ServiceNow influence adoption and reduce incident response time.
4. Depth of server telemetry
Basic CPU and memory metrics are no longer enough. Teams want process-level monitoring, hardware health checks, and Kubernetes event tracking to pinpoint bottlenecks and failing services quickly.
5. Smarter alerting
Legacy systems often overwhelm engineers with false alarms. Teams now seek AI-driven thresholds and anomaly detection that reduce noise and surface only actionable alerts.
6. Security and access control
With growing cybersecurity concerns, teams prefer tools that integrate with identity providers, SIEM platforms, and RBAC policies. Security alignment is becoming a critical selection factor.
7. Ease of deployment and management
Monitoring platforms that require heavy setup or complex scaling add operational burden. Teams often switch to tools with lighter agents, simple collectors, or SaaS options that reduce maintenance.
8. Visualization and reporting
Executives demand clear SLA dashboards and uptime reports, while engineers need detailed per-host metrics. Tools with flexible visualization and reporting capabilities help meet both audiences’ needs.
Top 9 Server Monitoring Tools
1. CubeAPM
Known for
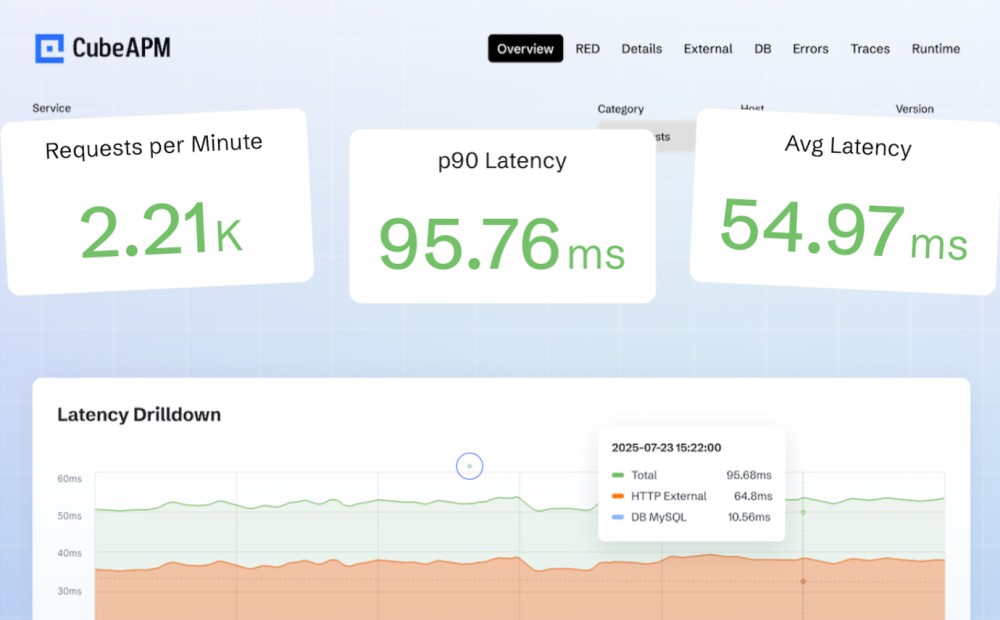
CubeAPM is known for delivering deep server monitoring with cost predictability. It is purpose-built to track CPU, memory, disk, network, and process-level metrics across bare metal, VMs, and Kubernetes nodes, while seamlessly correlating them with logs and traces. Its host-first design, OpenTelemetry compatibility, and hybrid deployment flexibility make it a powerful choice for organizations that want both technical depth and compliance-ready control.
Server Monitoring Features
- Host-first deployment via OpenTelemetry Collector on Linux, Windows, macOS, or Kubernetes.
- Real-time tracking of CPU, memory, disk, filesystem, and network metrics.
- Process-level monitoring via cgroup data to identify resource-heavy processes.
- Kubernetes support for nodes, pods, containers, volumes, and events (e.g., OOMKilled, pod evictions).
- Hybrid cloud support with AWS CloudWatch Metric Streams and Prometheus exporters.
- Logs enriched with host.name and host.ip, correlated with traces via trace_id.
Key Features
- Unified MELT (Metrics, Events, Logs, Traces).
- Smart sampling to optimize ingestion volumes and costs.
- Flexible deployment: SaaS, hybrid, or full on-prem.
- 800+ integrations with DevOps and cloud tools.
- Direct Slack/WhatsApp support with engineers for rapid incident response.
Pros
- End-to-end visibility into server health.
- Lower cost of ownership vs. legacy tools.
- Easy correlation between infra, logs, and traces.
- Hybrid deployment meets compliance needs.
Cons
- Not suited for teams looking for off-prem solutions
- Strictly an observability platform and does not support cloud security management
Pricing
- Flat pricing of $0.15/GB ingestion.
CubeAPM Server Monitoring Pricing at Scale
*All pricing comparisons are calculated using standardized Small/Medium/Large team profiles defined in our internal benchmarking sheet, based on fixed log, metrics, trace, and retention assumptions. Actual pricing may vary by usage, region, and plan structure. Please confirm current pricing with each vendor.
For a mid-sized SaaS company ingesting 45TB(~45,000) total monthly data ingestion and 45,000TB of observability data outcharged by the cloud provider, the total cost will be about ~$7200/month.
Tech Fit
CubeAPM is best suited for organizations running large-scale, server-heavy environments—from e-commerce platforms with thousands of VMs to Kubernetes clusters with hundreds of nodes. It fits teams that need granular host metrics, strong log and trace correlation, and predictable costs without sacrificing compliance or control.
2. Dynatrace

Known for
Dynatrace is known for its AI-powered monitoring and automation, designed for enterprises running complex, distributed environments. It automatically discovers servers, applications, services, and dependencies across hybrid and multi-cloud setups, giving IT teams a holistic view without extensive manual configuration. Its built-in Davis AI engine helps detect anomalies and predict issues before they disrupt critical workloads.
Server Monitoring Features
- Automatic detection of hosts, processes, and containers with OneAgent.
- Continuous monitoring of CPU, memory, disk, and network performance.
- Process and service mapping to show how server activity impacts applications.
- Built-in log monitoring with correlation to server events.
- Integration with VMware, Kubernetes, and major cloud providers for hybrid visibility.
- AI-driven anomaly detection to flag unusual server behavior.
Key Features
- Full-stack observability (APM, infrastructure, RUM, synthetics, logs, security).
- Smartscape topology maps for real-time dependency visualization.
- Davis AI for anomaly detection, root cause analysis, and auto-remediation.
- Cloud-native monitoring with Kubernetes and container visibility.
- Strong support for enterprise-grade compliance and governance.
Pros
- Powerful automation and AI-driven insights.
- Minimal manual setup—auto-discovery accelerates deployment.
- Excellent visibility across hybrid and multi-cloud environments.
- Strong for large, distributed infrastructures.
Cons
- Expensive as usage grows.
- Can be complex for smaller teams to adopt.
- Steeper learning curve compared to simpler monitoring tools.
Pricing
- Full-Stack Monitoring: $0.08 per hour for an 8 GiB host
- Infrastructure Monitoring: $0.04 per hour per host
- Synthetic Monitoring: $0.001 per request
- Logs: $0.20 per GiB
Dynatrace Server Monitoring Pricing At Scale
A mid-sized SaaS company operating 125 APM hosts, 200 infrastructure hosts, ingesting approximately 10 TB (≈10,000 GB) of logs, generating 300,000 custom metrics, consuming 1.5 million container hours, and producing around 45,000 GB of observability data egress (charged by the cloud provider) would incur an estimated monthly cost of approximately $21,850.
Tech Fit
Dynatrace is a strong fit for large enterprises and regulated industries that run hundreds or thousands of servers across hybrid environments. It works best where teams need AI-assisted insights, automated discovery, and predictive analytics to manage scale and complexity.
3. ManageEngine OpManager
Known for
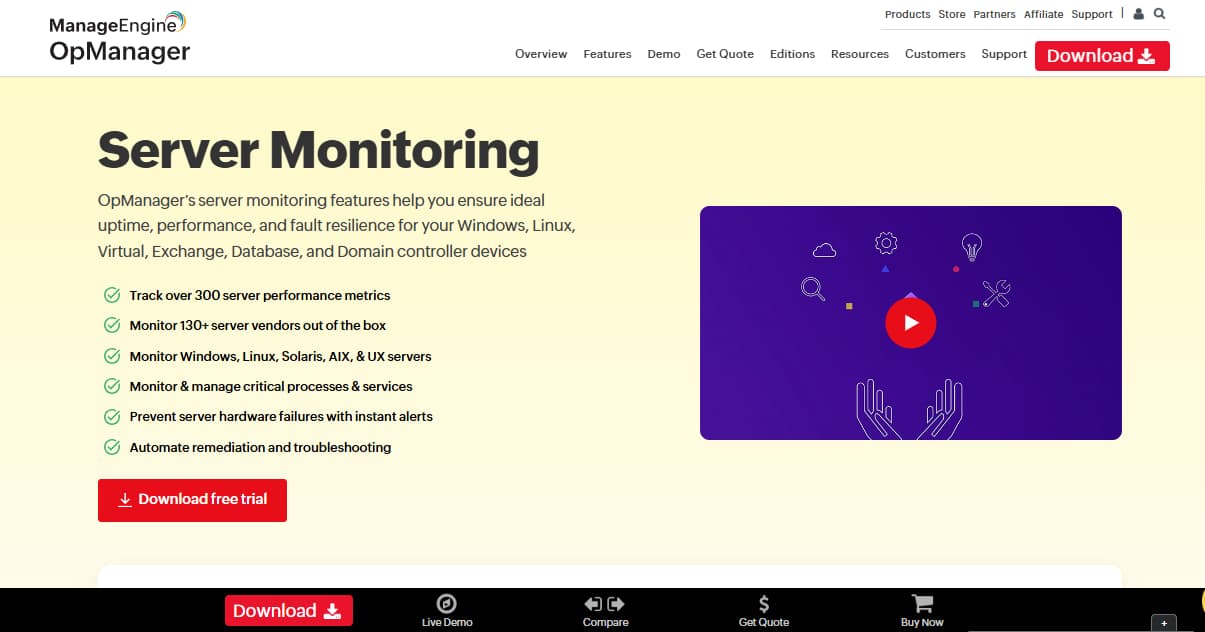
ManageEngine OpManager is known for being an affordable yet powerful server and network monitoring solution. It provides unified visibility across physical, virtual, and cloud servers with multi-vendor compatibility. Its ease of deployment, AI-powered alerting, and automated workflows make it especially attractive to IT teams seeking reliability without steep costs. OpManager is widely adopted by mid-sized enterprises that want comprehensive monitoring while keeping budgets under control.
Server Monitoring Features
- Availability monitoring with ICMP, SNMP, TCP, and WMI checks
- CPU, memory, disk, and traffic monitoring with threshold alerts
- Process and service monitoring with automated restarts
- Rack, floor, and data center visualization dashboards
- Automated remediation workflows with 70+ predefined actions
- Monitoring of Windows event logs, syslogs, and application logs
- Adaptive thresholds powered by machine learning
Key Features
- Multi-vendor support for Dell, HP, IBM, VMware, Hyper-V, and Nutanix
- Real-time dashboards with customizable widgets and visual layouts
- Bulk configuration management and server templating
- Customizable alerting via email, SMS, Slack, and ticketing integrations
- Predictive analysis and capacity planning capabilities
Pros
- Broad multi-vendor and multi-platform support
- Unified visibility across servers, networks, and data centers
- Automated remediation reduces downtime
- Affordable and transparent per-device pricing
- Easy to deploy with a minimal learning curve
Cons
- Overwhelming UI interface.
- Complex initial setup.
Pricing
- Standard Edition: $95/year for 10 devices
- Professional Edition: $145/year for 10 devices
- Enterprise Edition: $4,595/year for 250 devices
ManageEngine OpManager Server Monitoring Pricing At Scale
Enterprise Edition of OpManager is priced at $4,595/year for 250 devices (~$383/month). For a midsized company with 50 servers, this works out to around $920/year (~$77/month). However, real-world deployments usually require multiple add-ons (NCM, NTA, HA, storage packs) and premium support, which can drive costs into the $3,000–$5,000/month range depending on scale and modules.
Tech Fit
OpManager is a strong fit for mid-to-large enterprises managing hybrid or diverse server environments. It suits teams that need broad server visibility alongside network and data center monitoring in a single package. With automated workflows and AI-powered alerts, it helps IT staff reduce manual effort and resolve issues quickly.
4. Datadog
Known for
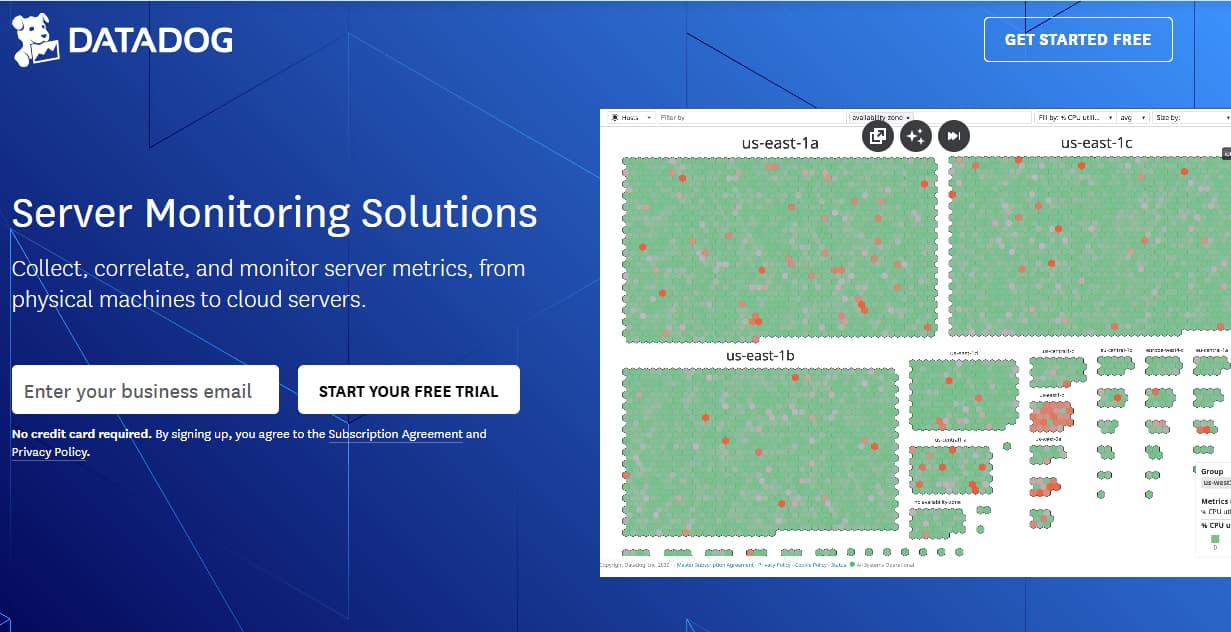
Datadog is known for being a cloud-native observability giant with deep integrations across infrastructure, applications, and services. It provides real-time dashboards, anomaly detection, and alerts, making it a favorite among DevOps and SRE teams. Its breadth of modules covers everything from servers to CI/CD, though costs often scale steeply as usage grows.
Server Monitoring Features
- Auto-discovery of servers and cloud instances
- CPU, memory, disk, and network metrics in real time
- Host maps to visualize server health at scale
- Container and Kubernetes node-level monitoring
- Log correlation with server activity
- AI-based anomaly detection for server metrics
Key Features
- Infrastructure monitoring, APM, logs, RUM, synthetics
- 900+ integrations across cloud and DevOps tools
- Customizable dashboards and advanced alerting
- Security and compliance monitoring modules
- Machine learning for anomaly detection
Pros
- Wide feature set covering full-stack monitoring
- Rich integrations across modern toolchains
- Excellent visualization and dashboards
- Strong community and ecosystem
- AI-driven alerts reduce noise
Cons
- Bills spike with host count and data ingest
- High costs for long retention
- Steeper learning curve for smaller teams
Pricing
- Infrastructure Monitoring: $15/host/month (Pro), $23/host/month (Enterprise)
- Kubernetes Autoscaling: $3 per vCPU/month (billed annually)
- Network Monitoring: $5 per host/month
- Logs: $0.10 per GB ingested, indexed separately
- APM: Starts around $31/host/month
Datadog Server Monitoring Pricing At Scale
For a mid-sized SaaS company operating 125 APM hosts, 40 profiled hosts, 100 profiled container hosts, 200 infrastructure hosts, 1.5 million container hours, 300,000 custom metrics, 500 million indexed spans, and 3,500 indexed logs, while ingesting approximately 10 TB (≈10,000 GB) of logs per month, the estimated monthly cost would be around $27,475.
Tech Fit
Datadog is ideal for cloud-native enterprises and DevOps teams needing broad integrations and instant dashboards. It fits organizations running multi-cloud or containerized workloads that demand strong visualization and flexible analytics.
5. SolarWinds Server & Application Monitor (SAM)
Known for
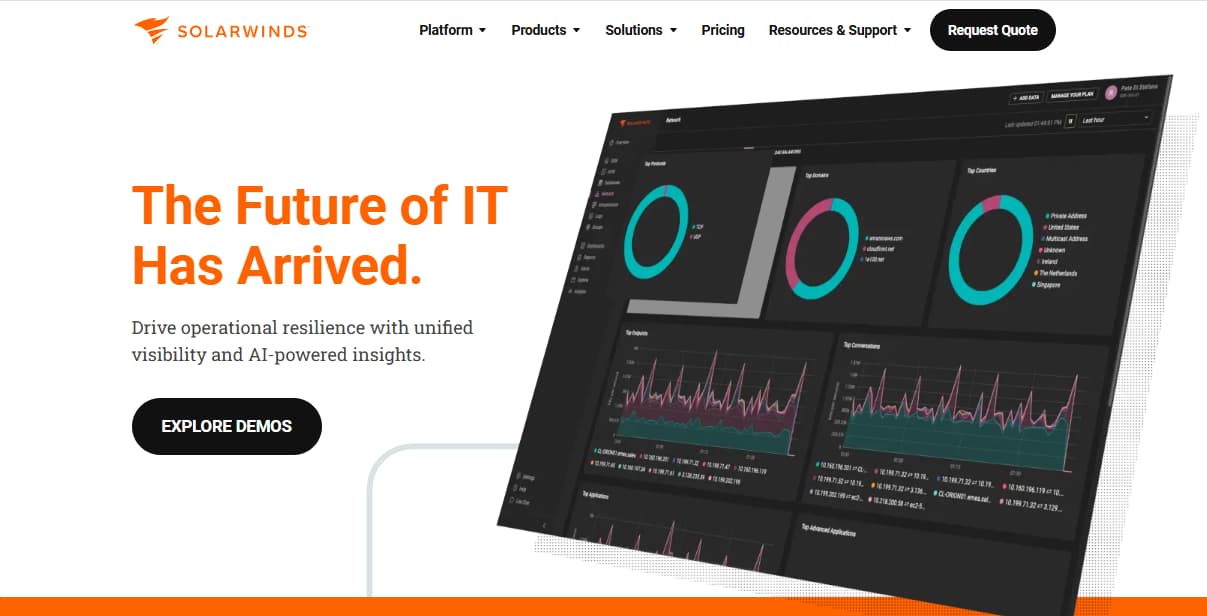
SolarWinds SAM is known for enterprise-grade server and application monitoring with deep coverage for Windows and hybrid infrastructures. It specializes in dependency mapping, performance baselining, and application-to-server correlation. It has a long-standing reputation in IT operations and is trusted for large-scale deployments.
Server Monitoring Features
- CPU, memory, disk, and network usage monitoring
- Server availability and response time tracking
- Hardware health checks (temperature, fan, power)
- Windows and Linux process and service monitoring
- Pre-built templates for 1,200+ server apps
- Virtualization and hypervisor monitoring
Key Features
- Dependency and topology mapping
- SNMP-based monitoring for devices and servers
- Customizable dashboards and reporting
- Capacity forecasting and performance baselining
- Alert escalation policies
Pros
- Broad server and app monitoring coverage
- Strong for Windows-heavy environments
- Extensive templates and out-of-the-box reports
- Mature platform with proven reliability
Cons
- Licensing is expensive at scale
- Overwhelming UI for new users
- Steeper learning curve for customization
Pricing
- Self-hosted Observability: $7.42/node/month
- SaaS Observability (Network & Infra): $12/host/month
SolarWinds SAM Server Monitoring Pricing At Scale
For a midsized company with about 100 hosts and 50 containers, SolarWinds Observability would cost around $1,260/month (100 hosts × $12 + 5 container licenses × $12). However, real deployments almost always require add-ons for databases, HA, storage packs, and premium support, which typically push the total closer to $5,000/month.
Tech Fit
SolarWinds SAM is best for large enterprises with Windows-heavy or hybrid data centers. It suits organizations that want detailed server-to-application visibility and depend on legacy enterprise systems.
6. New Relic
Known for
New Relic is known for being a developer-friendly observability platform with usage-based pricing and a generous free tier. It provides end-to-end visibility into servers, applications, and digital experiences, making it popular among engineering teams. Its pricing model removes per-host fees, but data ingest can add up fast.
Server Monitoring Features
- Host-level monitoring for CPU, memory, disk, and network
- Infrastructure dashboards for server fleets
- Health maps for host availability
- Cloud integration with AWS, Azure, GCP
- Log ingestion and correlation with server metrics
Key Features
- APM, logs, RUM, synthetics, error tracking
- Real-time dashboards and analytics
- Alerts and anomaly detection
- Kubernetes monitoring and integration
- Customizable visualizations
Pros
- Generous free tier (100 GB/month + unlimited hosts)
- No per-host charges, usage-based model
- Strong developer ecosystem and integrations
- Easy-to-use dashboards and alerts
Cons
- Per-user pricing model can get expensive for large engineering orgs.
- High costs at scale, especially for data ingestion and longer retention.
- Some advanced features have a steep learning curve.
Pricing
- Free: 100 GB/month, unlimited hosts
- Beyond free: $0.40/GB ingested
- Core Users: $49/month per user
- Full Platform Users (paid): $349/month for Pro tier
New Relic Server Monitoring Pricing At Scale
- Free Tier: 100GB/month ingested
- Pro plan: $0.40/GB ingested beyond the free 100GB limit
- Pro Plan: $349/user for full platform user
Tech Fit
New Relic fits developer teams and SaaS organizations that value simplicity, host-agnostic pricing, and deep application insights. It works well for teams that prioritize real-time analytics.
7. Paessler PRTG Network Monitor
Known for
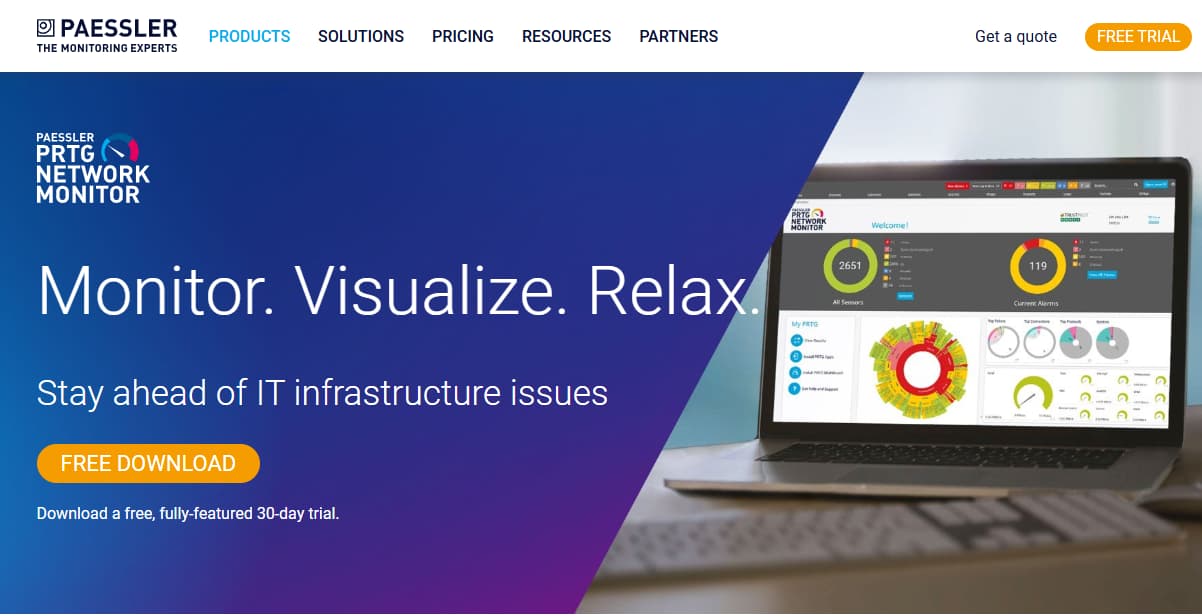
PRTG is known for its sensor-based monitoring model that provides flexibility and simplicity. It covers servers, networks, and applications, with customizable sensors for key metrics. Its user-friendly interface makes it popular with mid-sized IT teams.
Server Monitoring Features
- CPU, memory, disk, and network sensors
- Uptime and availability checks
- Hardware monitoring for server components
- Virtualization monitoring for VMware and Hyper-V
- Application-specific sensors for databases and web servers
Key Features
- Map-based visualization of server and network health
- Flexible threshold-based alerts
- Customizable dashboards and reports
- Mobile apps for monitoring on the go
- Auto-discovery of devices and servers
Pros
- Easy to deploy and configure
- User-friendly interface with flexible sensors
- Strong visualization and mapping tools
- Good balance of features and affordability
Cons
- Expensive, especially when data volumes grow
- Steeper learning curve for new users
Pricing
- PRTG 500: $179/month (500 aspects, ~50 devices)
- PRTG 1000: $325/month (1,000 aspects, ~100 devices)
- PRTG 2500: $675/month (2,500 aspects, ~250 devices)
- PRTG 5000: $1,183/month (5,000 aspects, ~500 devices)
- PRTG 10000: $1,492/month (10,000 aspects, ~1,000 devices)
PRTG Network Monitor Server Monitoring Pricing At Scale
For a midsized company with 125 servers, 50 containers, and network gear, the sensor requirements often balloon. Each server alone needs ~20 sensors (CPU, memory, disk, processes, network), about 500 sensors. Add monitoring for containers, switches, firewalls, and cloud instances, and the count quickly exceeds 2,500 sensors. This pushes most midsized setups into the PRTG 5000 plan at $1,492/month.
Tech Fit
PRTG fits mid-sized IT teams that want a simple, visual way to monitor servers and networks. It is especially useful where customizable sensors provide flexibility.
8. Zabbix
Known for
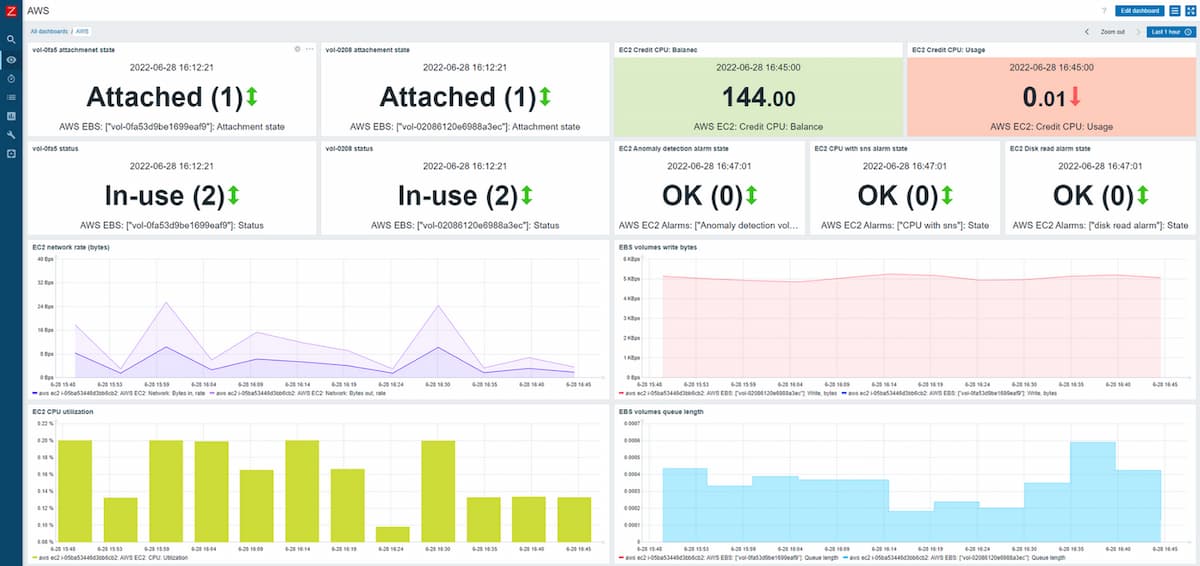
Zabbix is known as a free, open-source monitoring platform that offers enterprise-grade scalability. It monitors servers, networks, and applications without licensing costs, making it attractive for cost-sensitive organizations with in-house expertise.
Server Monitoring Features
- CPU, memory, disk, and network monitoring with agents
- Process and service monitoring
- Hardware health checks via IPMI
- Uptime and availability monitoring
- Event-driven alerting
Key Features
- Auto-discovery of devices and servers
- Customizable dashboards and visualizations
- Extensive templates and integrations
- API for automation and extensions
- Strong community support
Pros
- Free and open-source
- Highly customizable and flexible
- Scales well for large infrastructures
- Strong global community and support
Cons
- Requires manual configuration and setup
- Learning curve for complex deployments
Pricing
- Free open-source software
- Paid support and enterprise add-ons available
Zabbix Server Monitoring Pricing At Scale
Zabbix itself is free regardless of scale, but operational costs rise with server count due to hardware, storage, and engineering time. At 500–1,000 servers, expect staffing and infrastructure costs in the thousands/month despite zero licensing fees.
Tech Fit
Zabbix fits cost-conscious enterprises and public sector organizations with strong in-house IT teams. It is ideal for those who want control, flexibility, and scalability without vendor lock-in.
9. LogicMonitor
Known for
LogicMonitor is known for being a cloud-based monitoring platform focused on hybrid IT and enterprise scalability. It automates server and device discovery, delivering deep visibility across on-premises, cloud, and containerized environments. Its strength lies in ease of deployment and breadth of integrations.
Server Monitoring Features
- Agentless discovery of servers across hybrid environments
- Monitoring of CPU, memory, disk, and network performance
- Built-in templates for Windows and Linux servers
- Hardware health monitoring via SNMP and WMI
- Cloud server integration with AWS, Azure, GCP
Key Features
- Automated discovery and setup
- Custom dashboards and flexible reporting
- Alert escalation and role-based access control
- Integrations with ITSM tools like ServiceNow
- API for automation and extensibility
Pros
- Agentless architecture simplifies rollout
- Strong support for hybrid cloud environments
- Broad library of pre-configured templates
- Intuitive dashboards and alerting
Cons
- High licensing costs for enterprise-scale
- Users have reported a steeper learning curve
Pricing
- Infrastructure Monitoring: $22 per resource/month
LogicMonitor Server Monitoring Pricing At Scale
For a mid-sized SaaS company running 125 hosts and 45,000GB of observability data out(charged by cloud provider), the cost will be around ~$11,125/month.
Tech Fit
LogicMonitor is best for large enterprises running hybrid or multi-cloud infrastructures that need quick deployment and agentless monitoring.
Conclusion
Server monitoring has become a non-negotiable requirement for mid-sized and enterprise teams. From hosts and containers to cloud services, organizations need continuous visibility into CPU, memory, disk, network, and process-level health to prevent outages and performance bottlenecks. While traditional tools like SolarWinds, Datadog, Dynatrace, New Relic, LogicMonitor, PRTG, Zabbix, and ManageEngine OpManager all offer capable solutions, their pricing models often spiral with host counts, ingestion volumes, or feature add-ons.
Across the board, our pricing analysis shows midsized companies can easily spend $3,000–$7,000/month on server monitoring once logs, containers, and support contracts are factored in. By contrast, CubeAPM delivers predictable flat-rate pricing of $0.15/GB ingestion. Beyond the cost advantage, CubeAPM unifies metrics, logs, traces, and events into one OpenTelemetry-native platform, helping teams detect, correlate, and resolve incidents much faster.
For organizations looking to balance depth, scale, and affordability, CubeAPM stands out as the most cost-efficient and future-ready server monitoring tool in 2025.
Disclaimer: The information in this article reflects the latest details available at the time of publication and may change as technologies and products evolve.
FAQs
1. What are server monitoring tools used for?
Server monitoring tools track the performance, availability, and health of servers in real time. They measure CPU, memory, disk, network, and process activity, while also sending alerts if thresholds are breached. This helps IT teams prevent downtime and optimize infrastructure performance.
2. Which server monitoring tools are considered the best in 2025?
The most popular tools today include CubeAPM, Datadog, and ManageEngine OpManager. The right choice depends on factors like deployment size, budget, compliance needs, and whether you need cloud-native or hybrid support.
3. How much does server monitoring cost?
Pricing varies widely. Host-based platforms like Datadog or Dynatrace can range from $3,000–$7,000/month for midsized deployments, while usage-based options like New Relic scale with data ingestion. CubeAPM offers predictable pricing at $0.15/GB ingestion, often making it 60–70% cheaper for midsized companies.
4. What features should I look for in a server monitoring tool?
Key features include real-time CPU, memory, disk, and network monitoring; process-level insights; container and Kubernetes visibility; log and trace correlation; alerting and automation; and flexible deployment (SaaS, hybrid, or on-premises). Integration with cloud platforms and compliance support are also important.
5. What is the best server monitoring tool for midsized companies?
For midsized teams that need affordability, scalability, and full-stack observability, CubeAPM is a strong choice. It delivers deep server metrics, log and trace correlation, and hybrid cloud support at a predictable cost, often under $1,600/month for 50 servers and 10 TB ingestion.


