Downtime is a financial disaster, and no longer just an inconvenience. As of mid‑2025, 98% of organizations report that even a single hour of downtime costs over $100,000. Uptime monitoring tools have therefore become important for modern reliability engineering, giving teams real-time visibility into outages, slow responses, and performance degradations.
However, choosing the right uptime monitoring tool remains daunting. Users grapple with unpredictable pricing models, feature bloat, alert fatigue, and complicated setups, especially when tools fail to deliver fast accuracy, clear insights, and reliable global coverage.
CubeAPM is one of the best uptime monitoring tool providers, engineered for reliability and transparency. It delivers real-time synthetic checks, multi-region monitoring, customizable alerting, seamless OpenTelemetry integration, and predictable pricing. In this article, we’ll dive into the top 8 uptime monitoring tools based on their features, pricing, and ideal use cases.
Top 8 Uptime Monitoring Tools
- CubeAPM
- Datadog
- Dynatrace
- New Relic
- Site24x7
- Better Stack
- Pingdom
- Checkly
What Is a Uptime Monitoring Tool?
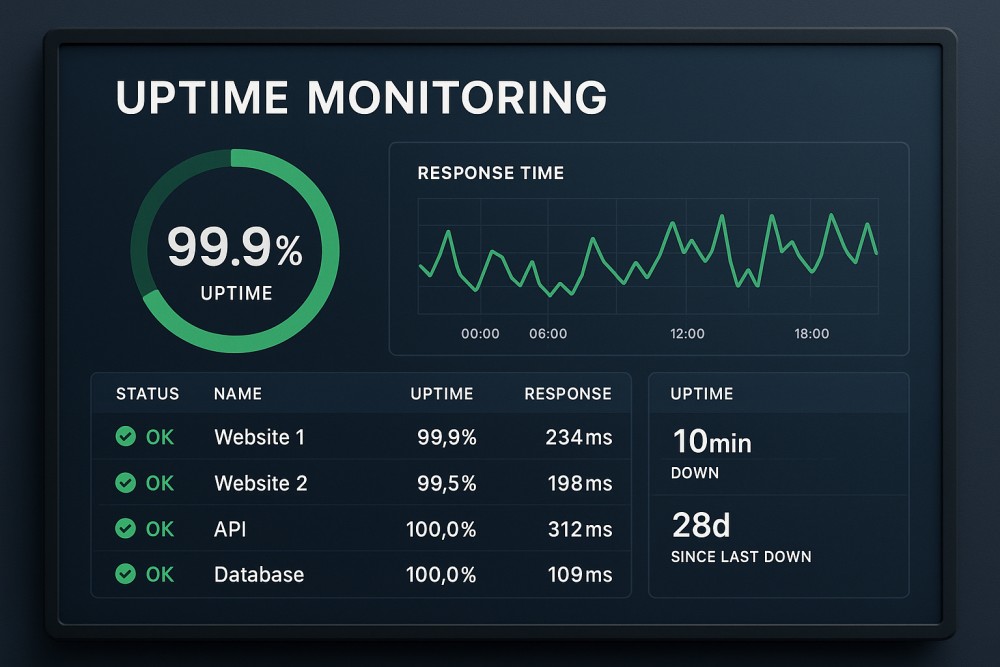
An uptime monitoring tool is software that automatically checks whether websites, applications, or APIs are online and performing properly from different global locations. By sending periodic requests, it tracks availability, response time, and errors, alerting teams immediately when downtime or performance issues occur.
The main benefit of uptime monitoring is that it allows businesses to detect problems early, reduce downtime impact, maintain customer trust, and ensure a smooth digital experience. It also helps teams stay proactive instead of waiting for users to report issues, making incident response faster and more efficient.
CubeAPM Uptime Monitoring: Beyond Downtime Detection to Root Cause Insights
Take an example of CubeAPM’s uptime monitoring. Instead of only confirming if a login page responds, CubeAPM links uptime failures to backend telemetry. If a payment API starts timing out, CubeAPM can show whether it’s due to a spike in CPU usage on the payment service, a slow database query, or a failed connection to a third-party gateway. This way, teams know not just that the service is down, but why it’s failing, and can fix the root cause faster.
Role of Uptime Monitoring in APM and Observability
Uptime monitoring acts as the frontline signal in an Application Performance Monitoring (APM) and observability strategy. It answers the first question—is the service available?—and triggers alerts when downtime occurs.
In modern observability platforms, these uptime checks are then correlated with logs, traces, metrics, and user sessions to uncover why the outage happened. This integration bridges simple availability monitoring with full-stack observability, ensuring faster detection, diagnosis, and resolution of incidents.
Why Teams Choose Different Uptime Monitoring Tools?
Despite having the same core purpose, uptime monitoring tools differ in pricing, flexibility, and integration depth. Teams often switch providers due to the following reasons:
Pricing Complexity and Cost Overruns
One of the biggest reasons teams reconsider their uptime monitoring provider is unpredictable pricing. Many vendors charge separately for checks, users, data retention, and synthetic transactions. As monitoring scales, these add-ons can multiply costs and strain budgets. This makes transparent or usage-based pricing models more attractive to teams seeking predictability.
Depth of Monitoring Checks
Not all tools offer the same granularity. Basic uptime monitors confirm if a service is “up” or “down,” but advanced platforms provide transactional synthetics that simulate real-world user flows, like sign-ups or payment transactions, in real browsers. These deeper checks reveal performance bottlenecks that simple pings cannot detect.
Global Coverage and Private Monitoring
Modern applications serve users worldwide. If a tool lacks sufficient monitoring nodes across regions, teams may miss region-specific downtime. Additionally, enterprises often need private probes behind firewalls to test internal services. Choosing a tool with both wide public coverage and secure private options ensures end-to-end reliability.
Accuracy and False Positive Reduction
Alert fatigue is a common pain point. Poorly designed systems may raise downtime alerts due to temporary network issues or single-node failures. Mature tools confirm incidents across multiple locations before escalating, reducing false positives, and ensuring teams only respond to genuine outages.
Integration with Engineering Workflows
Today’s monitoring isn’t just about detection—it must integrate with how teams work. “Monitoring as Code” allows developers to define uptime checks in Git, version them, and run them through CI/CD pipelines. Similarly, seamless integration with collaboration platforms (Slack, Teams, PagerDuty) ensures alerts are actionable and incident response is fast.
SLA Reporting and Transparency
For businesses bound by Service Level Agreements, monitoring data doubles as a contractual proof point. Tools that provide built-in reporting, exportable metrics, and public status pages help organizations demonstrate reliability to customers and communicate transparently during incidents.
Compliance and Data Residency
In regulated industries, where data residency and privacy laws like GDPR or HIPAA apply, teams need assurance that monitoring data is stored within required boundaries. Tools offering regional data control or on-premise options are preferred where compliance is a top concern.
Beyond Availability Checks
Modern uptime monitoring extends beyond “is the service up?” to performance insights. Features like page speed waterfalls, DNS checks, SSL expiration monitoring, and API health tracking provide a fuller picture of system health. This broader scope helps teams move from reactive firefighting to proactive performance management.
Top 8 Uptime Monitoring Tools
1. CubeAPM
Overview
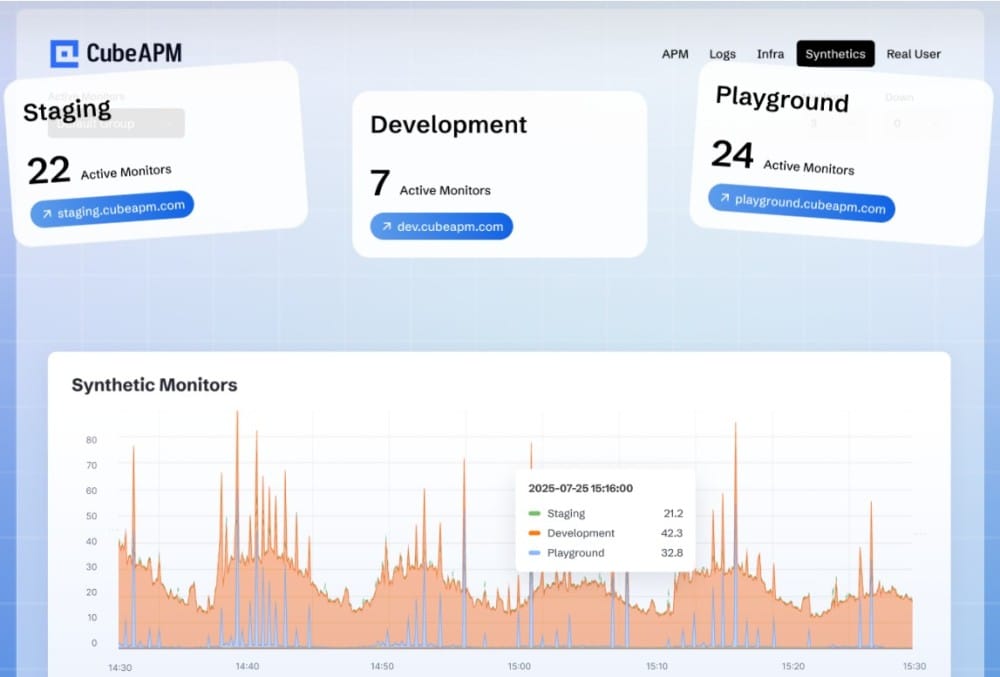
CubeAPM is an OpenTelemetry-native observability platform that integrates uptime monitoring with logs, metrics, traces, and RUM in one system. It is known for transparent, ingestion-based pricing and flexible deployment—SaaS, self-hosted, or on-premise—making it a strong choice for both startups and enterprises with compliance needs. With 800+ integrations, it fits seamlessly into modern DevOps stacks and is positioned as a cost-predictable alternative to heavier incumbents.
Key Advantage
CubeAPM’s biggest strength in uptime monitoring is that it doesn’t treat “is it up?” as an isolated feature. Instead, it connects synthetic checks directly with backend telemetry. This means teams not only know that a service is down but can immediately see why it’s failing, reducing investigation and recovery times.
Key Features
- HTTP(S) and API uptime checks: validates response codes to confirm incidents and avoid false positives.
- Multi-region checks: monitors from over 50 local and global endpoints to ensure performance is consistent worldwide, detect downtime or latency, and compare performance in real-time.
- Heartbeat monitoring: CubeAPM does heartbeat monitoring for your background processes and cron jobs, so you can run scheduled tasks without missing out on anything.
- SSL/TLS and domain expiry tracking: to prevent avoidable downtime from expired certificates or domains.
- Traceroute/MTR diagnostics: to surface network path issues during outages.
- Direct correlation with traces and logs: to enable fast root-cause analysis from a single alert.
- Downtime alerts: send instant notifications if your service is down.
- DNS resolution checks: checks if the domain is resolved correctly or not.
- Response time: tests response speed to add additional context to application health.
Pros
- Unified observability with uptime monitoring built into the same workflow
- Transparent, linear pricing without per-check or per-user fees
- Flexible deployment options (SaaS, self-hosted, on-prem) for compliance needs
- Wide ecosystem support with 800+ integrations
Cons
- No built-in cloud security management features, as it is observability-focused rather than a security platform
- May not be ideal for teams that prefer a SaaS-only solution with zero infrastructure responsibility
CubeAPM Pricing with Scale
CubeAPM uses a transparent pricing model of $0.15 per GB ingested. For a mid-sized business generating 45 TB (~45,000 GB) of data per month, the monthly cost would be ~$7,200/month.
*All pricing comparisons are calculated using standardized Small/Medium/Large team profiles defined in our internal benchmarking sheet, based on fixed log, metrics, trace, and retention assumptions. Actual pricing may vary by usage, region, and plan structure. Please confirm current pricing with each vendor.
Tech Fit
CubeAPM is well-suited for cloud-native and distributed systems where uptime is mission-critical. It integrates easily with Kubernetes, microservices, and serverless environments, while also supporting traditional workloads. With strong OTEL and Prometheus compatibility, it works across Java, Node.js, Python, Go, .NET, and hybrid stacks deployed on AWS, GCP, Azure, or private clouds.
How CubeAPM Uptime monitoring differs from Datadog & New Relic
Datadog / New Relic: Both these tools offer synthetic checks, but often tie the checks to higher-cost tiers, with hidden per-GB or per-check pricing.
CubeAPM: Positions uptime monitoring as part of its transparent, OpenTelemetry-first platform. It’s integrated directly with metrics/traces/logs, with no opaque per-check billing.
2. Datadog

Overview
Datadog is a full-stack observability platform with a mature synthetic suite for uptime monitoring. It offers API tests (HTTP, gRPC, SSL, DNS, WebSocket, TCP, UDP, ICMP) and real-browser tests to validate user journeys. Tests can run from global managed locations or private locations behind firewalls, and failures can be correlated with backend metrics, traces, logs, and SLOs for faster triage. It is widely adopted in enterprises that want uptime monitoring embedded in a larger observability workflow.
Key Advantage
Datadog’s biggest strength in uptime monitoring is deep correlation. Failed checks can be explored directly in context with APM, RUM, logs, and metrics, enabling engineers to move from “is it down?” to “why is it down?” without switching tools.
Key Features
- API uptime monitoring: Covers protocols from HTTP to ICMP, supports multi-step flows, and offers timing breakdowns.
- Real-browser tests: Codeless recording with step-by-step screenshots and replay context for full user journeys.
- CI/CD integration: Allows synthetic checks to run before and after deployments in pipelines.
- Unified troubleshooting: Correlates uptime with APM, RUM, logs, and SLO dashboards for faster RCA.
Pros
- Wide coverage of uptime checks across APIs, browsers, and networks
- Ability to test external and internal apps using private locations
- Strong integration with CI/CD pipelines for pre-deployment checks
- Tight correlation with APM, RUM, logs, and SLO dashboards
- Well-suited for complex environments needing both uptime and end-user validation
Cons
- Pricing can be costly for smaller teams
- No self-hosting
Datadog Pricing at Scale
Datadog charges differently for different capabilities. APM starts at $31/month; infra starts at $15/month; logs start at $0.10/GB, and so on.
For a mid-sized business ingesting around 45 TB (~45,000 GB) of data per month, the cost would come around $27,475/month.
Tech Fit
Datadog is best for enterprises and large-scale teams that want uptime monitoring tightly integrated with a broad observability platform. It’s especially strong for web applications, APIs, and CI/CD-heavy environments where failures need to be validated at both the API and browser levels and investigated within the same system.
3. Dynatrace
Overview
Dynatrace is an enterprise observability platform that embeds uptime monitoring into its Digital Experience stack. It offers API and browser synthetics, executes tests from global managed locations or private locations behind firewalls, and feeds failures into Davis® AI for anomaly detection and guided triage alongside RUM, traces, logs, and metrics. This combination makes Dynatrace a strong fit for organizations that want proactive uptime checks tightly connected to end-to-end diagnostics.
Key Advantage
Dynatrace’s synthetics are first-class citizens of its Digital Experience platform: when an uptime check fails, engineers can jump into waterfall details, RUM/session context, and Davis® AI problem cards to understand scope and probable root cause—reducing back-and-forth across tools.
Key Features
- Synthetic types: Single-URL browser monitors, scripted clickpaths, and HTTP monitors for APIs and endpoints.
- Private locations: Run uptime checks inside restricted networks via Synthetic-enabled ActiveGate.
- Waterfalls & diagnostics: Visualize page resources, timings, and failing steps to speed up RCA.
- DX integration: Correlate synthetic outages with RUM, session replay, and backend telemetry.
Pros
- Deep diagnostic context (waterfalls, RUM, Davis® AI) tied to each failed check
- Public and private execution locations for external and internal uptime monitoring
- Strong enterprise workflow fit for SRE/DevOps teams with complex estates
Cons
- Usage-based, per-request pricing can escalate at high frequencies
- Platform depth introduces a learning curve
Dynatrace Pricing at Scale
The cost for Synthetic Monitoring: $0.001/synthetic request.
Illustrative mid-size setup for uptime coverage:
- 50 HTTP monitors, every 1 minute, from 3 locations → ~6.48 M requests/month ≈ $6,480/month
- 10 browser journeys, every 5 minutes, from 3 locations on 2 devices → ~518k requests/month ≈ $518/month
Total ≈ $6,998/month for synthetics alone
Tech Fit
Best for enterprises that want uptime monitoring woven into a broader experience analytics stack, need both public and private checks, and value AI-assisted triage. Works well across polyglot apps and large Kubernetes/hybrid environments where correlating synthetic failures with RUM and backend data is essential.
4. New Relic
Overview
New Relic brings uptime monitoring into its broader Digital Experience stack with API monitors, scripted browser journeys, and web performance insights. Teams can run checks from global public locations or from private locations inside firewalled networks, then pivot into RUM, traces, logs, and metrics for faster triage when an availability check fails. This makes it a familiar choice for organizations that want uptime validation embedded in a larger observability workflow.
Key Advantage
Tight correlation between synthetic failures and user experience. When a check fails, engineers can pull up waterfalls, page-level timings, or session context and follow the breadcrumb trail into backend telemetry without leaving the platform.
Key Features
- API and browser synthetics: Monitor endpoints and full user flows with scripted steps and timing breakdowns.
- Public and private locations: Run checks from New Relic’s global network or deploy private locations behind your firewall.
- Availability reporting: Build uptime dashboards, SLO views, and status-style monitors to track SLAs.
- Web performance monitoring: Inspect waterfalls, Core Web Vitals, and page assets to diagnose slow paths.
Pros
- Strong correlation from synthetic checks into RUM, APM, logs, and metrics
- Choice of global managed locations and private, behind-the-firewall execution
- Mature workflow for building dashboards, SLOs, and availability reports
- Broad ecosystem and “quickstart” integrations for faster setup
Cons
- Per-GB data ingest and user-seat licensing add up as teams and telemetry grow
- SaaS-based; no self-hosting
New Relic Pricing at Scale
New Relic’s billing is based on data ingested, user licenses, and optional add-ons. The free tier offers 100 GB of ingest per month, then it costs $0.40 per GB after that. For a business ingesting 45 TB of logs per month, the cost would come around $25,990/month.
Tech Fit
Best for teams that want uptime monitoring woven into a broader New Relic workflow—validating API and browser journeys, correlating failures with real-user sessions and backend services, and reporting against SLAs in one place. It suits polyglot web stacks and hybrid environments that benefit from both public and private test locations.
5. ManageEngine Site24x7
Overview
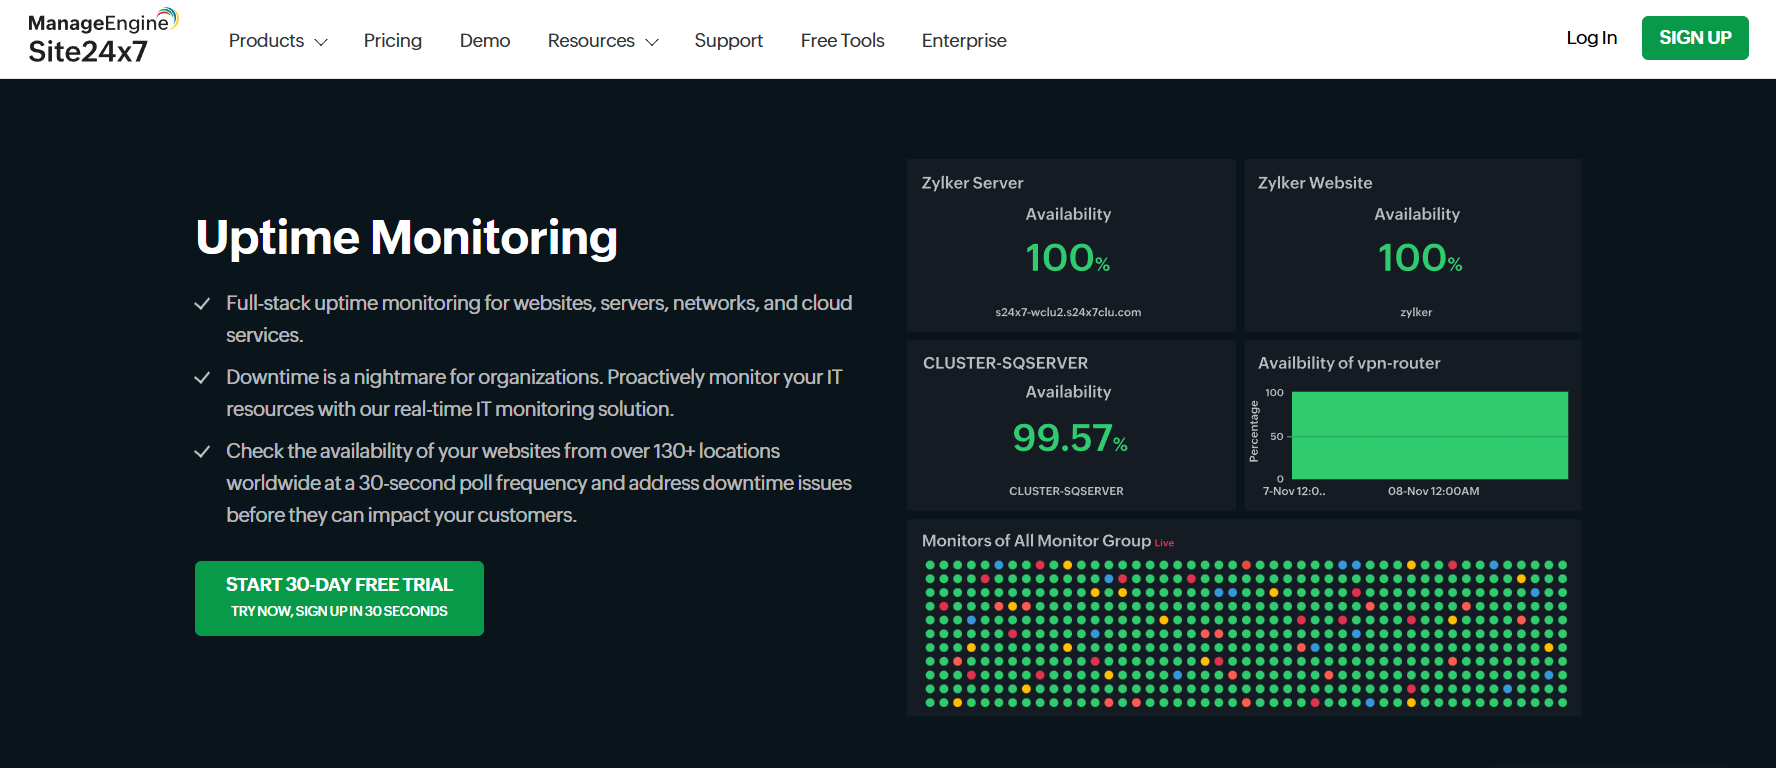
ManageEngine Site24x7 is a broad monitoring platform that includes a well-rounded uptime suite for websites, APIs, and internet services. You can run checks from 130+ global locations or from On-Premise Poller instances inside private networks, then review root-cause details like DNS, network hops, and response breakdowns. Status pages, SLA views, and RUM tie-ins make it a practical choice for teams that want availability tracking plus the basics of web performance in one place.
Key Advantage
Flexible coverage for both public and private endpoints at high frequency, with built-in false-alert protection and quick diagnostics (screenshots, traceroute, resource waterfalls) so engineers can confirm incidents and act fast.
Key Features
- Global uptime checks: HTTP(S), REST/SOAP, DNS, SMTP/POP/IMAP, ports/TCP, and ping from 130+ locations with 30–60s cadence.
- Private locations: Use On-Premise Poller to run synthetic checks behind firewalls for intranet apps and internal APIs.
- Transaction & page diagnostics: Scripted web journeys and page-speed waterfalls to pinpoint slow resources.
- SLA & status pages: Availability dashboards, four-decimal uptime reporting, and hosted status pages for stakeholder updates.
- Cloud/service coverage: Ready-made monitors for AWS/Azure/GCP endpoints and third-party services to catch upstream outages.
Pros
- Strong breadth of internet-service monitors (HTTP, DNS, mail, ports)
- Public + private monitoring footprint with On-Premise Poller
- Built-in false-positive reduction (multi-location rechecks) and RCA artifacts
- Easy status pages and SLA reporting for transparent comms
- Competitive entry pricing with add-ons to scale monitors
Cons
- Can be costly for smaller teams with tight budgets
- Learning curve
- Alert issues
ManageEngine Site24x7 Pricing at Scale
Site24x7’s Professional plan ($42/month, paid annually) may suit mid-sized companies but may quickly outgrow the base bundle once they need dozens of APIs, private endpoints, or extra ingestion. Also, the Enterprise tier costs $625/month (annually), which could be high for many teams.
Tech Fit
A good fit for web-heavy teams and MSPs that need reliable global checks, straightforward RCA artifacts, and simple status/SLA reporting. Works across classic LAMP/Windows stacks and modern cloud deployments; On-Premise Poller helps enterprises monitor internal URLs and services in VPN/zero-trust environments without opening inbound access.
6. Better Stack

Overview
Better Stack focuses on fast, reliable external uptime checks with clean incident workflows and hosted status pages. You can monitor websites, APIs, ports, and more from multiple global locations, add heartbeat monitors for cron jobs and workers, and capture rich artifacts (screenshots, traceroute/MTR) to speed up diagnosis. Private or password-protected status pages, on-call alerts (including phone/SMS), and simple monitor packs make it appealing for teams that want polished uptime plus incident comms without heavy setup.
Key Advantage
Low-friction uptime with strong incident communication. Better Stack provides fast, multi-location checks, built-in status pages, and failure context for each second (screenshots, timelines, traceroute/MTR). It helps engineers confirm issues and update stakeholders quickly.
Key Features
- Multi-location checks & 30-sec cadence: Run HTTP(S)/API/port/ping checks from several regions with fast intervals and automatic rechecks to cut false positives.
- Status pages: On your subdomain, you can use host-branded and subscription-enabled pages to be able to communicate incidents fast and in real time.
- Heartbeats (cron/worker monitoring): Expect regular pings from scheduled jobs; missed beats trigger incidents and alerts.
- Rich incident artifacts: Capture screenshots, step timelines, and traceroute/MTR to pinpoint network and page-level failures quickly.
- Infrastructure as code hooks: Terraform provider, REST API, and webhooks to manage monitors and automate incident workflows.
Pros
- Quick setup and a very approachable UI
- Strong incident communication with hosted status pages
- Helpful diagnostics (screenshots, traceroute/MTR) for faster RCA
- Private monitoring options and heartbeat coverage for jobs
- Monitor packs keep baseline costs predictable at modest scale
Cons
- No self-hosting; only SaaS
- High cost spike from free to paid
Better Stack Pricing at Scale
- Free tier: Includes 10 monitors, 1 static page, 3 GB logs (3-day), 2B metrics points (30-day), 1 or more responders using Slack/phone/SMS.
- Paid plans: Start at $29/user/month, including one responder license and unlimited users, with bundles for telemetry and incident capabilities.
Teams ingesting 42 TB of data monthly can end up paying $20,550/month.
Tech Fit
A great fit for web-heavy teams, SaaS startups, MSPs, and product groups that prioritize fast, clear uptime checks with strong stakeholder comms. Works well across classic LAMP/Windows stacks and modern cloud apps; heartbeat monitoring covers cron/serverless jobs, and Terraform/API support makes it easy to manage monitors in CI/CD and GitOps workflows.
7. Pingdom
Overview
Pingdom is a long-standing website and API uptime monitoring service from SolarWinds. It runs checks from a large, globally distributed network (100+ locations), supports both simple availability pings and real-browser transaction flows, and includes polished reporting plus hosted status pages. Teams use Pingdom to validate external availability, capture failure evidence, and share clear uptime information with customers.
Key Advantage
Battle-tested web uptime with strong web-centric diagnostics. When a check fails, Pingdom pairs multi-location rechecks with page/resource details and traceroute so engineers can quickly confirm an incident and see where the failure originates.
Key Features
- Global uptime checks: Monitor websites, APIs, ports, and servers from 100+ probe locations with minute-level scheduling and rechecks to reduce noise.
- Transaction monitoring: Script real-browser journeys (login, search, cart, checkout) and capture step-level failures for faster fixes.
- Page diagnostics: Waterfalls, resource timing, and response breakdowns to pinpoint slow assets and third-party impacts.
- Status pages: Branded public pages with historical uptime so stakeholders can track incidents and recovery.
Pros
- Mature, web-focused uptime and transaction monitoring
- Wide global coverage and reliable recheck logic
- Clear diagnostics (waterfalls, traceroute) for RCA
- Easy, polished status pages suitable for customer-facing comms
Cons
- Plan varies by the number of checks and advanced monitors, so large estates can get expensive
- Not very user-friendly, as the functionality is code and number-heavy
Pingdom Pricing at Scale
Pingdom’s synthetic pricing is tiered by number of uptime checks and advanced transactions, along with SMS alerts:
- Entry tier: $10/month grants 10 uptime checks + 1 advanced check + 50 SMS alerts.
- Tiers scale up to 4,000 uptime checks + 320 advanced checks for $2,860/month, and even higher—10,000 uptime + 800 advanced for $6,530/month.
Tech Fit
A strong match for web-heavy teams that want proven external uptime, real-browser transactions, and customer-friendly status pages. Works well for marketing sites, e-commerce, and SaaS apps where front-end performance and availability need constant global verification.
8. Checkly
Overview
Checkly is a developer-first uptime and synthetic monitoring platform that treats monitors as code. It supports simple URL/TCP uptime checks, advanced API checks, and Playwright-based browser journeys from globally distributed locations or private locations behind your firewall. Teams adopt it for fast feedback in CI/CD, clean incident workflows, and the ability to manage monitors via CLI, Terraform, and APIs.
Key Advantage
Monitoring-as-code that scales with your engineering workflow. You can define uptime monitors and synthetic tests in version-controlled code, run them pre/post-deploy in pipelines, and get clear artifacts (logs, screenshots) to speed up root-cause analysis.
Key Features
- Uptime monitors (URL/TCP/Heartbeats): Simple, reliable availability checks for endpoints, ports, and cron jobs, with multi-location execution and retries.
- Browser checks (Playwright): Real-browser flows for login, cart, and other journeys, with screenshots and timing data for failures.
- API checks: Flexible HTTP requests with headers/payloads and assertions, schedulable down to high frequency for critical APIs.
- Private locations: Run checks inside restricted networks to validate internal apps and services without exposing them to the internet.
- Monitoring as code: Manage monitors through the Checkly CLI, Terraform, and Pulumi, and wire alerts to Slack, email, SMS, phone, or webhooks.
Pros
- Strong developer ergonomics and “monitors as code” workflow
- Real-browser synthetics with rich artifacts for troubleshooting
- Mix of uptime, API, and browser checks in one platform
- Private locations for internal endpoints
- Clear pricing controls via included monitor/run quotas and add-ons
Cons
- Costs scale with high-frequency, multi-location browser/API runs
- Customization difficulty
Checkly Pricing at Scale
Checkly’s pricing combines monitor counts (for uptime monitors) with per-run allowances for API and browser checks. On the Team plan costing $64/month, you get 75 uptime monitors, 12k browser runs, and 100k API runs.
With 75 uptime monitors at 1-minute frequency from 3 locations, the setup still fits entirely within Checkly’s Team plan, which includes up to 75 uptime monitors at no extra cost. The browser workload remains the same: 10 journeys every 5 minutes from 3 locations, generating about 259k browser runs per month. After the 12k runs included in the Team plan, roughly 247k additional runs are needed, costing about $990/month when prepaid. Adding the Team base plan fee (~$64/month billed annually), the total monthly cost comes to roughly $1,050–$1,055, with browser runs being the primary cost driver.
Tech Fit
Ideal for engineering teams that live in CI/CD and want uptime plus synthetics they can version, review, and deploy like code. Works well for web and API-centric products, microservices, and internal apps that require private-location checks, with easy integrations into Slack/incident tooling and infrastructure-as-code workflows.
Conclusion
Choosing the right uptime monitoring tool isn’t simple. Teams struggle with hidden pricing models, noisy false positives, limited private monitoring, and platforms that don’t scale well with global coverage or compliance needs. These gaps often leave engineering teams juggling multiple tools just to keep services online and stakeholders informed.
CubeAPM solves these challenges by combining powerful uptime checks with full observability in one platform. With predictable $0.15/GB pricing, 800+ integrations, and flexible deployment options, CubeAPM helps teams detect outages instantly, trace failures to root causes, and avoid runaway costs that come with run-based billing models.
Schedule a free demo to explore CubeAPM today.
Disclaimer: The information in this article reflects the latest details available at the time of publication and may change as technologies and products evolve.
FAQs
1. What is an uptime monitoring tool?
An uptime monitoring tool continuously checks whether your website, API, or service is accessible and performing correctly from multiple global locations. It alerts you when downtime or performance issues occur so teams can fix problems before customers notice.
2. Why are uptime monitoring tools important?
Downtime directly impacts revenue, user trust, and brand reputation. Uptime monitoring tools help businesses catch outages early, reduce financial loss, maintain SLAs, and provide transparency through status pages and reports.
3. Which are the best uptime monitoring tools?
Some of the best tools are CubeAPM, Datadog, Site24x7, Dynatrace, Better Stack, Pingdom, New Relic, and Checkly. They differ in terms of features, pricing, integrations, deployment flexibility, and more. Choose one that fits your business requirements for uptime monitoring.
4. How much do uptime monitoring tools cost?
Pricing models vary. Some charge per monitor or test run (like Pingdom, Datadog, or Checkly), while others, like CubeAPM, use predictable ingestion-based pricing (e.g., $0.15/GB). At scale, CubeAPM often proves affordable by including uptime monitoring within its overall observability cost.
5. What should I look for when choosing an uptime monitoring tool?
Focus on pricing transparency, breadth of checks (HTTP, APIs, browser transactions), global coverage, false-positive reduction, integrations with alerting tools, SLA/status page support, and compliance options like private probes or self-hosting. These factors ensure reliability, scalability, and trust in your uptime strategy.


