Netdata excels at real-time, per-second infrastructure monitoring with strong Linux support and fast troubleshooting, but users report limited Windows monitoring and integrations, and relatively high resource usage that often requires powerful systems for smooth operation.
CubeAPM is the best alternative to Netdata, offering full-stack observability across metrics, logs, traces, RUM, and synthetics with OpenTelemetry-native ingestion, predictable usage-based pricing, and built-in support for long-term analysis without the operational overhead of managing resource-intensive agents.
In This Article, we’ll highlight the 7 best alternatives to Netdata, comparing each tool on key use cases, full-stack observability features, OpenTelemetry support, pricing, and end-user reviews—so you can choose the right platform for your modern APM and infrastructure monitoring needs.
Top 7 Netdata Alternatives
- CubeAPM
- New Relic
- Datadog
- Dynatrace
- Coralogix
- Sentry
- IBM Instana
Why Look for Netdata Alternatives?
1. Scalability Concerns in Larger Microservices Environments
Netdata works well for small or static environments, but users have raised concerns about its scalability when dealing with dynamic, distributed systems—especially those with hundreds of containers, VMs, or ephemeral workloads. Its agent-heavy architecture and dashboard responsiveness may not keep up in large-scale microservices deployments, where auto-scaling and service churn are frequent.
“We tried this on a non scalable environment of few microservices. So the scalability factor need to be checked when you have 100s of containers or vms in the production environment for running a distributed system of microservices.” — G2 Review
2. Overwhelming UI
Netdata’s richness in metrics is both a strength and a drawback. New users often find the UI cluttered and overwhelming, and dashboards can be fiddly to build without templates or guidance. Custom alert configuration is also reported as unintuitive and error-prone.
“The UI can be overwhelming the first time you’re in it. Tuning notifications and thresholds in the free version was awkward.” — G2 Review
3. Documentation & Integration Friction
Although Netdata offers extensive documentation, many users feel it’s insufficient for less technical audiences. Integrating with less common systems or customizing behavior often requires digging through low-level docs.
“If you are running it at scale on your own infrastructure (hosting your own parent node) then documentation is lacking..” —G2 Review
“While Netdata is a robust monitoring tool, its integration documentation could be more user-friendly to accommodate users with varying levels of technical expertise” — G2 Review
Criteria for Suggesting Netdata Alternatives
To help teams find better-fit observability platforms, we used the following criteria to evaluate Netdata alternatives:
1. Native MELT Support
The alternative should offer full coverage across Metrics, Events, Logs, and Traces—ideally in one platform. Native MELT support ensures unified troubleshooting without needing separate tools for APM, logs, and infrastructure.
2. OpenTelemetry-First Design
With OTEL becoming the industry standard, we prioritize tools that are built natively on OpenTelemetry, not just compatible. Native OTEL platforms enable flexibility, vendor-neutral instrumentation, and long-term ecosystem alignment.
3. Smart Sampling & High-Cardinality Handling
Alternatives should support tail-based or context-aware sampling to retain the most relevant traces while controlling cost and noise. Tools that handle high-cardinality datasets without performance degradation score higher.
4. Flexible Deployment Models
We looked for platforms offering both SaaS and self-hosted options, including customer cloud and air-gapped deployments. This is critical for compliance-heavy teams and those avoiding vendor lock-in.
5. Built-in APM, RUM & Synthetic Monitoring
Netdata’s limitations in APM and frontend visibility require alternatives to offer deep backend tracing, real user monitoring, and multi-step synthetic checks—out-of-the-box, not via third-party integrations.
6. Transparent Pricing & Cost Efficiency
Tools with flat or usage-based pricing, no hidden retention fees, and efficient billing models (e.g., per GB or per host) are favored. Platforms like Datadog have drawn criticism for complex and unpredictable pricing
Netdata Overview
Known For
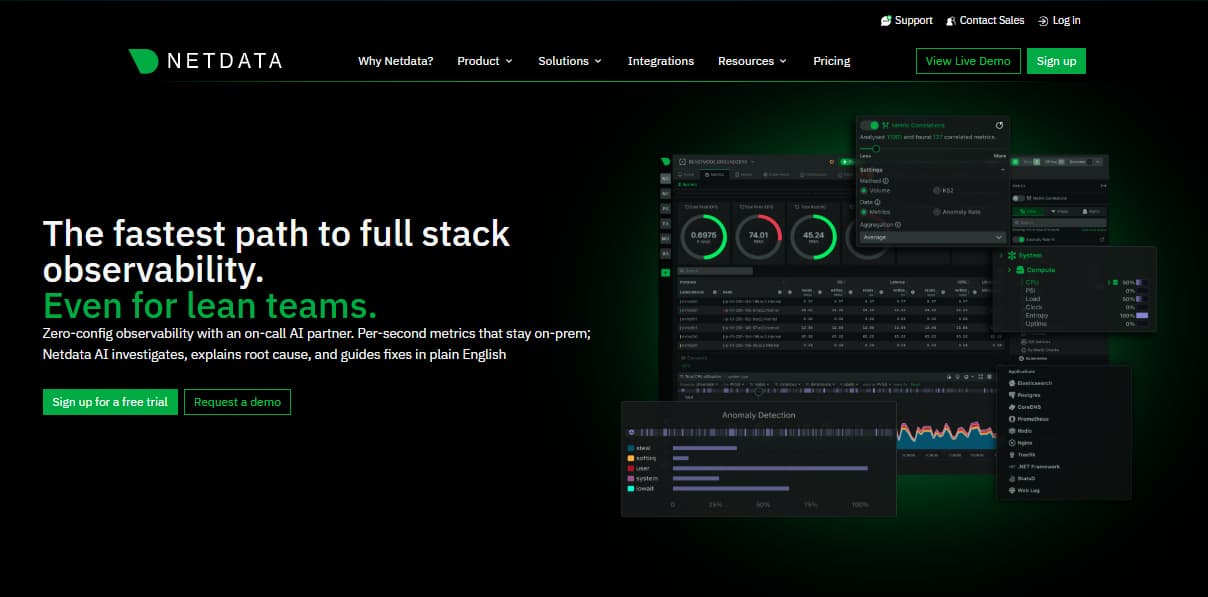
Real-time infrastructure monitoring with lightweight agents and edge-based data collection. Netdata is best known for its ability to deliver per-second system metrics and anomaly detection with minimal setup, making it ideal for visibility into CPU, disk, memory, and network usage on a per-host basis.
Key Features
- Per-Second Metrics Collection: Unsampled, high-resolution data with visual dashboards.
- Autonomous Anomaly Detection: Built-in machine learning detects outliers and flags alerts per metric.
- Edge-First Architecture: All telemetry is processed and stored locally, reducing cloud dependency.
- Visual Dashboards: Prebuilt charts and customizable views for metrics, containers, and applications.
- Cloud Control Plane (Optional): For multi-node visibility, Netdata Cloud provides unified dashboards and alert management.
Standout Features
- In-Memory Time-Series Engine: Stores thousands of metrics per second with low CPU overhead.
- Zero Configuration Auto-Discovery: Monitors over 200 services and system resources without manual setup.
- Stream-Based Monitoring Model: Agents can stream metrics to parent nodes or central dashboards.
- Log Integration: System logs (e.g., journald) are visualized alongside metrics for root cause analysis.
Pros
- Easy to deploy and use—Netdata’s single-binary agent is lightweight and self-configuring.
- No external storage needed—data is kept local, enabling fast access and no vendor lock-in.
- Useful for resource-constrained devices or edge monitoring scenarios.
Cons
- Limited monitoring capabilities and integrations for Windows environments
- Limited historical data retention, hindering long-term analysis
- Steep learning curve, especially for beginners
- Users have raised concerns over higher resource usage that require powerful Linux systems
Best For
Small to mid-sized teams needing real-time infrastructure metrics, devs running homelab setups, and edge-device monitoring. Also a good fit for teams that want to avoid SaaS vendor costs or keep data entirely on-prem.
Pricing & Customer Reviews
- Community: Free tier
- Homelab: $90/year per space — unlimited metrics & dashboards; limited to non-professional use
- Business: $4.50 per node/month — includes logs, metrics, alerts, dashboards, config management
- Enterprise (On-Premise): Starts at 200 node licenses — custom support & SLA, data isolation
- Customer Rating: 4.5/5 on G2
Reviewers praise Netdata’s responsiveness and ease of use in small-scale deployments, but flag issues with advanced alerting, scalability in distributed environments, and feature gating behind Netdata Cloud.
Top 7 Netdata Alternatives
1. CubeAPM
Known For
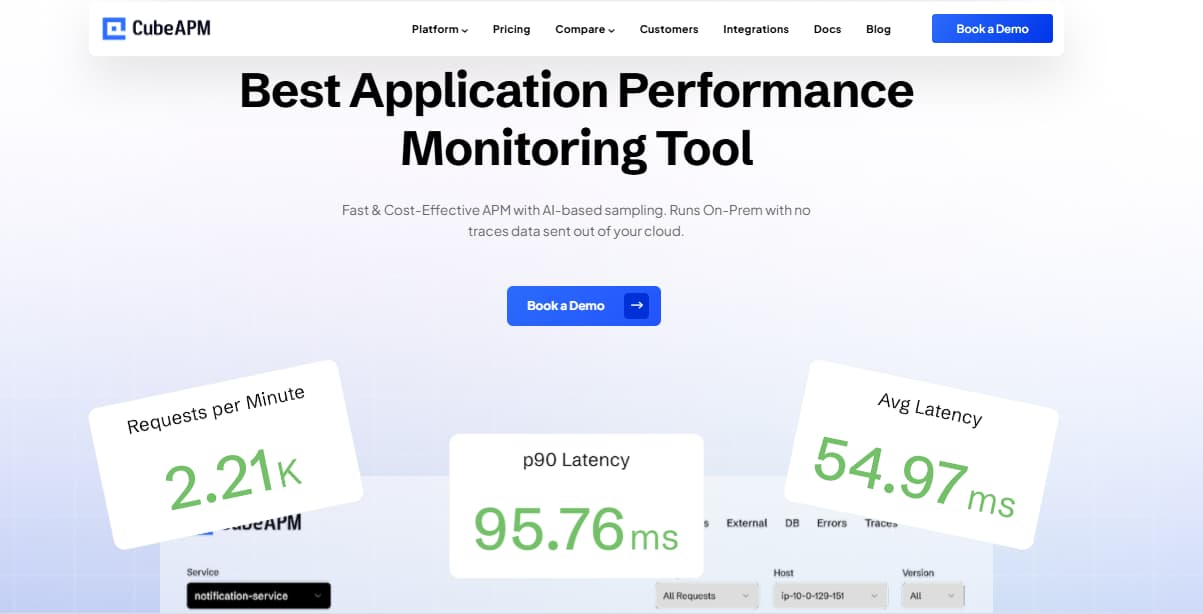
Modern, OpenTelemetry-native full-stack observability platform offering low-cost APM, logs, infrastructure, RUM, and synthetics — all self-hosted and privacy-compliant. CubeAPM is designed to deliver enterprise-grade telemetry at a fraction of the cost of traditional APM tools.
Key Features
- Full-Stack Observability: Includes APM, infrastructure monitoring, distributed tracing, logs, RUM, synthetic checks, and error tracking.
- Smart Sampling: Captures context-rich traces using latency and error signals, ensuring useful data while reducing cost.
- OpenTelemetry-First: Built ground-up with OTEL support, making it easy to integrate with open standards and avoid vendor lock-in.
- On-Premise & BYOC Deployment: Deploy in your cloud or data center to retain full control over compliance and data locality.
- Alerting & SLO Monitoring: Built-in alerting with support for SLAs, burn rates, and multi-channel notifications.
Standout Features
- Zero Egress & Unlimited Retention: All data remains in your infrastructure with no vendor lock-in or hidden data egress fees.
- Cost-Optimized Sampling & Storage: Tail-based sampling retains relevant traces while keeping ingestion costs low.
- Developer-Centric UX: Fast onboarding, real-time dashboards, and deep integration with Slack, WhatsApp, and CI/CD pipelines.
Pros
- Fully self-hostable with rich UI and OpenTelemetry native design.
- Extensive integration ecosystem — 800+ integration plugins
- All modules included — no need for separate licenses for APM, logs, infra, or RUM.
- Rapid support with Slack/WhatsApp access to core developers (TAT in minutes).
- No extra cost for additional users, synthetic runs, or error volumes.
Cons
- Not suited for teams looking for off-prem solutions
- Strictly an observability platform and does not support cloud security management
Best For
Engineering teams seeking cost-effective, privacy-compliant observability with full control over telemetry. Ideal for regulated industries (e.g., fintech, healthtech, SaaS) needing OpenTelemetry-native tooling and zero data egress.
Pricing & Customer Reviews:
- Data Ingestion: $0.15/GB
- G2 Rating: 5/5
CubeAPM vs Netdata
Netdata is a solid full-stack monitoring platform with a strong focus on real-time visibility and infrastructure-level insights, especially in Linux environments. CubeAPM offers full-stack monitoring as well, but is designed for teams looking for broader long-term observability and more predictable, lower costs as data volumes grow, making it a practical alternative when scaling beyond real-time troubleshooting.
2. New Relic
Known For
New Relic is a legacy leader in APM, New Relic is best known for its full-stack observability platform delivered as a cloud-native SaaS. It offers integrated monitoring across applications, infrastructure, logs, traces, RUM, and synthetics, and is widely adopted by enterprise DevOps teams.
Key Features
- Application Monitoring: Track service performance, latency, throughput, and error rates across backend systems.
- Distributed Tracing: Analyze transactions across services and pinpoint bottlenecks in complex architectures.
- Infrastructure Monitoring: Monitor hosts, containers, and Kubernetes with real-time dashboards and health alerts.
- Logs in Context: Correlate logs with trace and APM data to streamline troubleshooting.
- RUM & Synthetics: Measure user experience and simulate browser/API interactions to detect availability issues early.
Standout Features
- New Relic One Platform: A unified interface for MELT data with customizable dashboards, notebooks, and cross-entity correlations.
- CodeStream (IDE Integration): Brings observability into the developer workflow, allowing teams to view production data inside their code editor.
- Telemetry Data Platform: Accepts custom telemetry, OTEL signals, and third-party metrics for unified analysis.
Pros
- Mature SaaS product with wide observability coverage and deep analytics.
- Supports 500+ integrations for cloud platforms, services, and runtimes.
- Rich alerting, anomaly detection, and user experience analytics in a single interface.
Cons
- Expensive user pricing, which can get prohibitively expensive for growing teams.
- Challenging learning curve
- Initial setup is complex, requiring significant knowledge
- Overwhelming UI for beginners
Best For
Large organizations and SaaS companies that want a powerful, all-in-one SaaS observability solution and are comfortable with premium pricing and centralized cloud data hosting.
Pricing & Customer Reviews
- Free tier available: 100 GB/month of data ingest included.
- Data Ingestion: $0.35/GB
- User Licenses: $400/user/month for full access
- Other components: Included in plan; retention extensions and advanced capabilities require the enterprise tier
- Rating: 4.2/5 on G2
Customers appreciate the breadth of monitoring features and the unified interface, but many are dissatisfied with the steep pricing, complex UI, and high costs as usage grows.
New Relic vs Netdata
Netdata is a full-stack monitoring platform best known for real-time, per-second visibility into infrastructure and system behavior, making it effective for live troubleshooting. In contrast, New Relic focuses more on application-level observability, offering deeper APM, long-term analytics, and broader visibility across distributed applications, which can be better suited for teams prioritizing performance analysis and historical insights over real-time operational monitoring.
3. Datadog
Known For
Datadog is widely recognized for its cloud-native, SaaS-first observability platform that provides unified monitoring across infrastructure, applications, logs, RUM, synthetics, and security. It’s especially popular among DevOps and SRE teams managing large-scale, distributed systems.
Key Features
- Infrastructure Monitoring: Visualize performance across hosts, containers, and services with 900+ native integrations.
- Application Performance Monitoring (APM): Track distributed traces, service maps, latency, and error rates across microservices.
- Log Management: Collect, ingest, index, and archive logs with field-level filtering and analytics.
- Real User Monitoring (RUM): Measure end-user experience, page load times, and frontend issues across devices and locations.
- Synthetic Monitoring: Simulate user journeys and API checks to detect performance or availability issues before users do.
Standout Features
- Watchdog AI: Automated anomaly detection across metrics, logs, and traces using ML models.
- 900+ Integrations: Rich ecosystem across cloud providers (AWS, Azure, GCP), CI/CD tools, containers, and databases.
- Unified Dashboarding & Correlation: Seamlessly pivot between infrastructure metrics, application traces, and logs in a single UI.
Pros
- Full MELT observability in one platform with mature enterprise support.
- High customization across dashboards, alerting, and analytics.
- Seamless multi-cloud and Kubernetes-native integration.
Cons
- High costs as usage grows
- Steep learning curve to fully master advanced features
- Overwhelming UI, which can hinder usability
Best For
Enterprises operating complex, cloud-native infrastructure looking for an all-in-one SaaS observability platform with rich features, deep integrations, and end-to-end MELT visibility.
Pricing & Customer Reviews
- Infrastructure Monitoring (Pro Plan): $15/host/month
- APM (Pro Plan): $35/host/month
- Logs: $0.10/per ingested GB/month
- Rating: 4.3/5 on G2
Users consistently rate Datadog high for feature depth and integrations, but common pain points include pricing complexity, surprise overages, and steep costs for high-cardinality workloads.
Datadog vs Netdata
Netdata emphasizes real-time, per-second infrastructure monitoring with simple setup and predictable pricing, making it effective for live troubleshooting. Datadog offers broader observability with deeper analytics and extensive integrations, which suits teams managing complex, large-scale environments.
4. Dynatrace
Known For
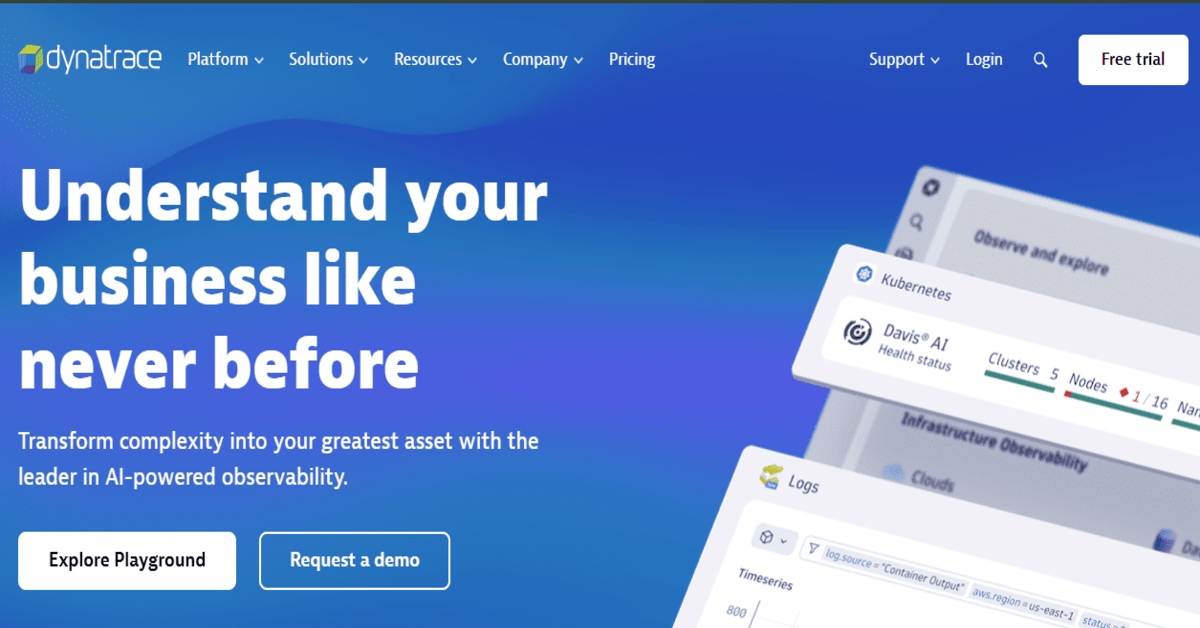
Dynatrace is best known for its AI-powered observability platform that delivers automated insights across applications, infrastructure, logs, RUM, synthetics, and security. It’s heavily adopted in enterprises with large, complex, or hybrid environments.
Key Features
- APM & Code-Level Tracing: Deep transaction tracing across distributed services with built-in performance profiling.
- Smartscape Topology Mapping: Visualizes service dependencies in real time for faster root cause isolation.
- Logs & Events: Ingests and analyzes logs with trace and metric correlation.
- Digital Experience Monitoring (DEM): Real user monitoring and synthetic checks for frontend performance.
- Kubernetes & Multi-Cloud Monitoring: Unified visibility across containers, cloud workloads, and on-prem systems.
Standout Features
- Davis AI Engine: Dynatrace’s signature AI core delivers automatic root cause detection and predictive analytics.
- Auto-Instrumentation: Automatically discovers and monitors new services with minimal manual setup.
- All-in-One Agent: A single OneAgent handles metrics, traces, logs, and more—no need for separate plugins.
Pros
- Highly automated with strong out-of-the-box intelligence.
- Built for scale — handles large environments with dynamic workloads.
- Full MELT observability backed by robust AI-driven insights.
Cons
- Premium pricing makes it less viable for smaller teams.
- Steep learning curve for advanced use cases and data modeling
- UI / UX can sometimes be overwhelming or non-intuitive
Best For
Enterprises seeking automated observability across complex hybrid and cloud-native infrastructure, with minimal manual configuration and AI-powered troubleshooting.
Pricing & Customer Reviews
- Full-Stack Monitoring: $58 /month/8 GiB host
- Infra Monitoring: $29/month/8 GiB host
- G2 Rating: 4.4/5
Dynatrace vs Netdata
Netdata focuses on real-time, per-second infrastructure monitoring with quick setup and clear pricing, making it strong for live operational visibility. Dynatrace provides deeper application performance monitoring with AI-driven analysis and more extensive enterprise-grade observability, which can better support complex applications and large environments.
5. Coralogix
Known For
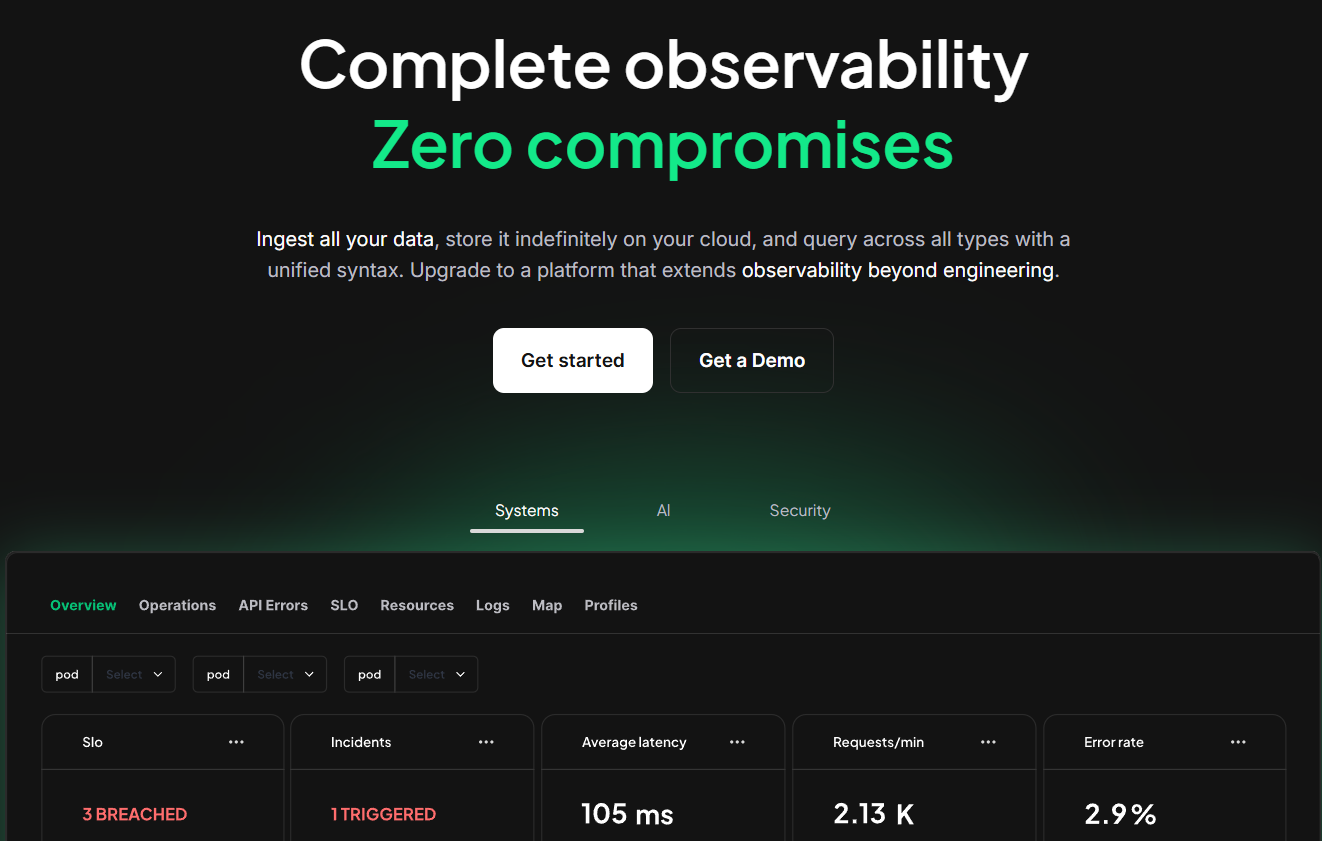
Coralogix is known for its cost-optimized log analytics and observability platform, offering native support for logs, metrics, traces, and security data. Its unique storage architecture reduces costs by indexing only what’s needed and archiving the rest directly to the customer’s cloud.
Key Features
- Stream-Based Processing: Data is parsed, enriched, and routed before storage, enabling faster analytics and reduced indexing costs.
- Logs, Metrics & Traces: Unified ingestion pipeline supports all three telemetry types with easy correlation.
- Real-Time Alerting: Trigger alerts on live or historical data using queries and machine learning.
- RUM & Synthetics: Capture frontend performance and simulate user journeys to identify regressions and downtime.
- Compliance Mode: Allows logs to be archived in customer-owned cloud storage for lower TCO and better data control.
Standout Features
- Archive-First Architecture: Archived logs go directly to the customer’s S3 or compatible bucket, allowing long retention with minimal cost.
- No Vendor Lock-in: Open file formats and cloud-hosted archives give teams full ownership of their telemetry.
- Live Tail & Query-less Insights: Monitor production logs in real-time without query lag.
Pros
- Significant cost savings via decoupled storage and indexing.
- Native MELT support with scalable ingestion volumes.
- Strong data pipeline customization for routing and filtering.
Cons
- Archived data retrieval incurs egress fees from the cloud provider.
- UI and setup can be complex for first-time users, especially with routing rules and schema definitions.
- Costs spike as usage grows
Best For
Engineering teams looking for low-cost log and trace ingestion, especially at high volumes, while retaining full control over long-term storage and compliance workflows.
Pricing & Customer Reviews
- Logs: $0.42/GB
- Traces: $0.16/GB
- Metrics: $0.05/GB
- G2 Rating: 4.4/5
Coralogix vs Netdata
Netdata focuses on real-time, per-second infrastructure monitoring with simple setup and predictable pricing, making it effective for live operational visibility. Coralogix emphasizes log analytics and insights with scalable long-term storage and query capabilities, which can better support teams prioritizing deep log analysis and historical data exploration.
6. Sentry
Known For
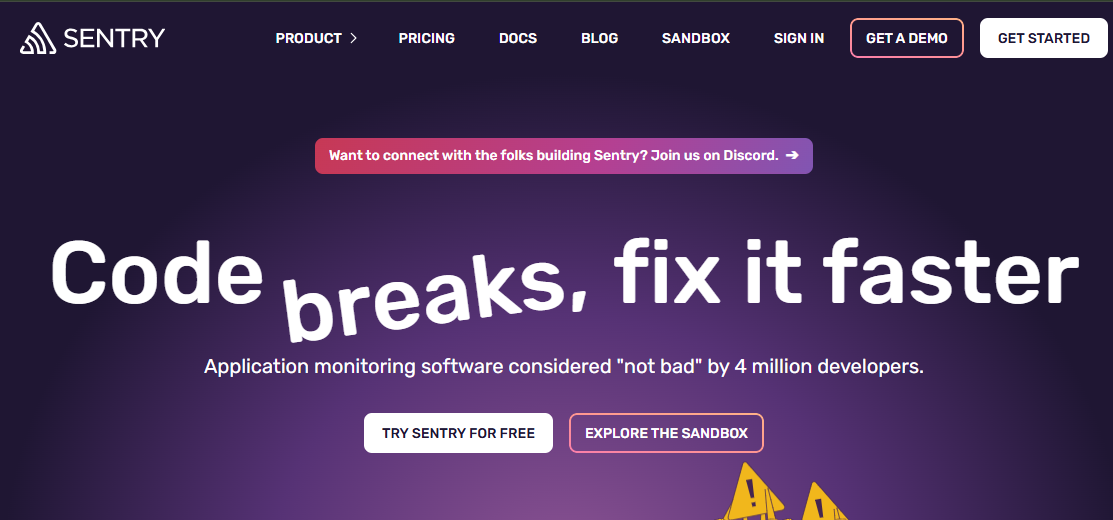
Sentry is primarily known for its error and exception monitoring platform that helps developers detect, triage, and fix issues in real time. It has expanded into performance monitoring and supports backend services, frontend applications, and mobile platforms.
Key Features
- Error Tracking: Aggregates exceptions, stack traces, and impacted users in one view for faster triage.
- Performance Monitoring: Includes transaction tracing and latency breakdowns by function, database call, or external API.
- Release Health & Session Monitoring: Track deploys, crash-free sessions, and user impact per release.
- Frontend & Mobile Monitoring: JavaScript, React Native, iOS, and Android support with source maps and crash context.
- Issue Grouping & Alerts: Detect regressions, assign issues to owners, and trigger alerts based on thresholds.
Standout Features
- Developer-Centric Design: Built for engineering workflows with GitHub/Bitbucket integration and Slack alerting.
- Trace-Aware Error Context: See related spans and service calls when exceptions occur — bridging errors and APM.
- Tag-Based Filtering: Custom tags and breadcrumbs enhance observability and issue prioritization.
Pros
- Fast setup with SDKs for every major language and framework.
- Purpose-built for debugging and issue resolution, not just monitoring.
- Detailed stack traces and session-level diagnostics for frontend and backend apps.
Cons
- Error-visibility delays
- Pricing and plan-limit frustrations
- Complex configuration and scaling difficulties
Best For
Developer teams that need high-fidelity error tracking and basic performance insights in frontend, backend, or mobile apps — without requiring full observability or infrastructure monitoring.
Pricing & Customer Reviews
- Free tier: One user, error monitoring, and tracing
- Team: $26/month includes unlimited users, third-party integrations, metric alerts
- Business: $80/month includes team features +, insights (90 day lookback), custom dashboards
- Enterprise: Custom
- G2 Rating: 4.4/5
Sentry vs Netdata
Netdata provides a broad, real-time view of system and service health, covering infrastructure and application metrics with high-resolution data suited for operational monitoring. Sentry approaches observability from the application side, concentrating on error tracking, stack traces, and performance issues inside code, making it more useful for debugging software failures than monitoring overall system behavior.
7. IBM Instana

Known For
IBM Instana is known for its automated observability platform tailored for dynamic, containerized, and microservice-based environments. Acquired by IBM, it combines deep APM capabilities with real-time monitoring, AI-powered analysis, and seamless Kubernetes support.
Key Features
- APM & Distributed Tracing: Transaction-level observability across microservices with high granularity and low latency.
- Automatic Discovery: Zero-config instrumentation and dynamic dependency mapping of services, containers, and hosts.
- Real-Time Metrics: One-second granularity for infra and application metrics with no sampling delay.
- Smart Alerts & Anomaly Detection: Alerts generated via pre-built health signatures and ML-based anomaly detection.
- Log Correlation & Events: Log data contextualized with trace spans and performance anomalies.
Standout Features
- Unbounded Cardinality Support: Handles high-cardinality metrics without rate limiting or indexing penalties.
- Continuous Profiling: Live code-level profiling across services, even in production environments.
- Instant Root Cause Analysis: Instana’s automated correlation engine accelerates incident response.
Pros
- Strong auto-instrumentation across multiple platforms with minimal manual config.
- Real-time analytics with one-second resolution.
- Excellent Kubernetes and service mesh visibility.
- Built-in continuous profiling and root cause tracing.
Cons
- High cost for smaller teams
- A complex user interface that limits usability
- Steep learning curve, especially for beginners
Best For
Large-scale DevOps and platform engineering teams looking for automated, production-grade observability with instant insights and full visibility into modern distributed systems.
Pricing & Customer Reviews:
- Essentials: $20/month/host
- Standard: $75/month/host
- self-hosting: custom
- G2 Rating: 4.3/5
IBM Instana vs Netdata
Netdata delivers high-resolution, real-time infrastructure and system monitoring with a lightweight setup and transparent pricing, making it strong for live operational visibility. IBM Instana combines automated application performance monitoring with distributed tracing and AI-driven root-cause analysis, which can better support teams needing deep APM and detailed service dependency insights in complex microservices environments.
Conclusion
Netdata is a solid option for real-time infrastructure monitoring; however, users report limited Windows support, constrained historical data retention, higher resource usage, and a confusing alert configuration.
For teams that require more depth, flexibility, and deployment control, alternatives like CubeAPM offer a stronger value proposition with native OpenTelemetry support, full-stack observability, and self-hosting capabilities. Enterprise options, such as Datadog, Dynatrace, and Instana, provide advanced features but at a significantly higher cost. The right choice depends on your use case, scale, and compliance requirements.
Disclaimer: The information in this article reflects the latest details available at the time of publication and may change as technologies and products evolve.
FAQs
1. What are the best alternatives to Netdata for full-stack observability?
Top Netdata alternatives include CubeAPM, Datadog, New Relic, Dynatrace, Coralogix, Sentry, and IBM Instana. These tools offer broader MELT coverage, with features like APM, log management, RUM, synthetics, and smart sampling.
2. Why are teams switching from Netdata to other observability tools?
While Netdata excels at real-time infrastructure monitoring, it lacks built-in distributed tracing, advanced alerting, centralized storage, and full MELT support. Teams needing production-grade observability or compliance often look for more complete solutions.
3. Is there a self-hosted alternative to Netdata with full MELT support?
Yes, CubeAPM is a leading self-hosted alternative offering native OpenTelemetry support, smart sampling, and full-stack observability (APM, logs, infra, RUM, synthetics) — all without vendor lock-in.
4. Which Netdata alternative is best for large-scale microservices?
Dynatrace and IBM Instana are better suited for large, dynamic environments due to their AI-powered automation, auto-instrumentation, and scalable dependency mapping — features Netdata lacks.
5. Which is the most cost-effective alternative to Netdata?
CubeAPM offers the most transparent and affordable pricing, starting at $0.15/GB with no hidden user or module fees. It provides enterprise-grade features at a fraction of the cost of tools like Datadog or New Relic.


